| Param | Original file | Final file |
|---|---|---|
| Filename | modeM0/AS1G05_221T01_9000000442_03257cztM0_level2.evt | modeM0/AS1G05_221T01_9000000442_03257cztM0_level2_quad_clean.evt |
| Size (bytes) | 457,009,920 | 77,947,200 |
| Size | 435.8 MB | 74.3 MB |
| Events in quadrant A | 2,971,627 | 483,527 |
| Events in quadrant B | 3,410,670 | 492,576 |
| Events in quadrant C | 3,529,025 | 482,464 |
| Events in quadrant D | 3,501,929 | 462,719 |
| Mode M9 | |||
|---|---|---|---|
| Quadrant | BADHDUFLAG | Total packets | Discarded packets |
| A | 0 | 14 | 0 |
| B | 0 | 14 | 0 |
| C | 0 | 14 | 0 |
| D | 0 | 15 | 0 |
| Mode SS | |||
|---|---|---|---|
| Quadrant | BADHDUFLAG | Total packets | Discarded packets |
| A | 0 | 128 | 0 |
| B | 0 | 128 | 0 |
| C | 0 | 128 | 0 |
| D | 0 | 128 | 0 |
| Mode M0 | |||
|---|---|---|---|
| Quadrant | BADHDUFLAG | Total packets | Discarded packets |
| A | 0 | 12984 | 3 |
| B | 0 | 14132 | 2 |
| C | 0 | 14663 | 2 |
| D | 0 | 14839 | 2 |
| Quadrant | Total seconds | Saturated seconds | Saturation percentage |
|---|---|---|---|
| A | 6289 | 13 | 0.206710% |
| B | 6289 | 45 | 0.715535% |
| C | 6289 | 97 | 1.542376% |
| D | 6289 | 182 | 2.893942% |
Noise dominated data is calculated using 1-second bins in cleaned event files. If a bin has >2000 counts, and if more than 50% of those come from <1% of pixels, then it is considered to be noise-dominated and hence unusable.
| Quadrant | # 1 sec bins | Bins with >0 counts | Bins with >2000 counts | High rate bins dominated by noise | Noise dominated (total time) | Noise dominated (detector-on time) | Marked lightcurve |
|---|---|---|---|---|---|---|---|
| A | 7574 | 6290 | 0 | 0 | 0.00% | 0.00% |  |
| B | 7574 | 6290 | 8 | 8 | 0.11% | 0.13% |  |
| C | 7574 | 6290 | 61 | 61 | 0.81% | 0.97% | 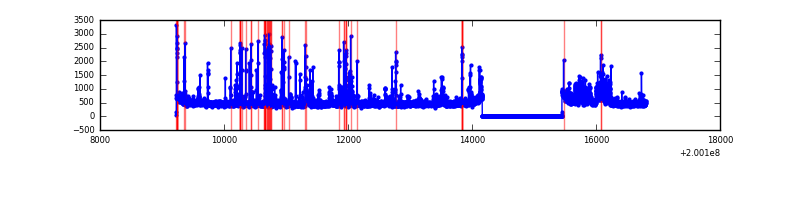 |
| D | 7574 | 6290 | 153 | 153 | 2.02% | 2.43% |  |
Top three noisy pixels from each quadrant. If the there are fewer than three noisy pixels in the level2.evt file, extra rows are filled as -1
| Pixel properties | Quadrant properties | ||||||
|---|---|---|---|---|---|---|---|
| Quadrant | DetID | PixID | Counts | Sigma | Mean | Median | Sigma |
| A | 0 | 118 | 55499 | 367.9 | 739 | 725 | 148.9 |
| A | 3 | 1 | 54072 | 358.31 | 739 | 725 | 148.9 |
| A | 0 | 226 | 12821 | 81.24 | 739 | 725 | 148.9 |
| B | 15 | 204 | 335464 | 2337.64 | 759 | 742 | 143.2 |
| B | 3 | 0 | 49508 | 340.57 | 759 | 742 | 143.2 |
| B | 2 | 249 | 40657 | 278.76 | 759 | 742 | 143.2 |
| C | 14 | 223 | 464972 | 2783.67 | 725 | 730 | 166.8 |
| C | 1 | 192 | 174416 | 1041.45 | 725 | 730 | 166.8 |
| C | 12 | 175 | 28936 | 169.13 | 725 | 730 | 166.8 |
| D | 13 | 223 | 552207 | 3235.43 | 712 | 692 | 170.5 |
| D | 13 | 114 | 79202 | 460.57 | 712 | 692 | 170.5 |
| D | 12 | 233 | 72241 | 419.74 | 712 | 692 | 170.5 |
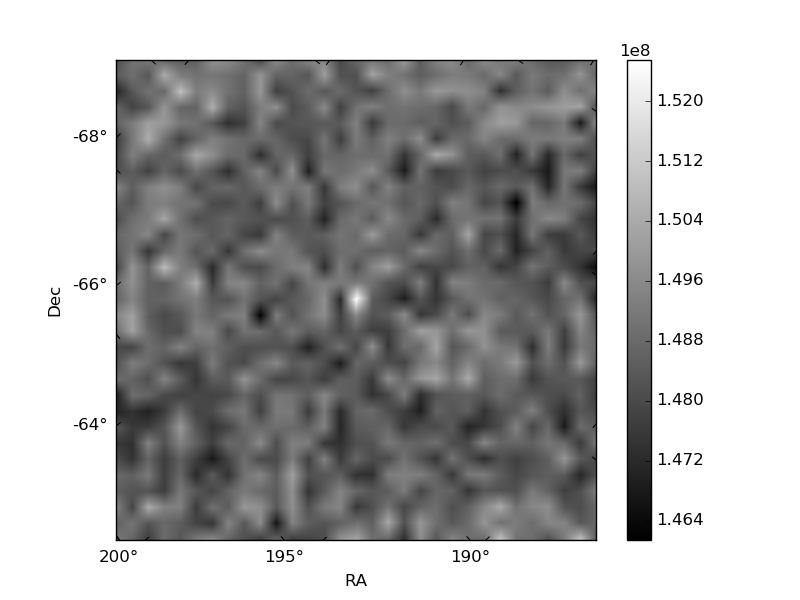
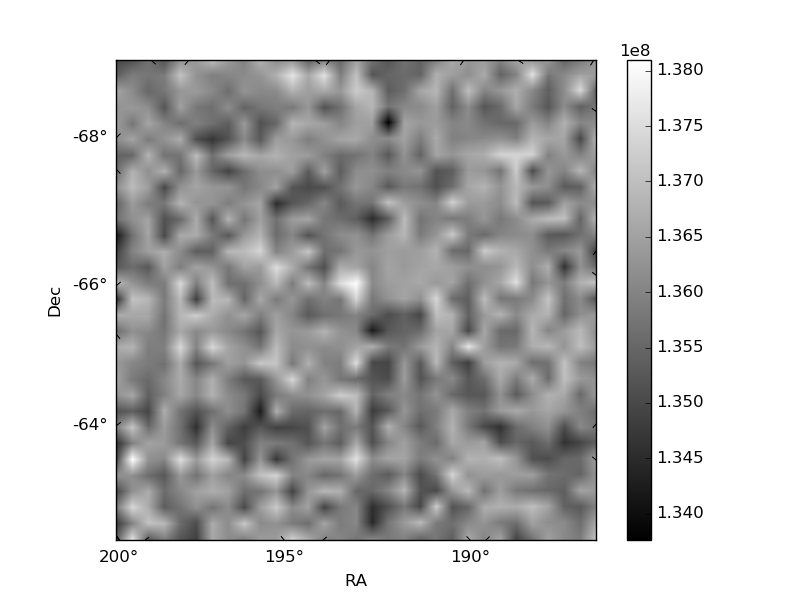
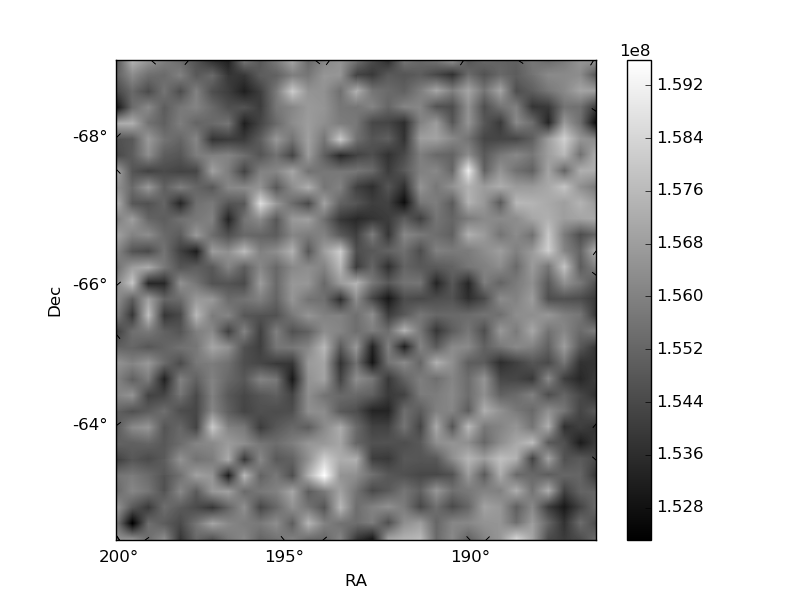
Histogram calculated using DETX and DETY for each event in the final _common_clean file
| Quadrant A | 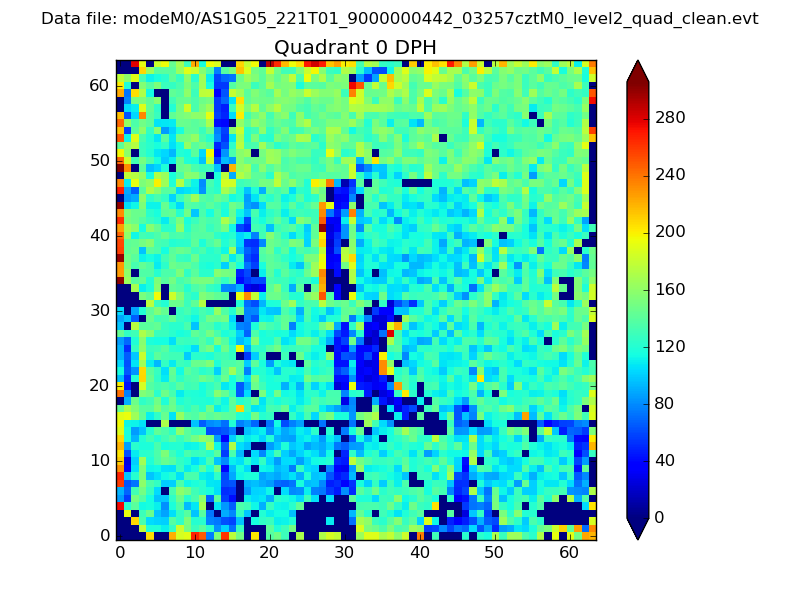 |
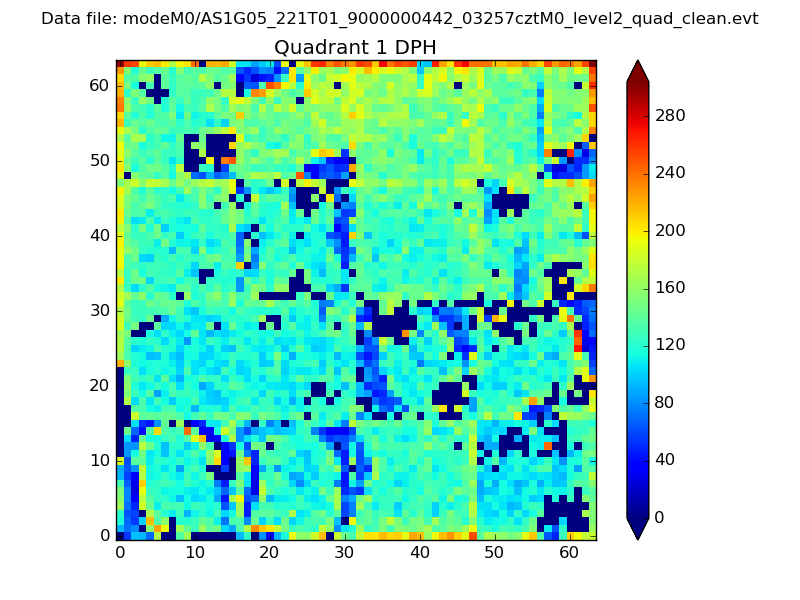 |
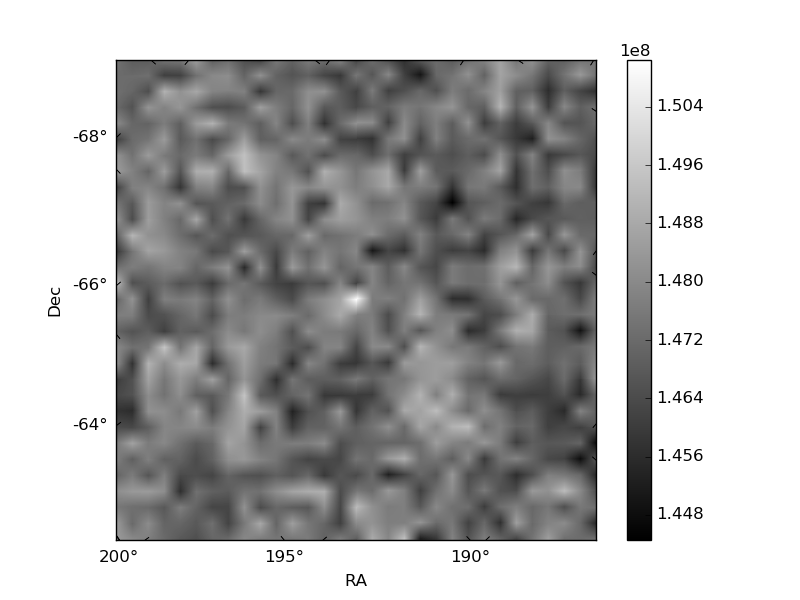
Quadrant B |
|---|---|---|---|
| Quadrant D | 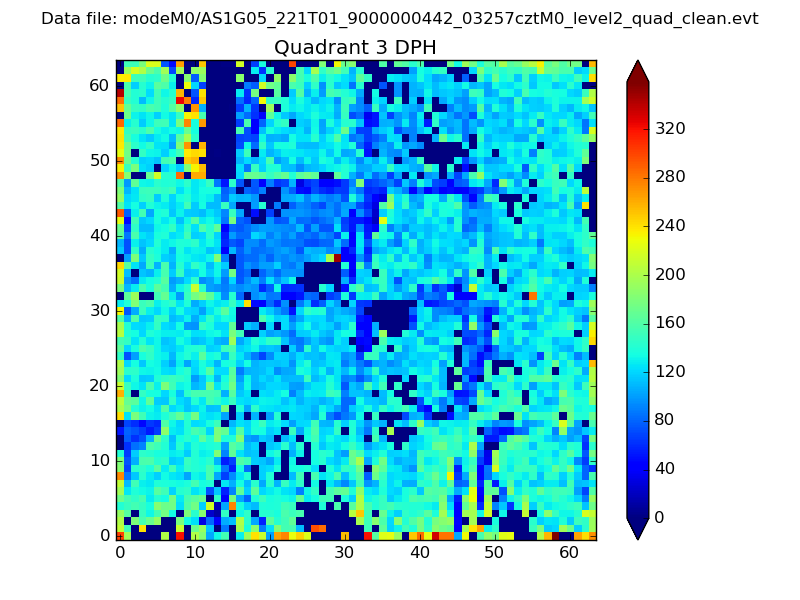 |
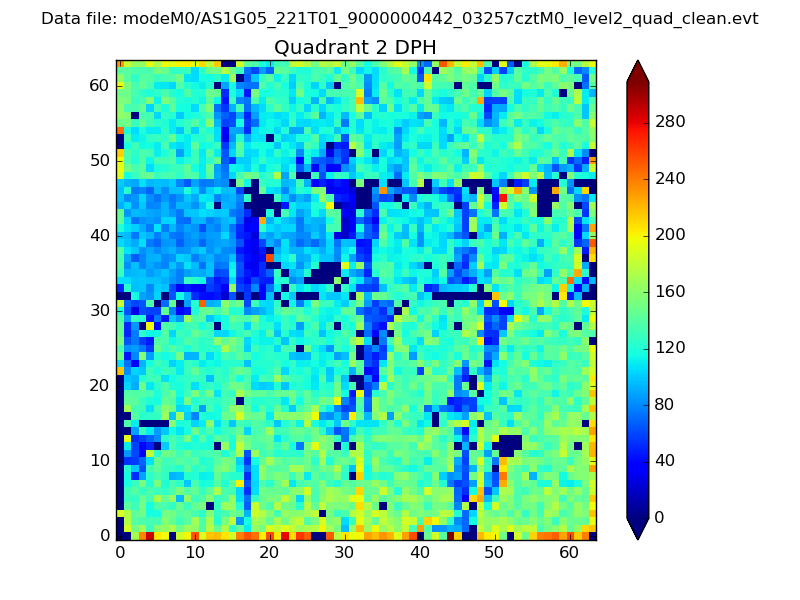 |
Quadrant C |
| Plot type | Count rate plots | Images |
|---|---|---|
| Comparison with Poisson distribution Blue bars denote a histogram of data divided into 1 sec bins. Red curve is a Poisson curve with rate = median count rate of data. |
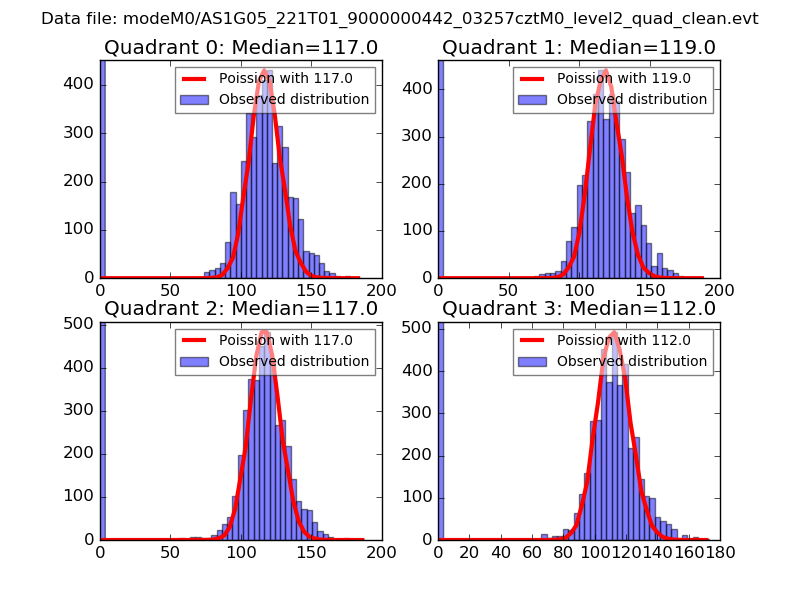 |
 |
| Quadrant-wise count rates Data is divided into 100 sec bins |
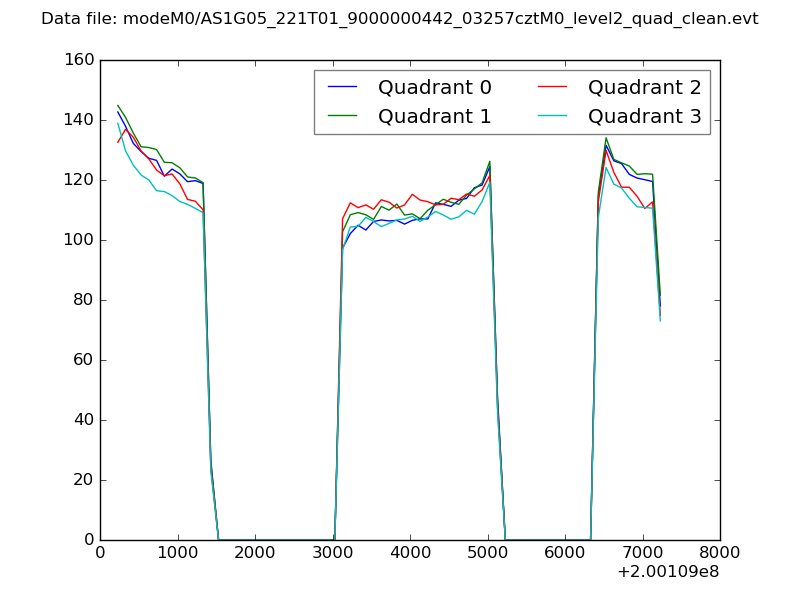 |
|
| Module-wise count rates for Quadrant A Data is divided into 100 sec bins |
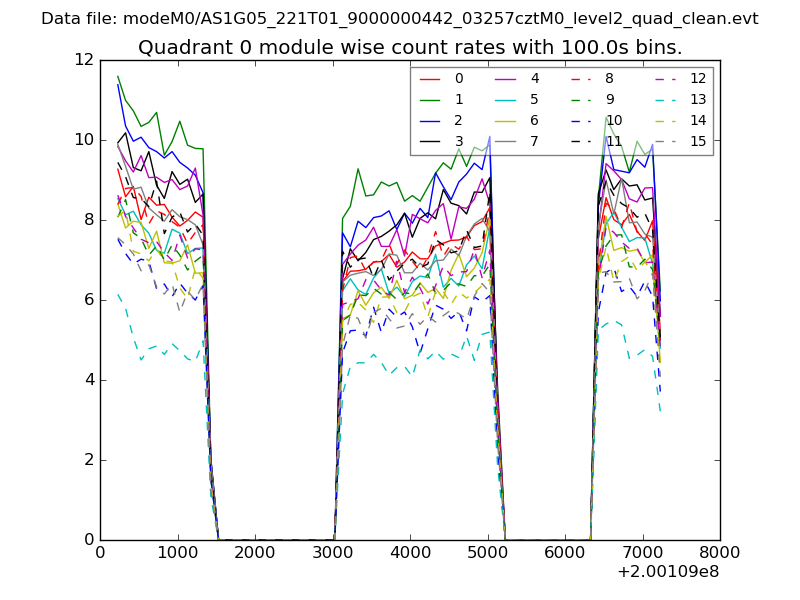 |
 |
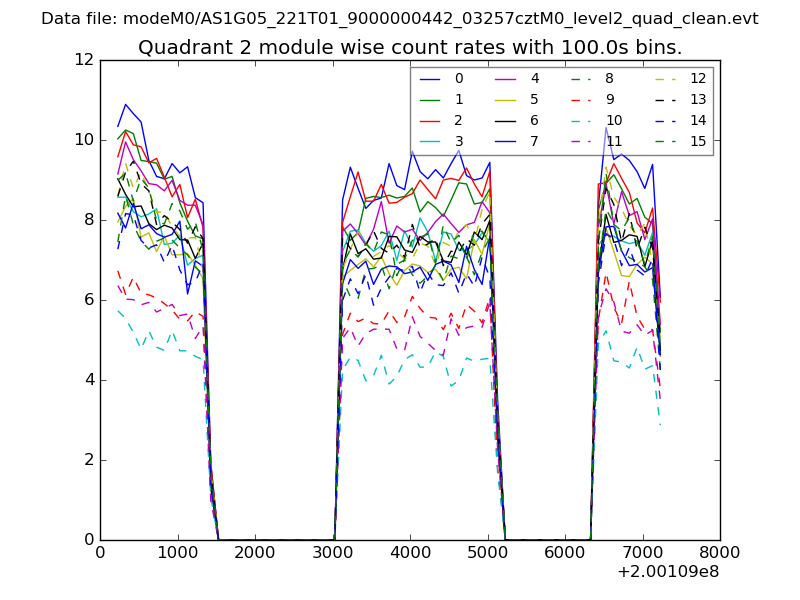
| Module-wise count rates for Quadrant B Data is divided into 100 sec bins |
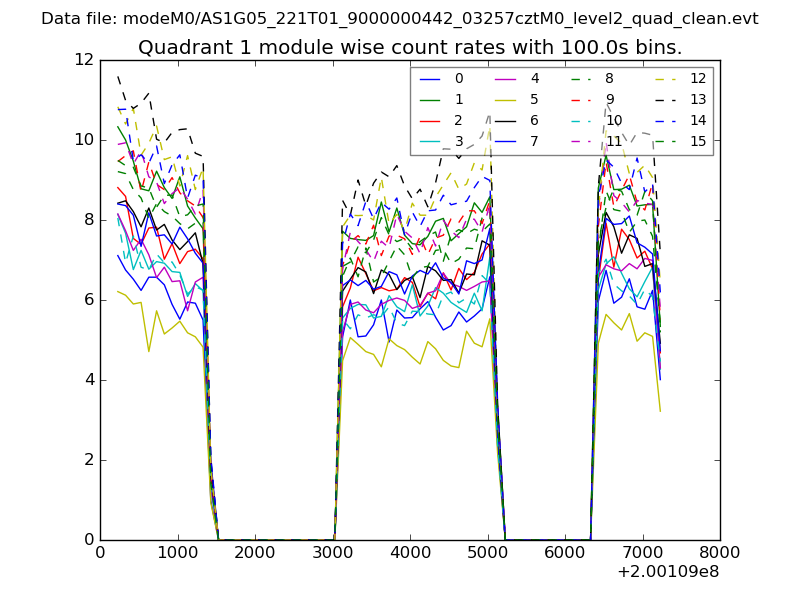 |
 |
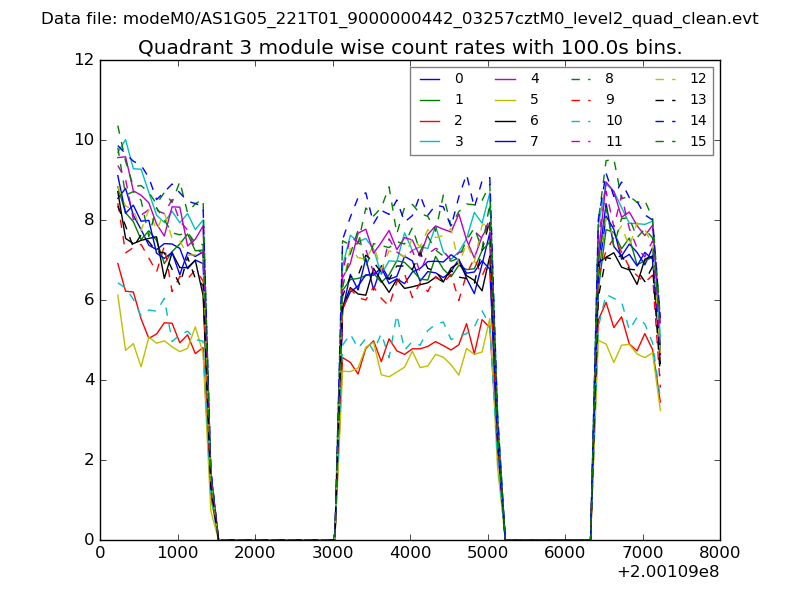
| Module-wise count rates for Quadrant C Data is divided into 100 sec bins |
 |
 |
| Module-wise count rates for Quadrant D Data is divided into 100 sec bins |
 |
 |
| Parameter | Plot |
|---|---|
| CZT HV Monitor | 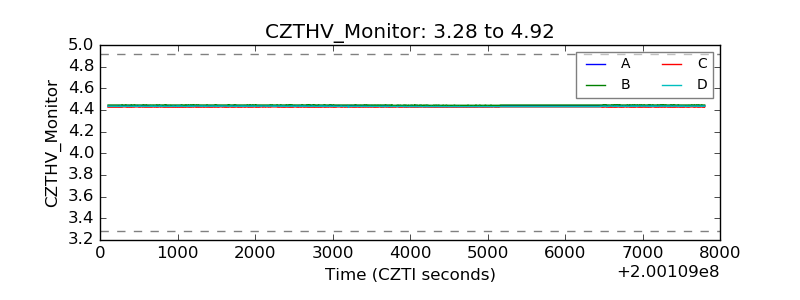 |
| D_VDD | 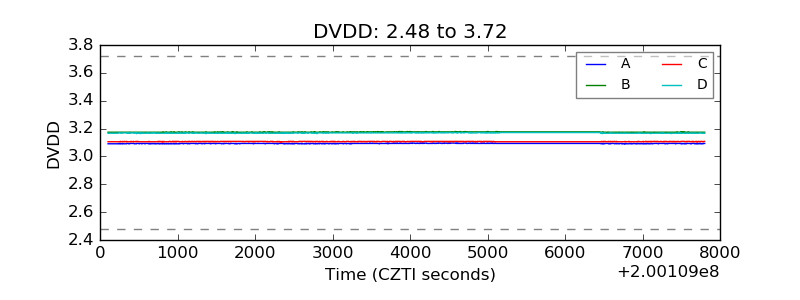 |
| Temperature 1 |  |
| Veto HV Monitor | 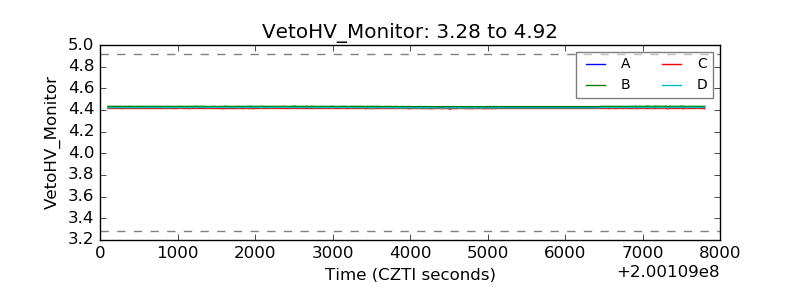 |
| Veto LLD | 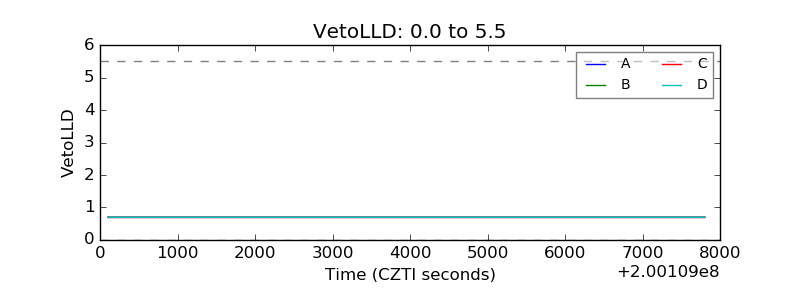 |
| Alpha Counter | 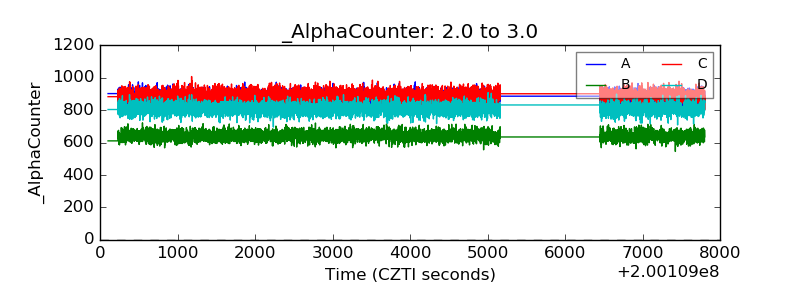 |
| _CPM_Rate | 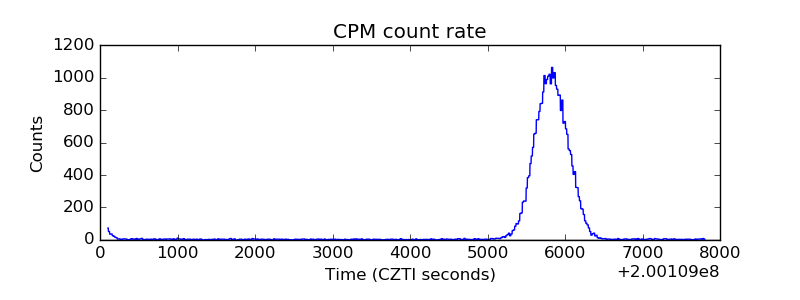 |
| CZT Counter | 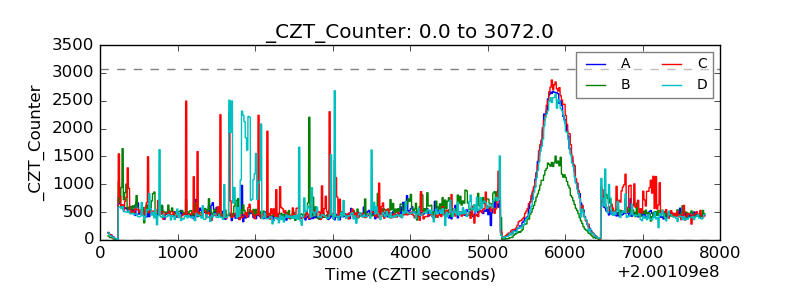 |
| +2.5 Volts monitor |  |
| +5 Volts monitor |  |
| _ROLL_ROT | 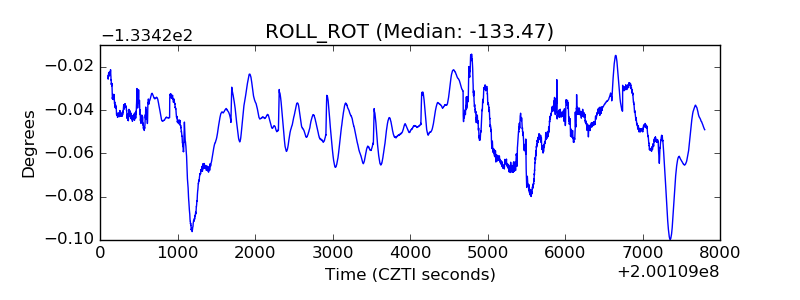 |
| _Roll_DEC | 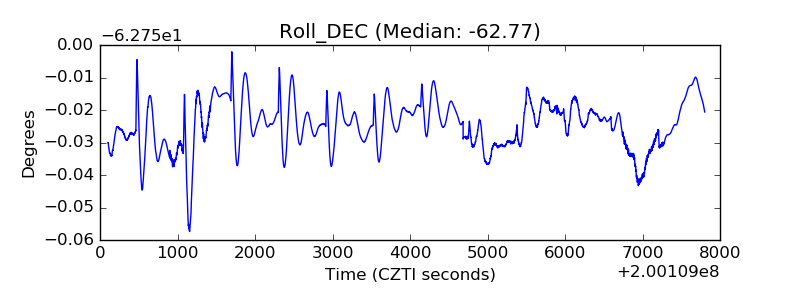 |
| _Roll_RA | 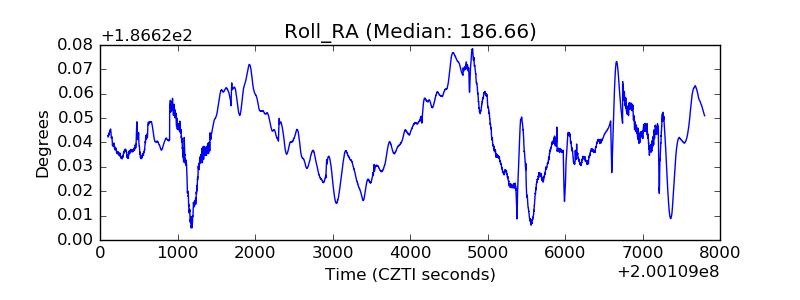 |
| Veto Counter | 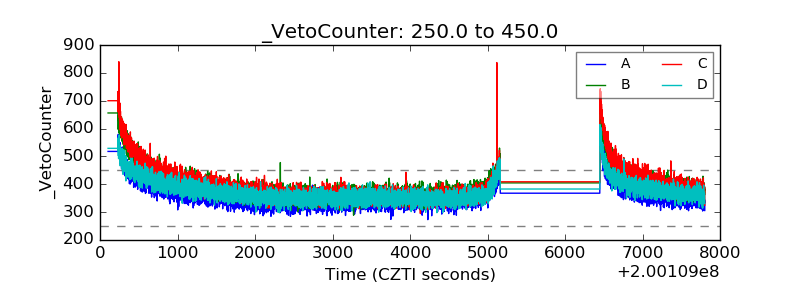 |