| Param | Original file | Final file |
|---|---|---|
| Filename | modeM0/AS1G05_221T01_9000000442_03258cztM0_level2.evt | modeM0/AS1G05_221T01_9000000442_03258cztM0_level2_quad_clean.evt |
| Size (bytes) | 450,008,640 | 72,547,200 |
| Size | 429.2 MB | 69.2 MB |
| Events in quadrant A | 3,130,610 | 438,534 |
| Events in quadrant B | 3,431,084 | 444,965 |
| Events in quadrant C | 3,317,972 | 438,018 |
| Events in quadrant D | 3,308,123 | 422,919 |
| Mode M9 | |||
|---|---|---|---|
| Quadrant | BADHDUFLAG | Total packets | Discarded packets |
| A | 0 | 15 | 0 |
| B | 0 | 15 | 0 |
| C | 0 | 15 | 0 |
| D | 0 | 16 | 0 |
| Mode SS | |||
|---|---|---|---|
| Quadrant | BADHDUFLAG | Total packets | Discarded packets |
| A | 0 | 132 | 0 |
| B | 0 | 132 | 0 |
| C | 0 | 132 | 0 |
| D | 0 | 132 | 0 |
| Mode M0 | |||
|---|---|---|---|
| Quadrant | BADHDUFLAG | Total packets | Discarded packets |
| A | 0 | 13751 | 3 |
| B | 0 | 14272 | 2 |
| C | 0 | 14316 | 2 |
| D | 0 | 14509 | 2 |
| Quadrant | Total seconds | Saturated seconds | Saturation percentage |
|---|---|---|---|
| A | 6484 | 94 | 1.449722% |
| B | 6484 | 108 | 1.665638% |
| C | 6484 | 68 | 1.048735% |
| D | 6484 | 134 | 2.066626% |
Noise dominated data is calculated using 1-second bins in cleaned event files. If a bin has >2000 counts, and if more than 50% of those come from <1% of pixels, then it is considered to be noise-dominated and hence unusable.
| Quadrant | # 1 sec bins | Bins with >0 counts | Bins with >2000 counts | High rate bins dominated by noise | Noise dominated (total time) | Noise dominated (detector-on time) | Marked lightcurve |
|---|---|---|---|---|---|---|---|
| A | 7609 | 6485 | 16 | 16 | 0.21% | 0.25% | 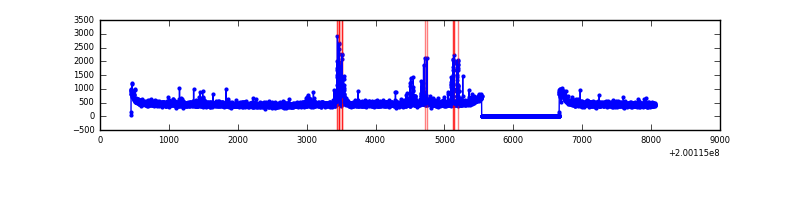 |
| B | 7609 | 6485 | 19 | 19 | 0.25% | 0.29% |  |
| C | 7609 | 6485 | 9 | 9 | 0.12% | 0.14% | 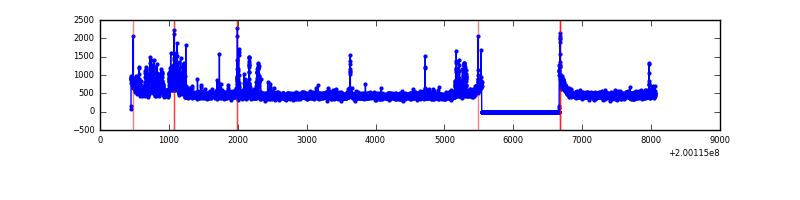 |
| D | 7609 | 6485 | 71 | 71 | 0.93% | 1.09% | 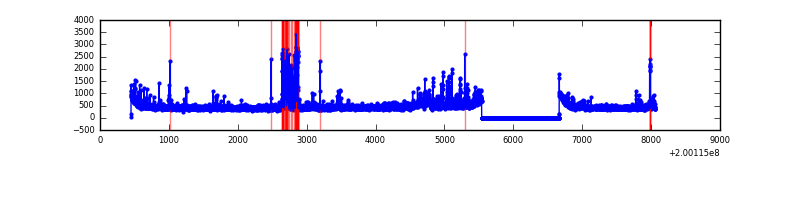 |
Top three noisy pixels from each quadrant. If the there are fewer than three noisy pixels in the level2.evt file, extra rows are filled as -1
| Pixel properties | Quadrant properties | ||||||
|---|---|---|---|---|---|---|---|
| Quadrant | DetID | PixID | Counts | Sigma | Mean | Median | Sigma |
| A | 0 | 118 | 150652 | 981.25 | 757 | 742 | 152.8 |
| A | 3 | 1 | 29838 | 190.45 | 757 | 742 | 152.8 |
| A | 0 | 226 | 21796 | 137.81 | 757 | 742 | 152.8 |
| B | 15 | 204 | 313996 | 2106.74 | 775 | 755 | 148.7 |
| B | 5 | 200 | 105869 | 706.96 | 775 | 755 | 148.7 |
| B | 12 | 111 | 9440 | 58.41 | 775 | 755 | 148.7 |
| C | 1 | 192 | 188873 | 1092.61 | 746 | 749 | 172.2 |
| C | 12 | 175 | 115752 | 667.93 | 746 | 749 | 172.2 |
| C | 14 | 223 | 72049 | 414.11 | 746 | 749 | 172.2 |
| D | 13 | 223 | 144659 | 753.18 | 728 | 711 | 191.1 |
| D | 13 | 114 | 141909 | 738.79 | 728 | 711 | 191.1 |
| D | 12 | 233 | 126061 | 655.87 | 728 | 711 | 191.1 |
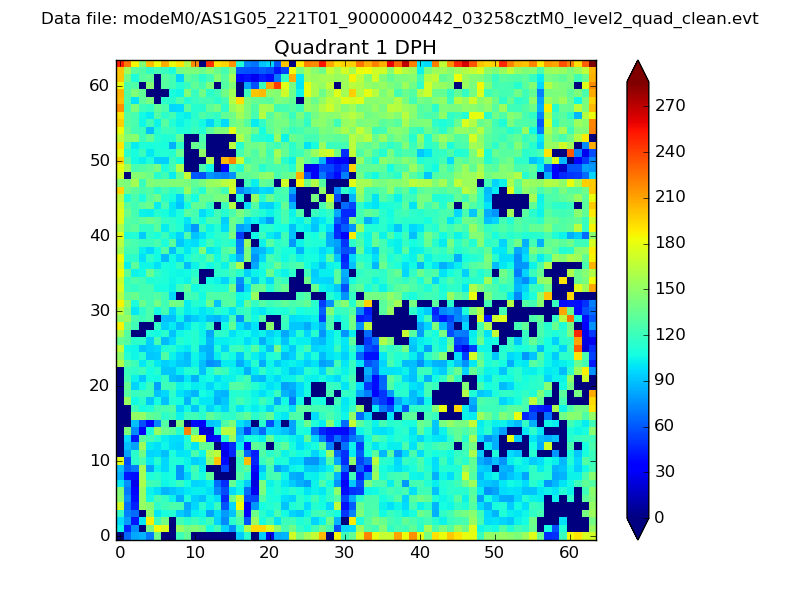
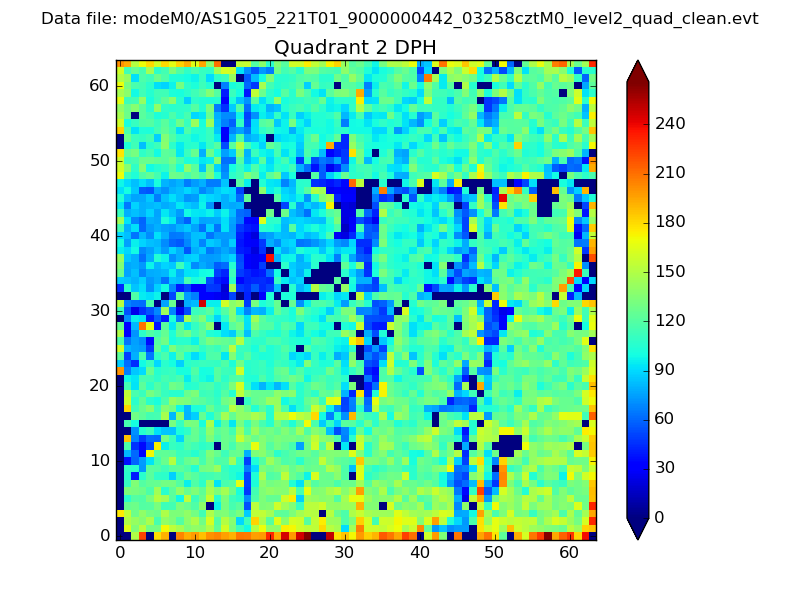
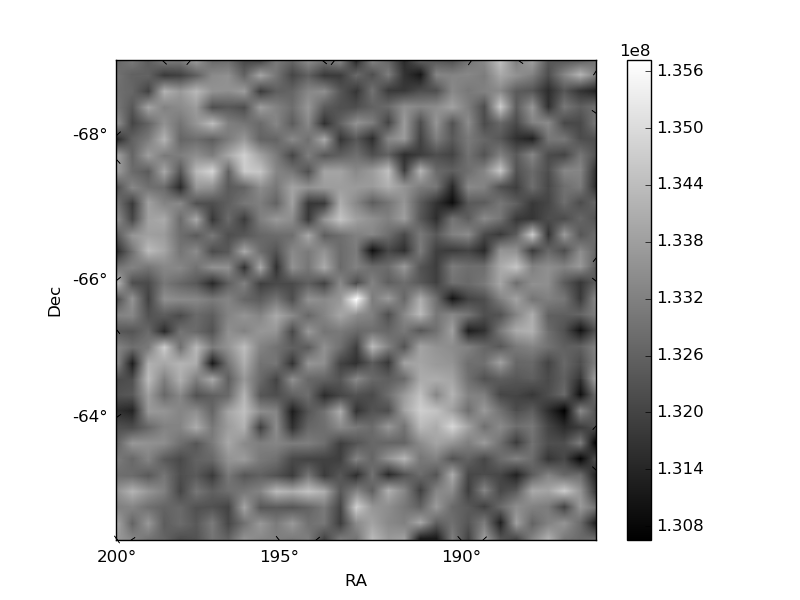
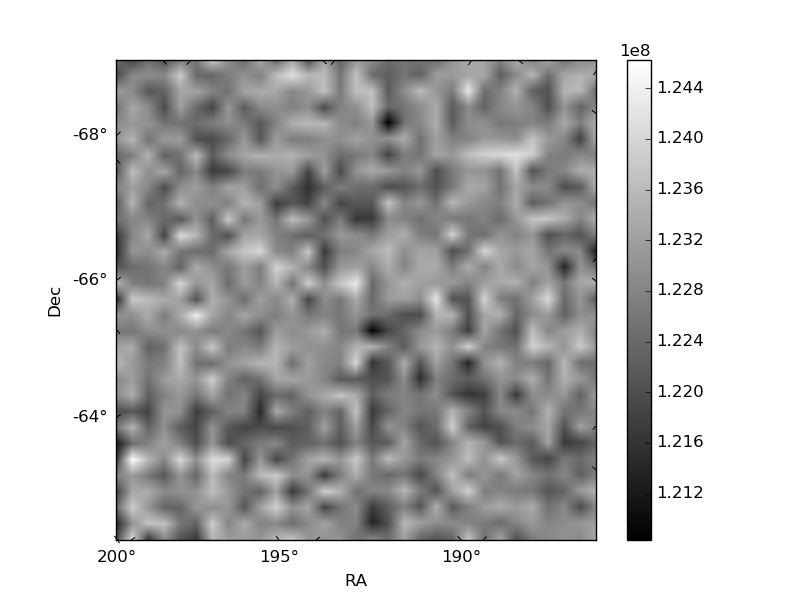
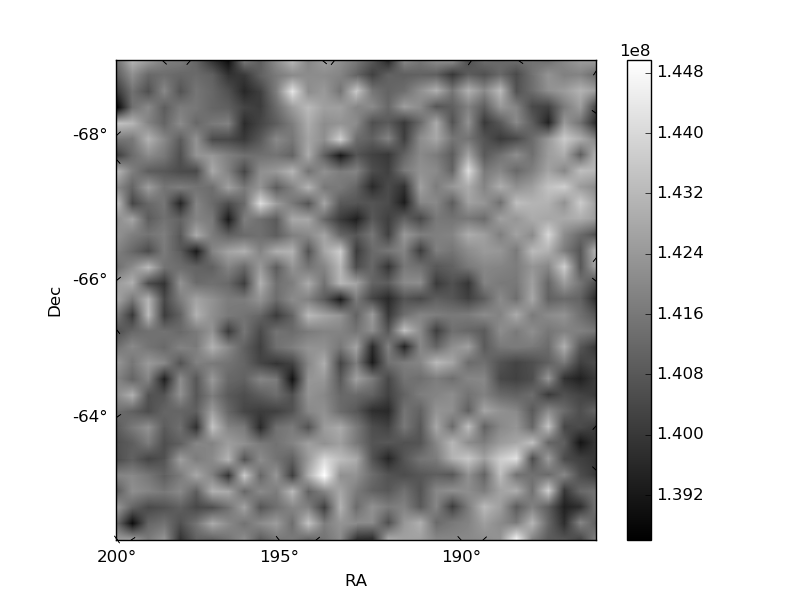
Histogram calculated using DETX and DETY for each event in the final _common_clean file
| Quadrant A | 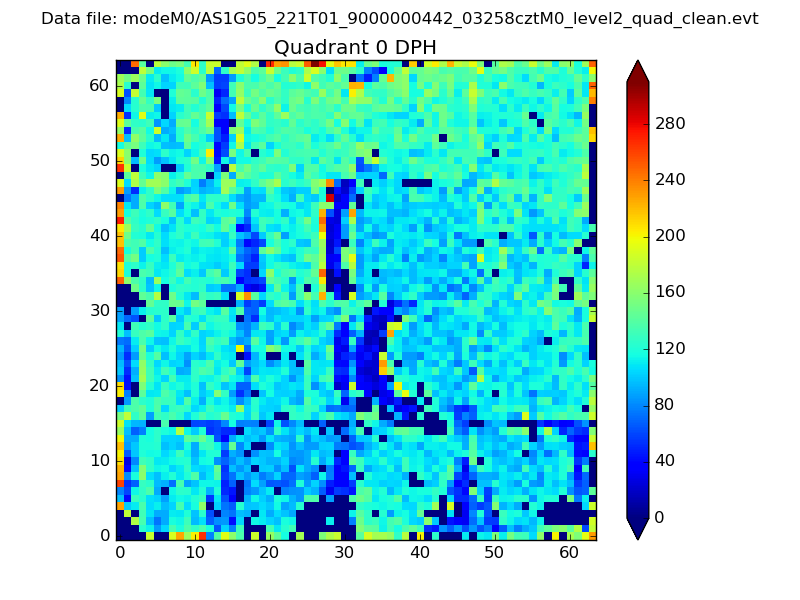 |
 |
Quadrant B |
|---|---|---|---|
| Quadrant D | 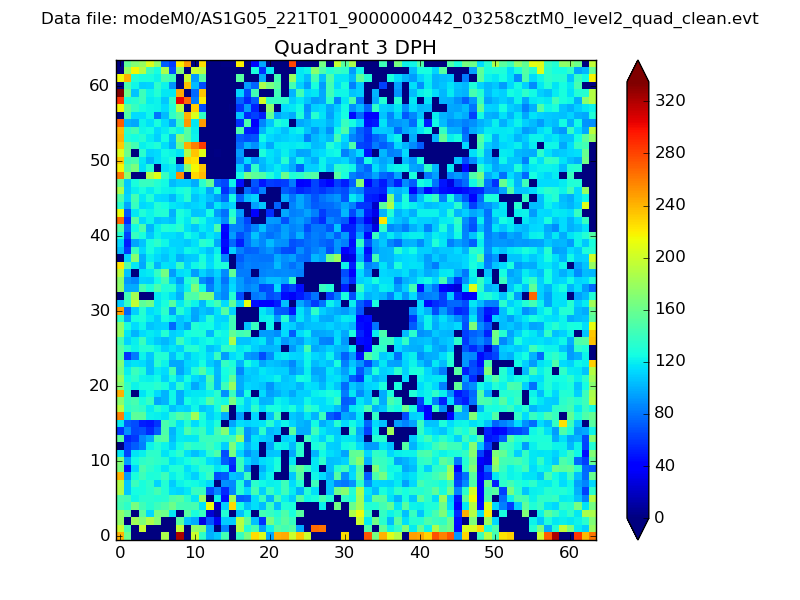 |
 |
Quadrant C |
| Plot type | Count rate plots | Images |
|---|---|---|
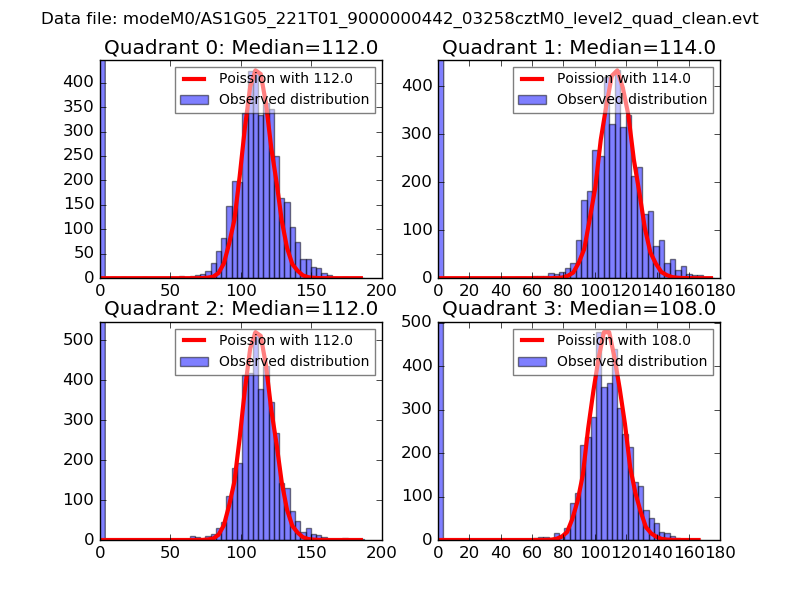
| Comparison with Poisson distribution Blue bars denote a histogram of data divided into 1 sec bins. Red curve is a Poisson curve with rate = median count rate of data. |
 |
 |
| Quadrant-wise count rates Data is divided into 100 sec bins |
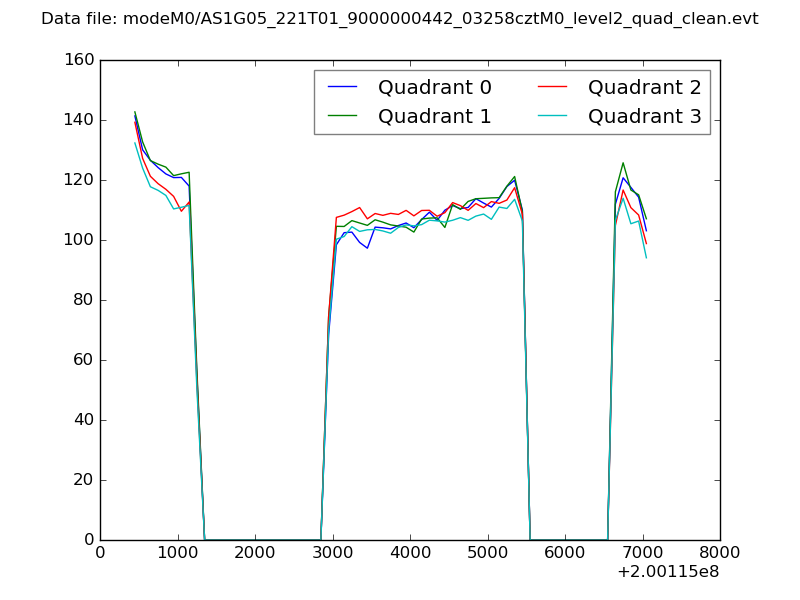 |
|
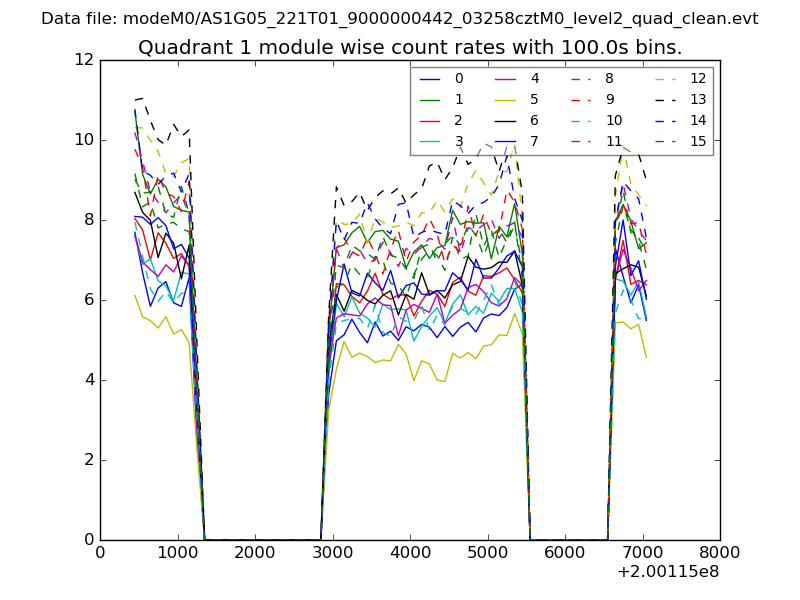
| Module-wise count rates for Quadrant A Data is divided into 100 sec bins |
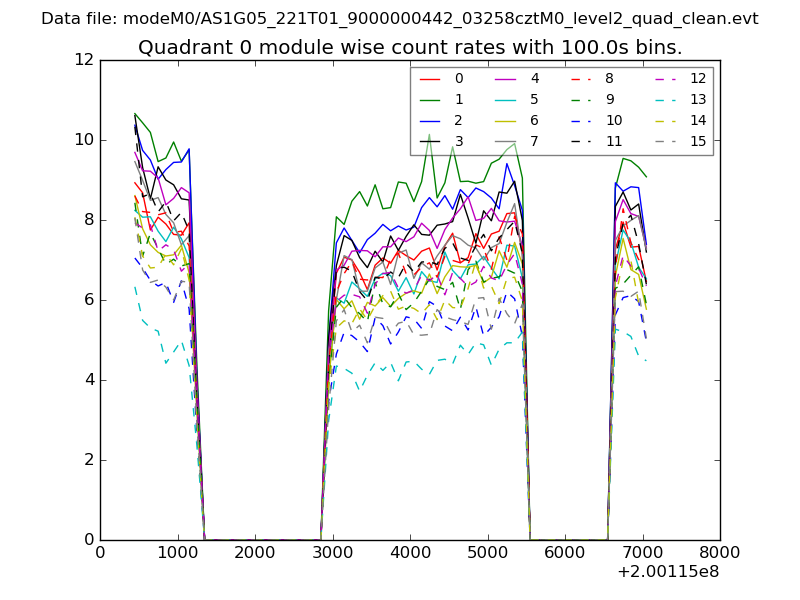 |
 |
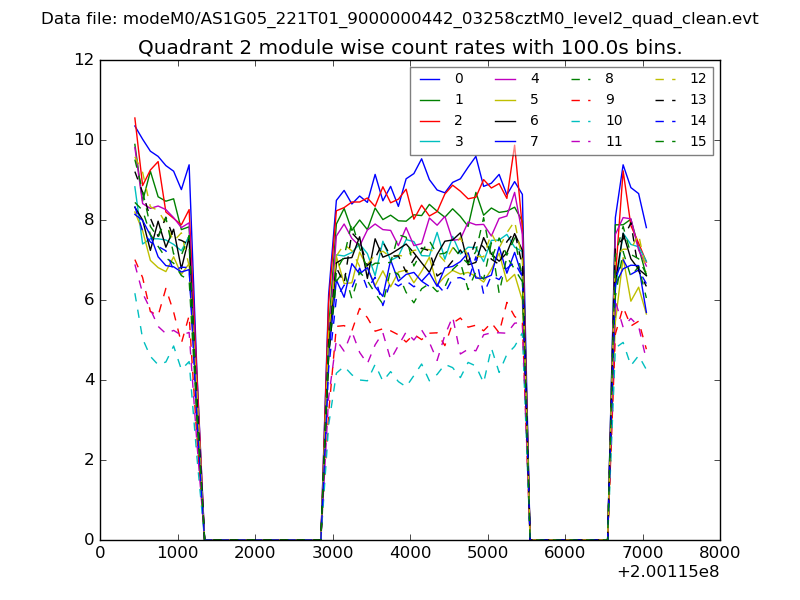
| Module-wise count rates for Quadrant B Data is divided into 100 sec bins |
 |
 |
| Module-wise count rates for Quadrant C Data is divided into 100 sec bins |
 |
 |
| Module-wise count rates for Quadrant D Data is divided into 100 sec bins |
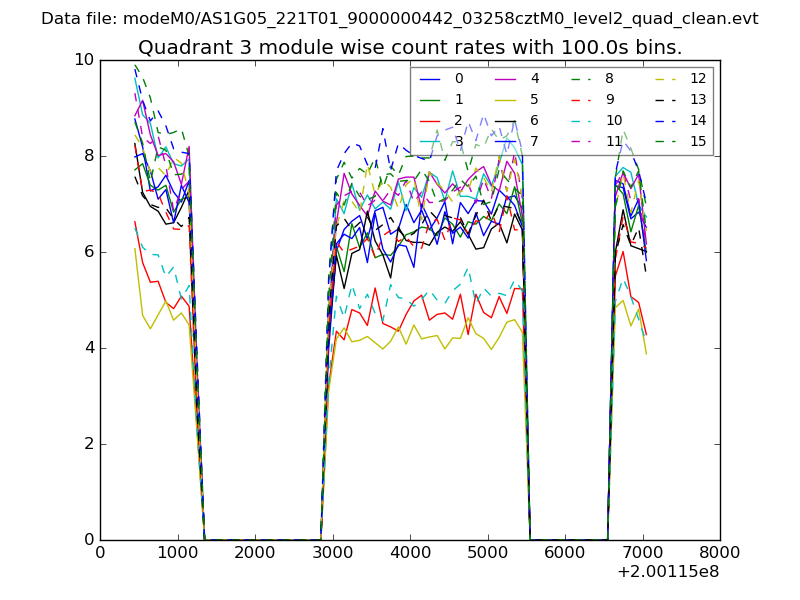 |
 |
| Parameter | Plot |
|---|---|
| CZT HV Monitor | 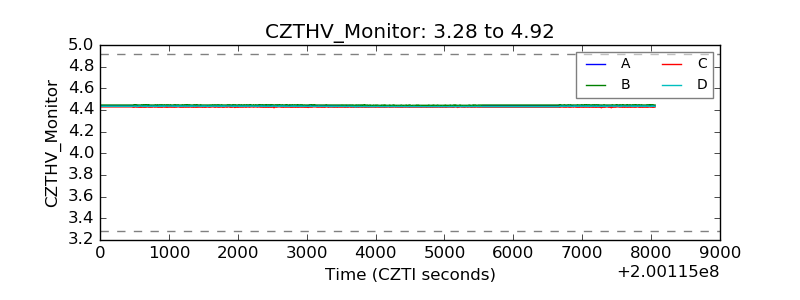 |
| D_VDD | 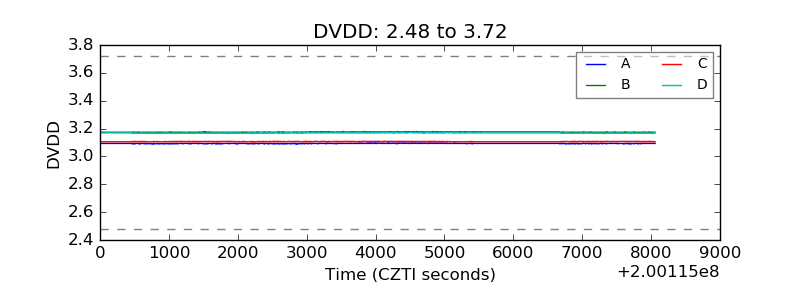 |
| Temperature 1 | 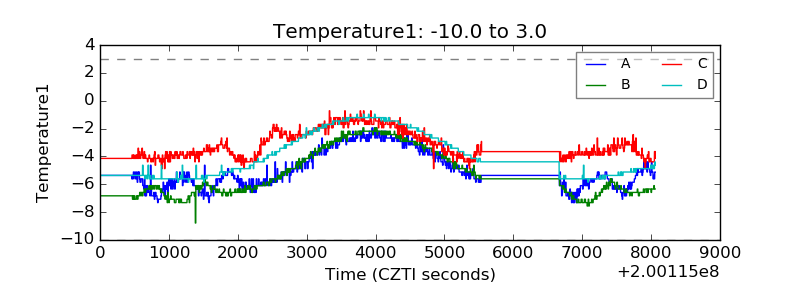 |
| Veto HV Monitor | 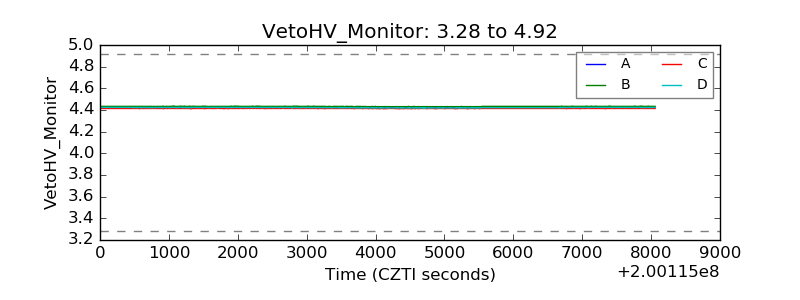 |
| Veto LLD | 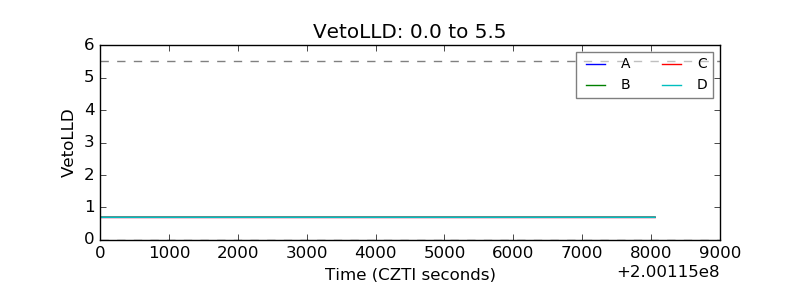 |
| Alpha Counter | 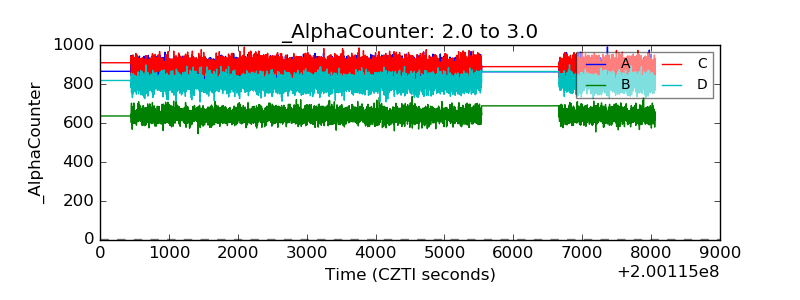 |
| _CPM_Rate | 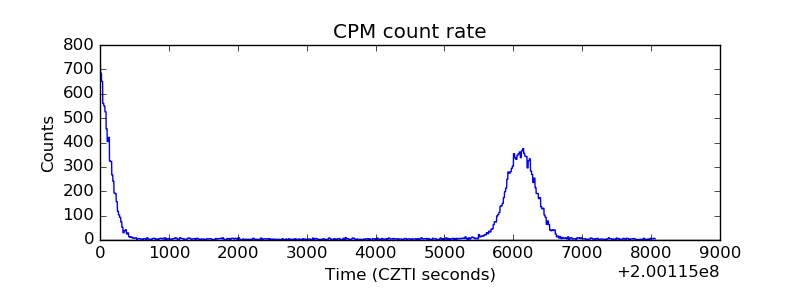 |
| CZT Counter | 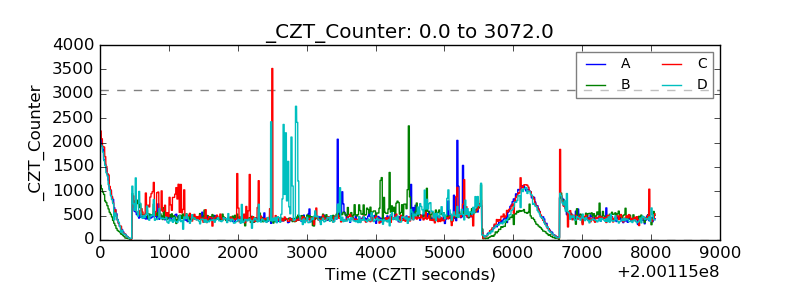 |
| +2.5 Volts monitor |  |
| +5 Volts monitor |  |
| _ROLL_ROT | 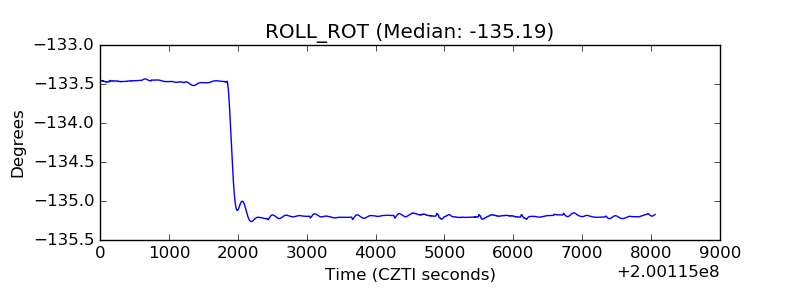 |
| _Roll_DEC | 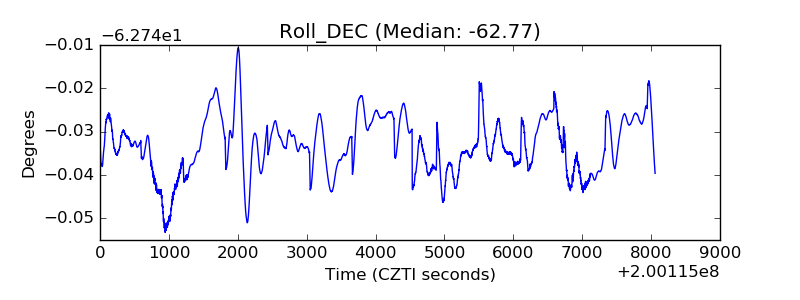 |
| _Roll_RA | 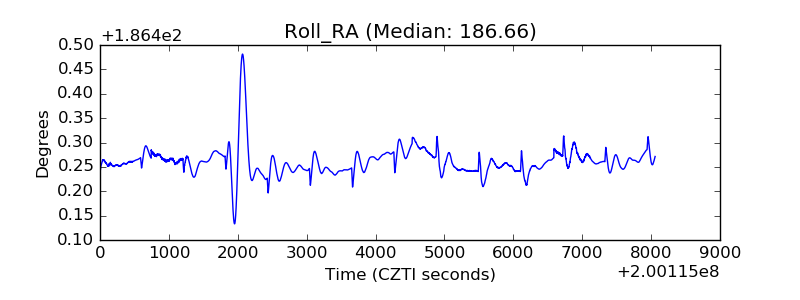 |
| Veto Counter | 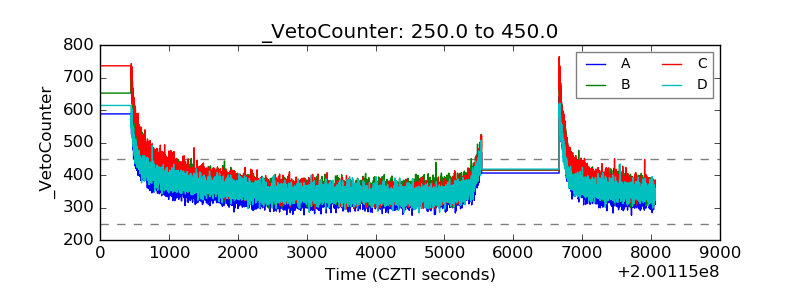 |