| Param | Original file | Final file |
|---|---|---|
| Filename | modeM0/AS1G05_221T01_9000000442_03259cztM0_level2.evt | modeM0/AS1G05_221T01_9000000442_03259cztM0_level2_quad_clean.evt |
| Size (bytes) | 456,972,480 | 70,136,640 |
| Size | 435.8 MB | 66.9 MB |
| Events in quadrant A | 3,103,202 | 417,633 |
| Events in quadrant B | 3,375,483 | 420,117 |
| Events in quadrant C | 3,408,009 | 413,499 |
| Events in quadrant D | 3,493,827 | 401,991 |
| Mode M9 | |||
|---|---|---|---|
| Quadrant | BADHDUFLAG | Total packets | Discarded packets |
| A | 0 | 14 | 0 |
| B | 0 | 14 | 0 |
| C | 0 | 14 | 0 |
| D | 0 | 15 | 0 |
| Mode SS | |||
|---|---|---|---|
| Quadrant | BADHDUFLAG | Total packets | Discarded packets |
| A | 0 | 136 | 0 |
| B | 0 | 136 | 0 |
| C | 0 | 136 | 0 |
| D | 0 | 136 | 0 |
| Mode M0 | |||
|---|---|---|---|
| Quadrant | BADHDUFLAG | Total packets | Discarded packets |
| A | 0 | 13971 | 3 |
| B | 0 | 14256 | 2 |
| C | 0 | 14758 | 2 |
| D | 0 | 15270 | 2 |
| Quadrant | Total seconds | Saturated seconds | Saturation percentage |
|---|---|---|---|
| A | 6749 | 124 | 1.837309% |
| B | 6749 | 127 | 1.881760% |
| C | 6749 | 210 | 3.111572% |
| D | 6749 | 192 | 2.844866% |
Noise dominated data is calculated using 1-second bins in cleaned event files. If a bin has >2000 counts, and if more than 50% of those come from <1% of pixels, then it is considered to be noise-dominated and hence unusable.
| Quadrant | # 1 sec bins | Bins with >0 counts | Bins with >2000 counts | High rate bins dominated by noise | Noise dominated (total time) | Noise dominated (detector-on time) | Marked lightcurve |
|---|---|---|---|---|---|---|---|
| A | 7614 | 6750 | 9 | 9 | 0.12% | 0.13% | 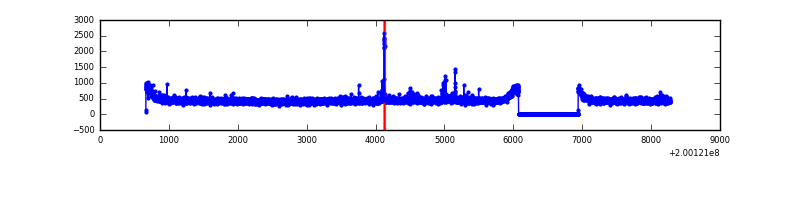 |
| B | 7614 | 6750 | 0 | 0 | 0.00% | 0.00% | 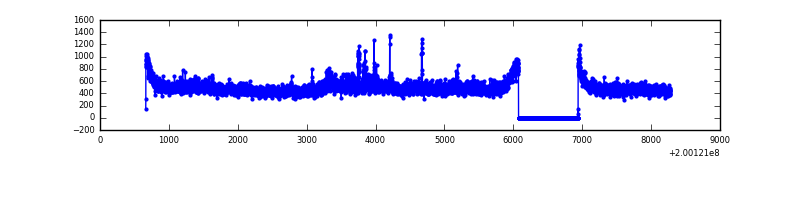 |
| C | 7614 | 6750 | 84 | 84 | 1.10% | 1.24% | 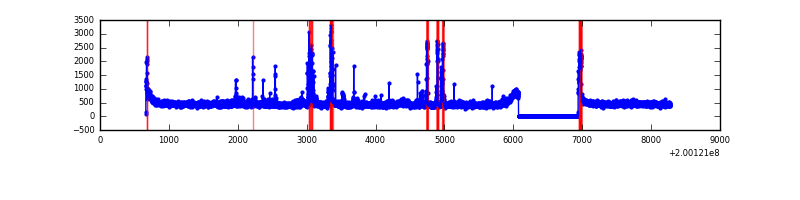 |
| D | 7614 | 6750 | 69 | 69 | 0.91% | 1.02% | 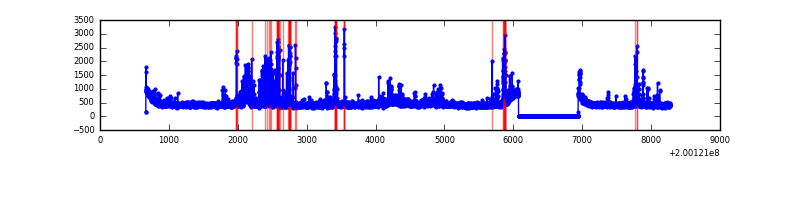 |
Top three noisy pixels from each quadrant. If the there are fewer than three noisy pixels in the level2.evt file, extra rows are filled as -1
| Pixel properties | Quadrant properties | ||||||
|---|---|---|---|---|---|---|---|
| Quadrant | DetID | PixID | Counts | Sigma | Mean | Median | Sigma |
| A | 0 | 118 | 44197 | 273.03 | 780 | 763 | 159.1 |
| A | 3 | 1 | 20303 | 122.83 | 780 | 763 | 159.1 |
| A | 0 | 226 | 12371 | 72.97 | 780 | 763 | 159.1 |
| B | 15 | 204 | 246058 | 1608.95 | 796 | 777 | 152.4 |
| B | 3 | 0 | 28012 | 178.65 | 796 | 777 | 152.4 |
| B | 0 | 229 | 19468 | 122.61 | 796 | 777 | 152.4 |
| C | 1 | 192 | 210314 | 1180.61 | 762 | 764 | 177.5 |
| C | 12 | 175 | 176576 | 990.53 | 762 | 764 | 177.5 |
| C | 6 | 80 | 17267 | 92.98 | 762 | 764 | 177.5 |
| D | 13 | 223 | 313048 | 1713.64 | 756 | 733 | 182.3 |
| D | 13 | 114 | 92865 | 505.52 | 756 | 733 | 182.3 |
| D | 12 | 233 | 79161 | 430.33 | 756 | 733 | 182.3 |
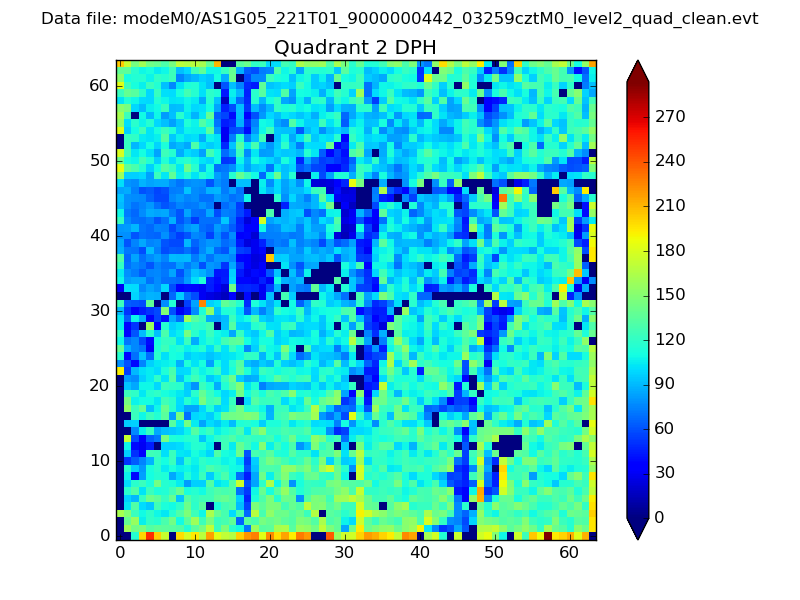
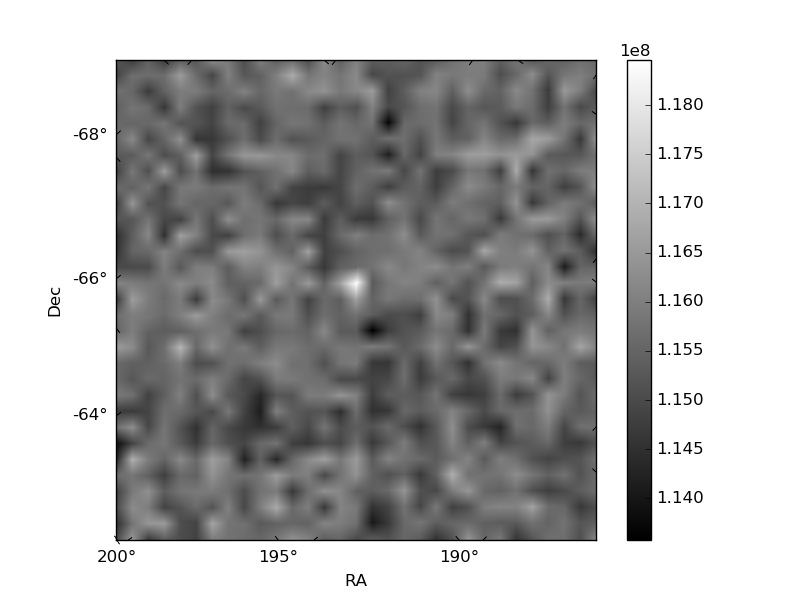
Histogram calculated using DETX and DETY for each event in the final _common_clean file
| Quadrant A |  |
 |
Quadrant B |
|---|---|---|---|
| Quadrant D | 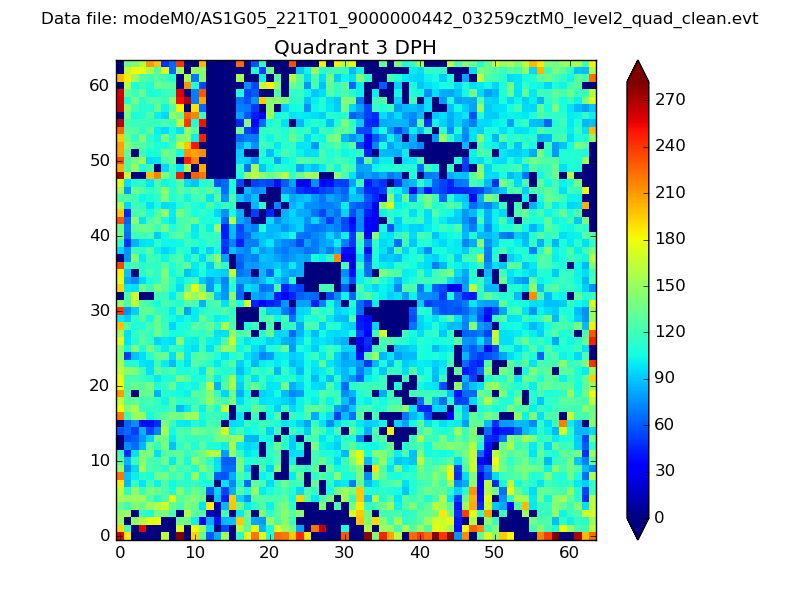 |
 |
Quadrant C |
| Plot type | Count rate plots | Images |
|---|---|---|
| Comparison with Poisson distribution Blue bars denote a histogram of data divided into 1 sec bins. Red curve is a Poisson curve with rate = median count rate of data. |
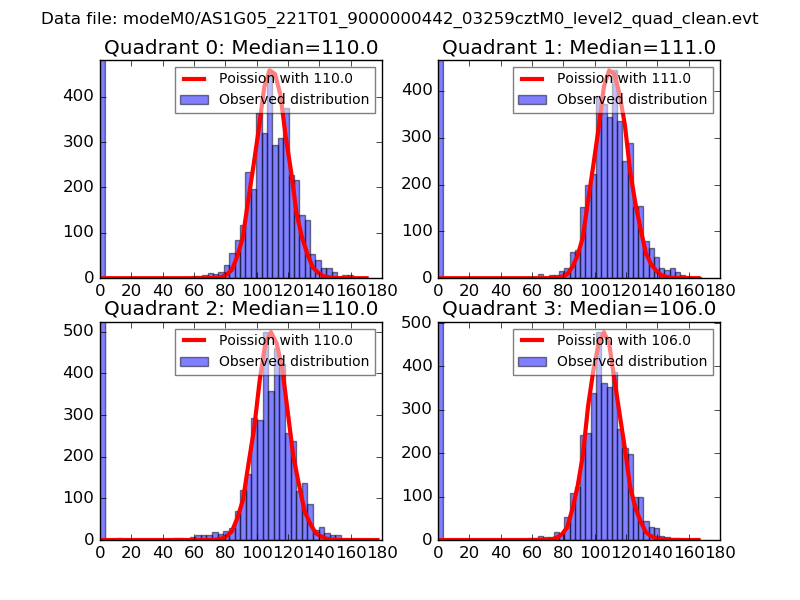 |
 |
| Quadrant-wise count rates Data is divided into 100 sec bins |
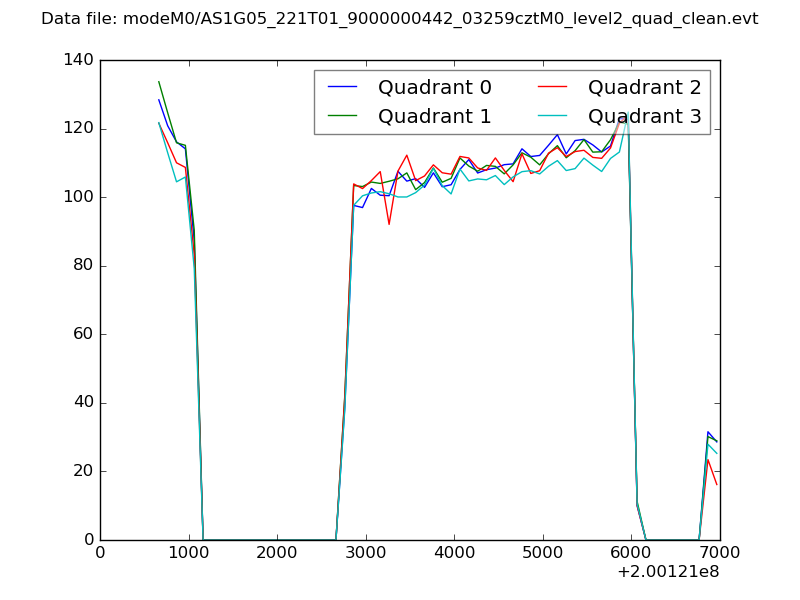 |
|
| Module-wise count rates for Quadrant A Data is divided into 100 sec bins |
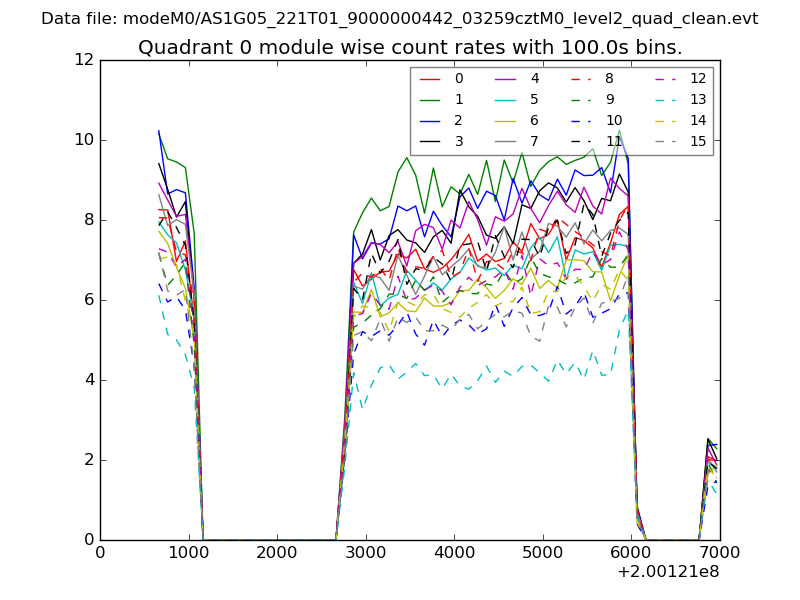 |
 |
| Module-wise count rates for Quadrant B Data is divided into 100 sec bins |
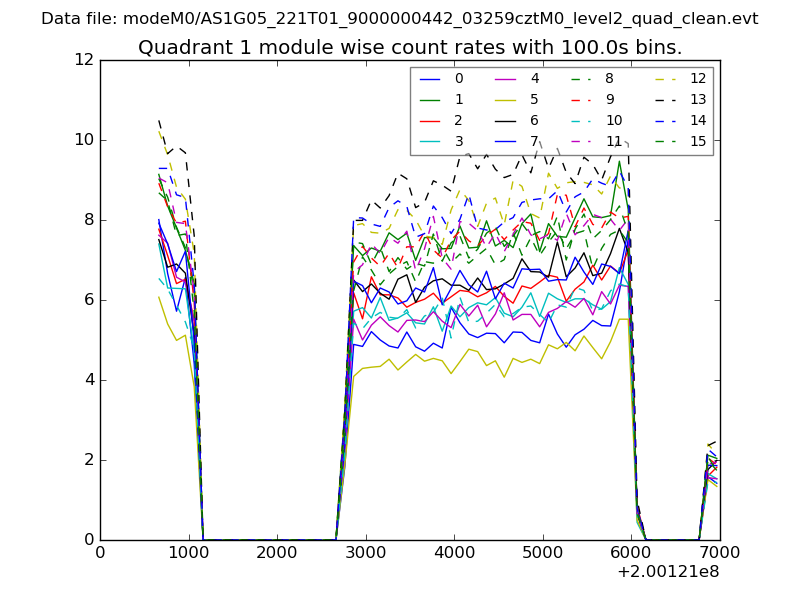 |
 |
| Module-wise count rates for Quadrant C Data is divided into 100 sec bins |
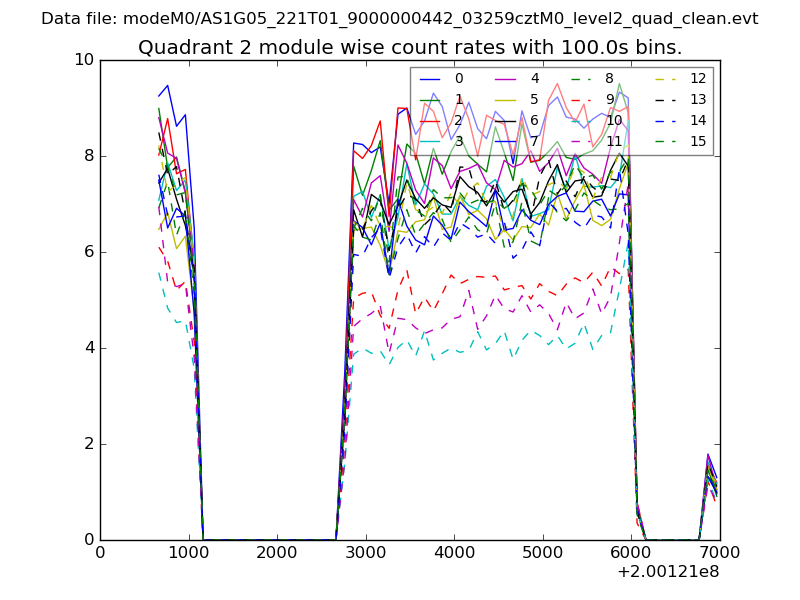 |
 |
| Module-wise count rates for Quadrant D Data is divided into 100 sec bins |
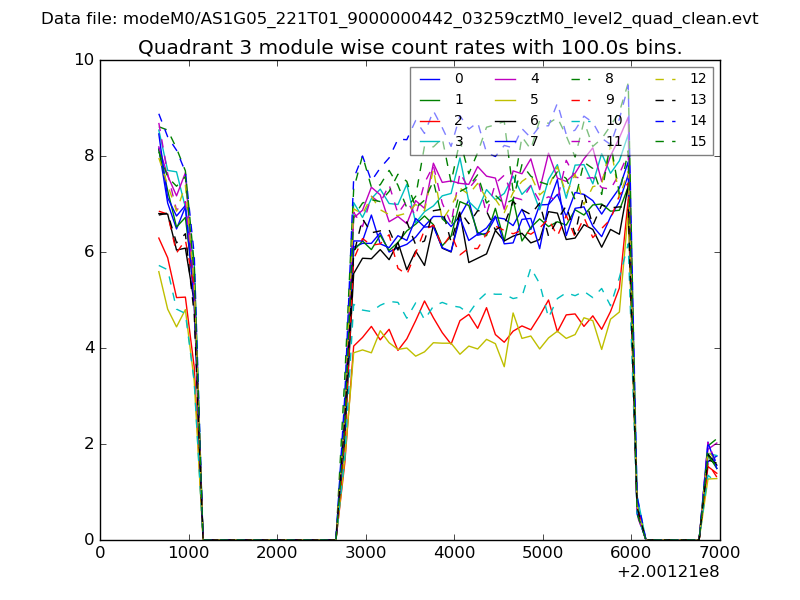 |
 |
| Parameter | Plot |
|---|---|
| CZT HV Monitor | 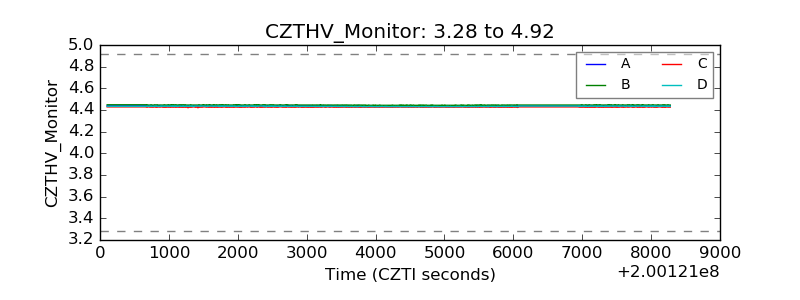 |
| D_VDD | 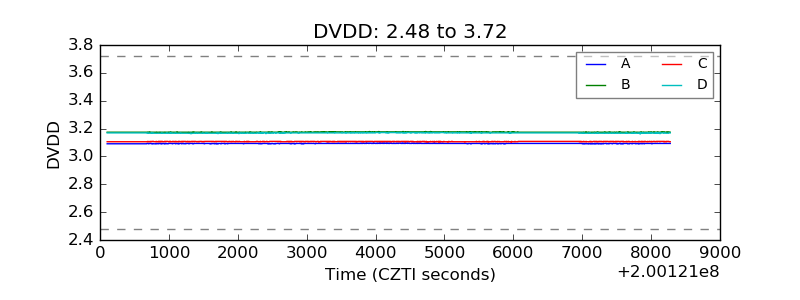 |
| Temperature 1 | 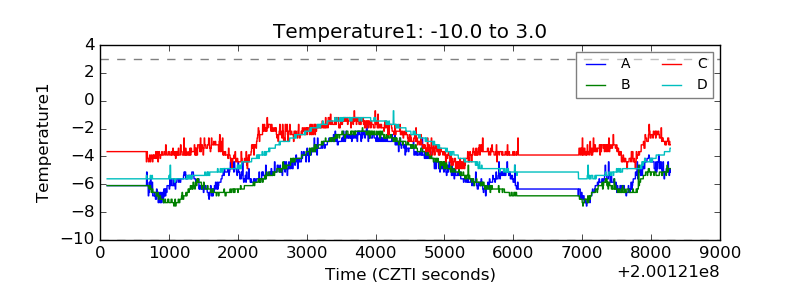 |
| Veto HV Monitor | 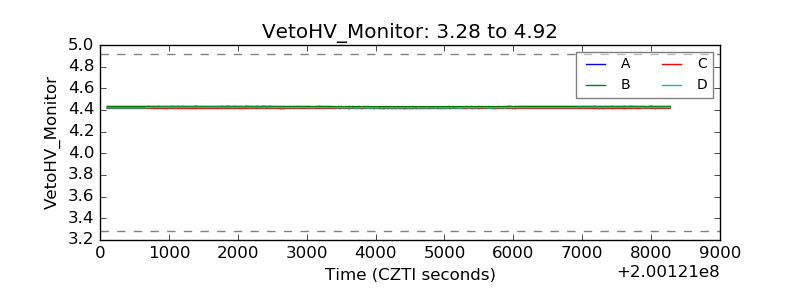 |
| Veto LLD | 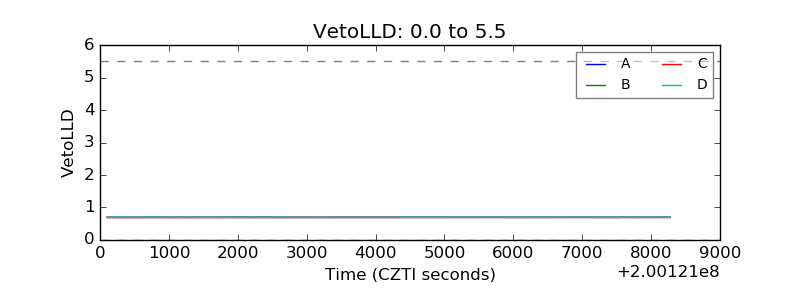 |
| Alpha Counter | 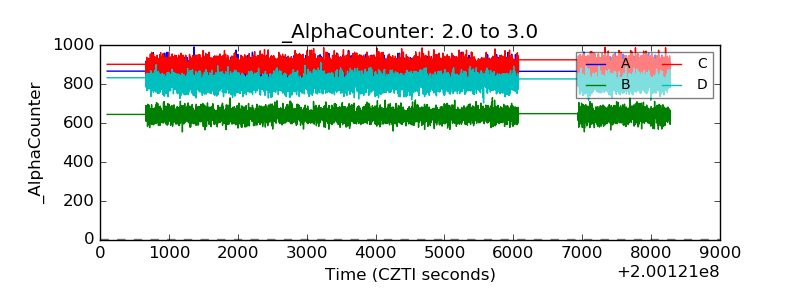 |
| _CPM_Rate | 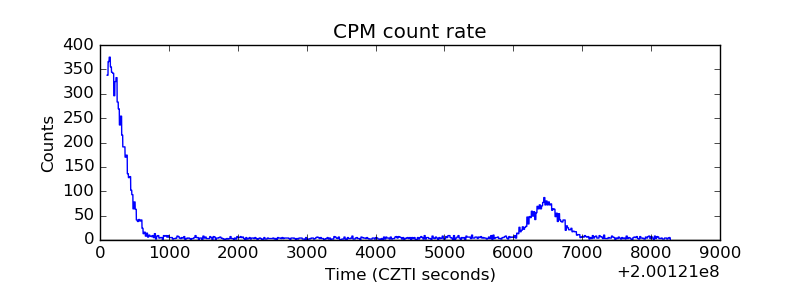 |
| CZT Counter | 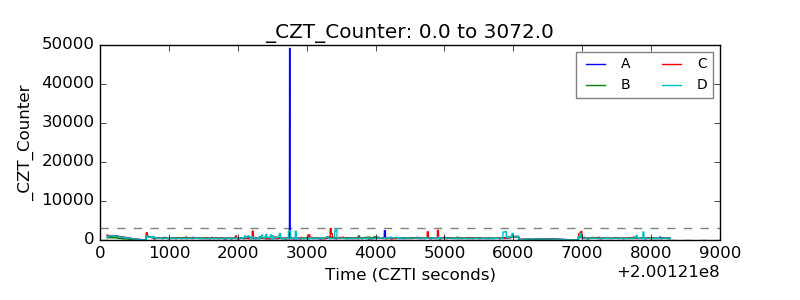 |
| +2.5 Volts monitor | 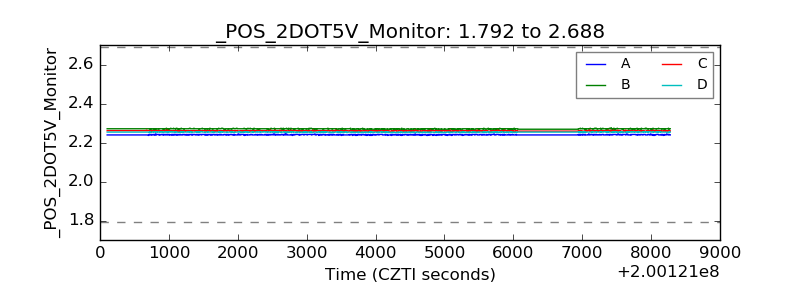 |
| +5 Volts monitor |  |
| _ROLL_ROT | 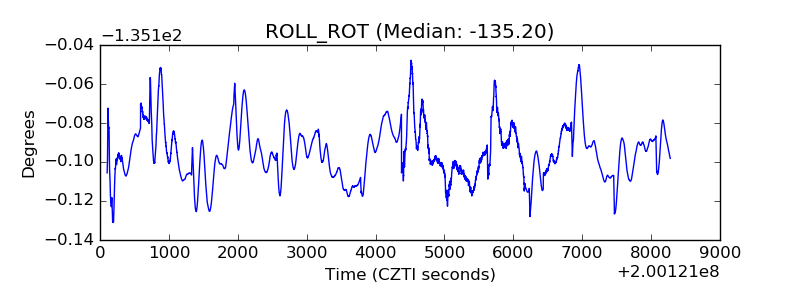 |
| _Roll_DEC | 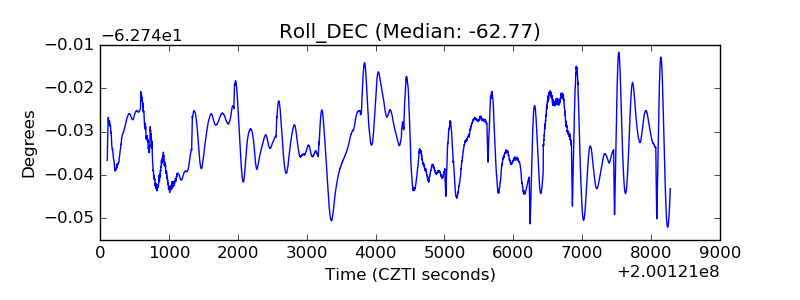 |
| _Roll_RA | 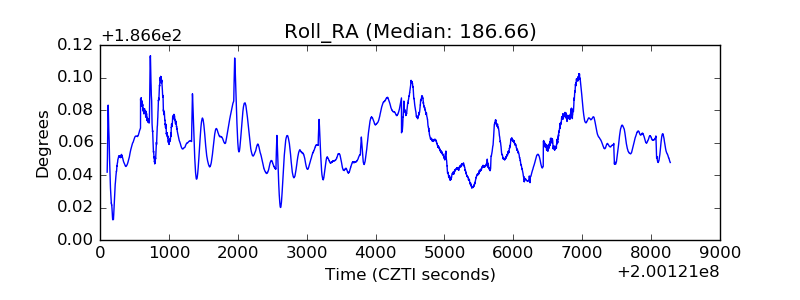 |
| Veto Counter | 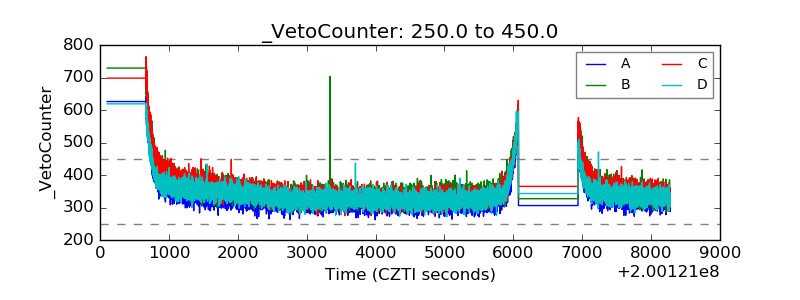 |