| Param | Original file | Final file |
|---|---|---|
| Filename | modeM0/AS1G05_221T01_9000000442_03260cztM0_level2.evt | modeM0/AS1G05_221T01_9000000442_03260cztM0_level2_quad_clean.evt |
| Size (bytes) | 573,649,920 | 76,700,160 |
| Size | 547.1 MB | 73.1 MB |
| Events in quadrant A | 3,497,797 | 456,846 |
| Events in quadrant B | 4,038,996 | 456,183 |
| Events in quadrant C | 4,939,744 | 447,511 |
| Events in quadrant D | 4,388,669 | 440,821 |
| Mode M9 | |||
|---|---|---|---|
| Quadrant | BADHDUFLAG | Total packets | Discarded packets |
| A | 0 | 13 | 0 |
| B | 0 | 13 | 0 |
| C | 0 | 13 | 0 |
| D | 0 | 13 | 0 |
| Mode SS | |||
|---|---|---|---|
| Quadrant | BADHDUFLAG | Total packets | Discarded packets |
| A | 0 | 154 | 0 |
| B | 0 | 154 | 0 |
| C | 0 | 154 | 0 |
| D | 0 | 154 | 0 |
| Mode M0 | |||
|---|---|---|---|
| Quadrant | BADHDUFLAG | Total packets | Discarded packets |
| A | 0 | 15731 | 3 |
| B | 0 | 16636 | 2 |
| C | 0 | 19946 | 2 |
| D | 0 | 18542 | 2 |
| Quadrant | Total seconds | Saturated seconds | Saturation percentage |
|---|---|---|---|
| A | 7487 | 265 | 3.539468% |
| B | 7487 | 286 | 3.819955% |
| C | 7487 | 714 | 9.536530% |
| D | 7487 | 451 | 6.023775% |
Noise dominated data is calculated using 1-second bins in cleaned event files. If a bin has >2000 counts, and if more than 50% of those come from <1% of pixels, then it is considered to be noise-dominated and hence unusable.
| Quadrant | # 1 sec bins | Bins with >0 counts | Bins with >2000 counts | High rate bins dominated by noise | Noise dominated (total time) | Noise dominated (detector-on time) | Marked lightcurve |
|---|---|---|---|---|---|---|---|
| A | 8707 | 7491 | 9 | 9 | 0.10% | 0.12% | 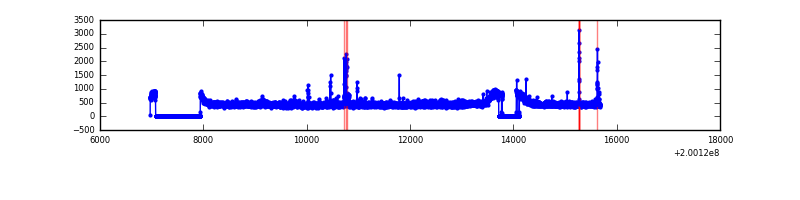 |
| B | 8707 | 7491 | 3 | 3 | 0.03% | 0.04% | 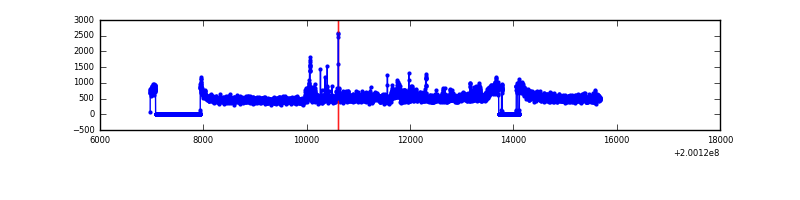 |
| C | 8707 | 7491 | 439 | 439 | 5.04% | 5.86% | 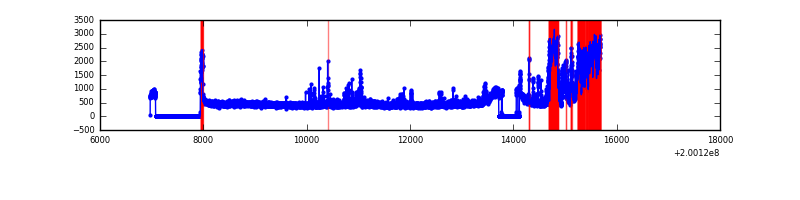 |
| D | 8707 | 7491 | 180 | 180 | 2.07% | 2.40% | 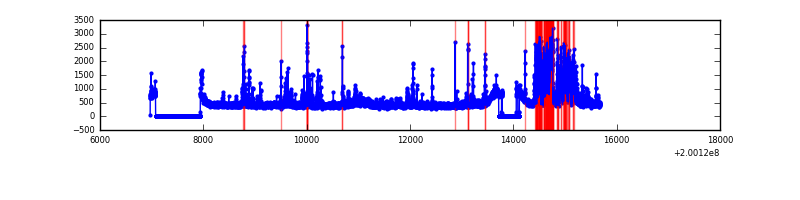 |
Top three noisy pixels from each quadrant. If the there are fewer than three noisy pixels in the level2.evt file, extra rows are filled as -1
| Pixel properties | Quadrant properties | ||||||
|---|---|---|---|---|---|---|---|
| Quadrant | DetID | PixID | Counts | Sigma | Mean | Median | Sigma |
| A | 0 | 50 | 48725 | 263.6 | 873 | 850 | 181.6 |
| A | 3 | 1 | 35239 | 189.34 | 873 | 850 | 181.6 |
| A | 0 | 118 | 31175 | 166.97 | 873 | 850 | 181.6 |
| B | 15 | 204 | 564970 | 3271.47 | 888 | 864 | 172.4 |
| B | 2 | 249 | 15521 | 85.0 | 888 | 864 | 172.4 |
| B | 0 | 229 | 14756 | 80.57 | 888 | 864 | 172.4 |
| C | 1 | 192 | 1504145 | 7662.23 | 840 | 841 | 196.2 |
| C | 12 | 175 | 98589 | 498.21 | 840 | 841 | 196.2 |
| C | 1 | 16 | 21171 | 103.62 | 840 | 841 | 196.2 |
| D | 12 | 233 | 872303 | 4216.67 | 845 | 817 | 206.7 |
| D | 13 | 114 | 86749 | 415.78 | 845 | 817 | 206.7 |
| D | 4 | 160 | 83656 | 400.82 | 845 | 817 | 206.7 |
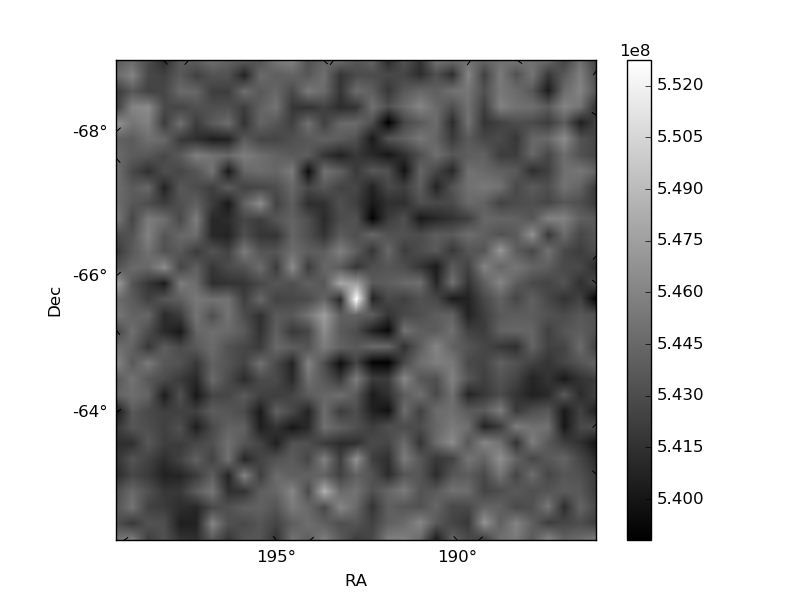
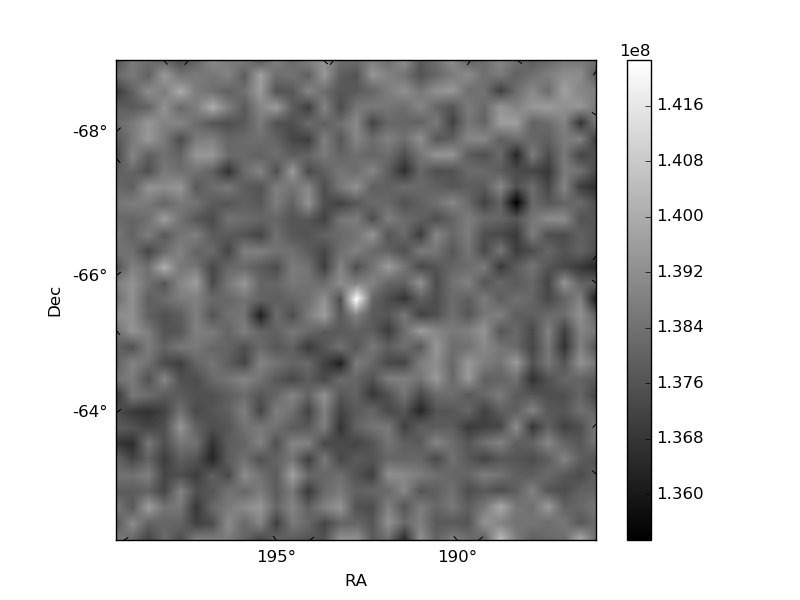
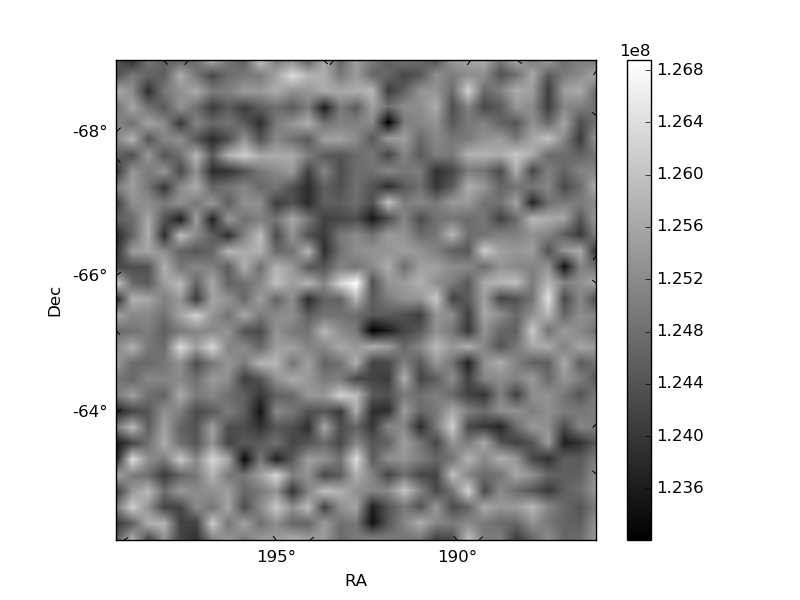
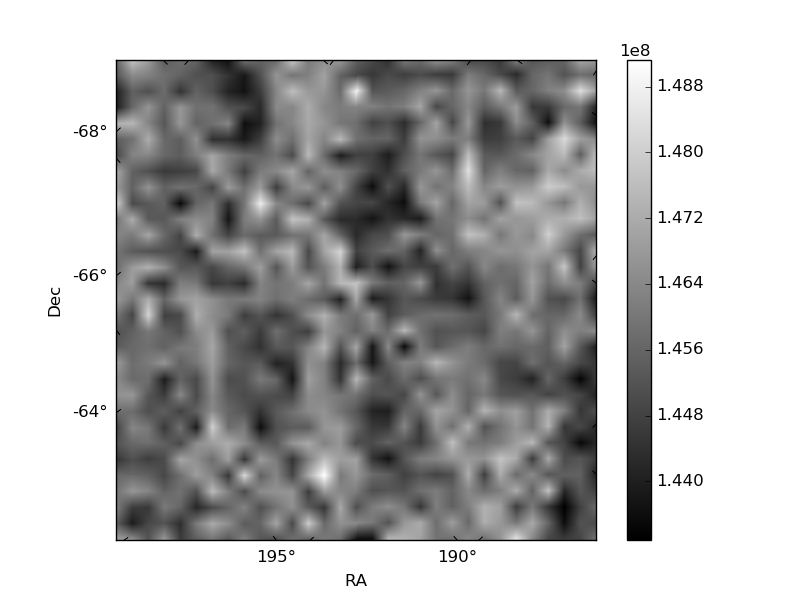
Histogram calculated using DETX and DETY for each event in the final _common_clean file
| Quadrant A | 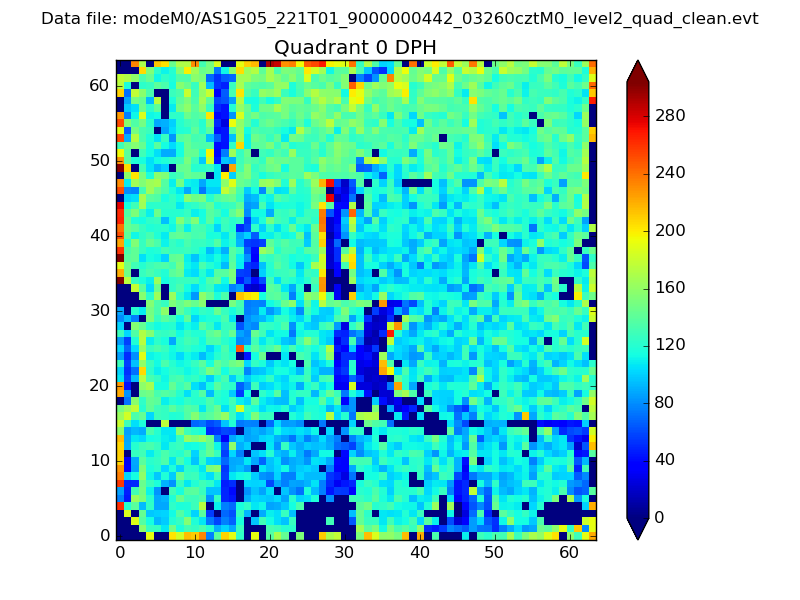 |
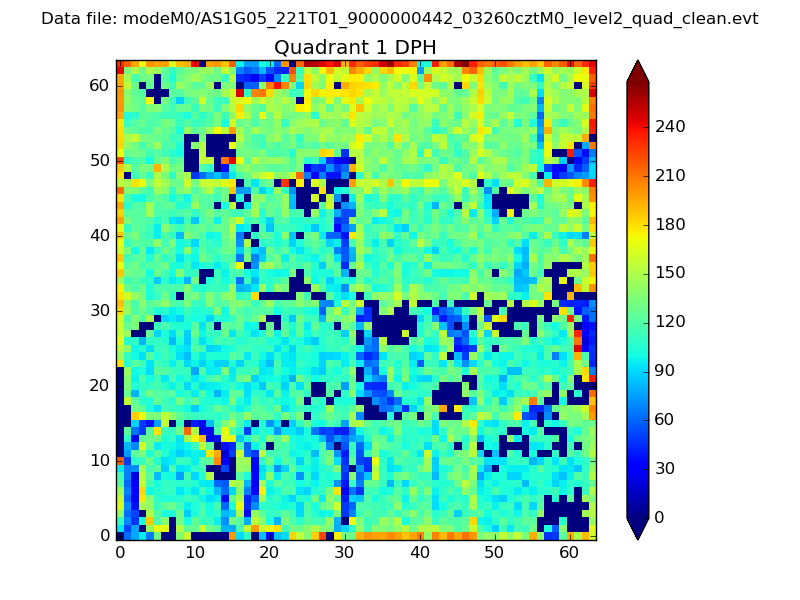 |
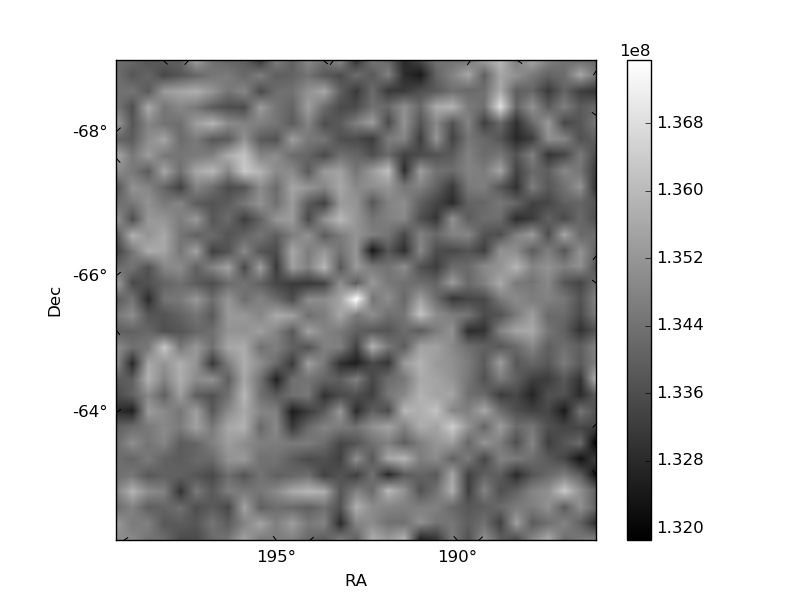
Quadrant B |
|---|---|---|---|
| Quadrant D | 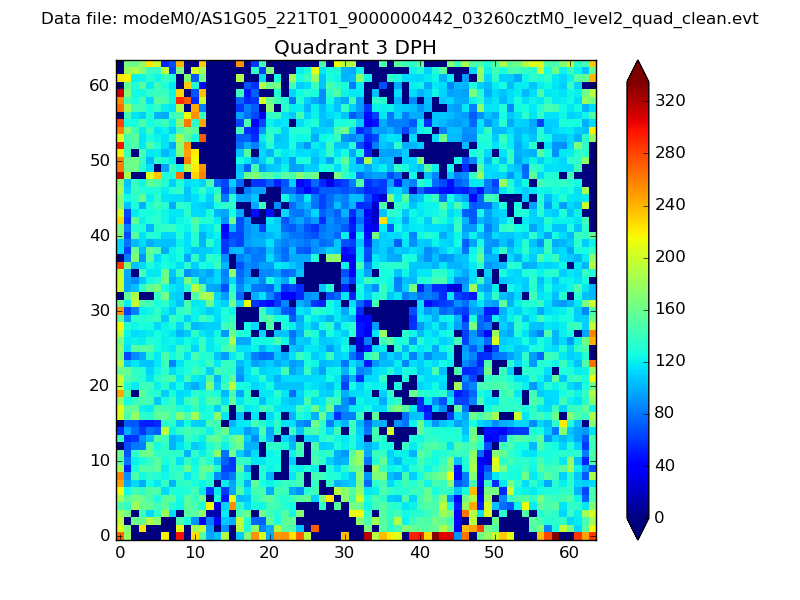 |
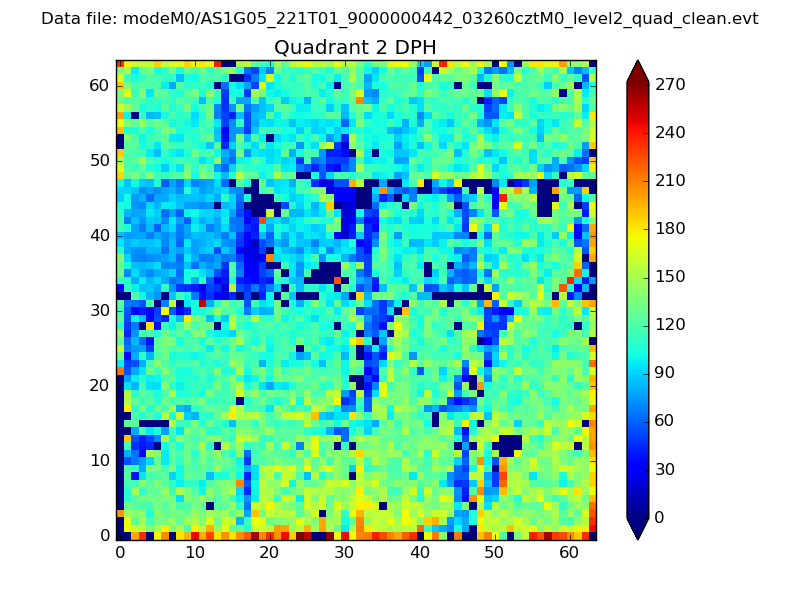 |
Quadrant C |
| Plot type | Count rate plots | Images |
|---|---|---|
| Comparison with Poisson distribution Blue bars denote a histogram of data divided into 1 sec bins. Red curve is a Poisson curve with rate = median count rate of data. |
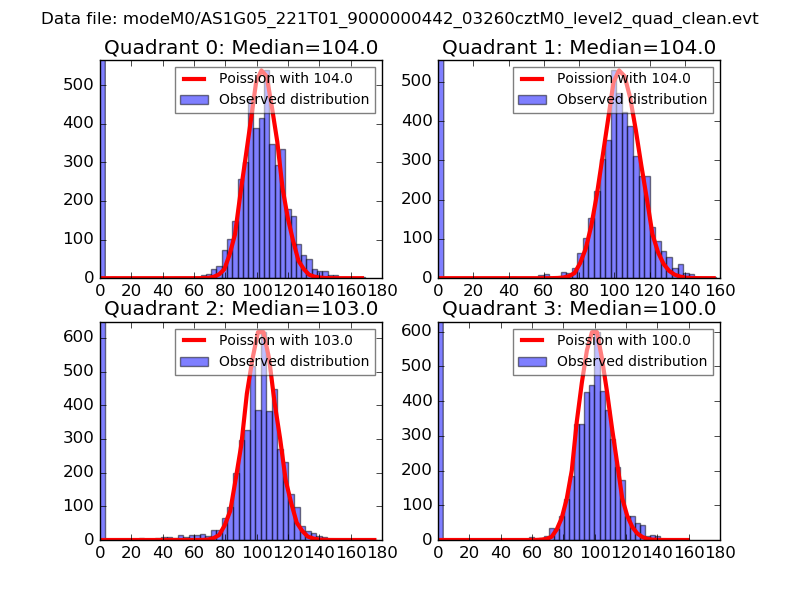 |
 |
| Quadrant-wise count rates Data is divided into 100 sec bins |
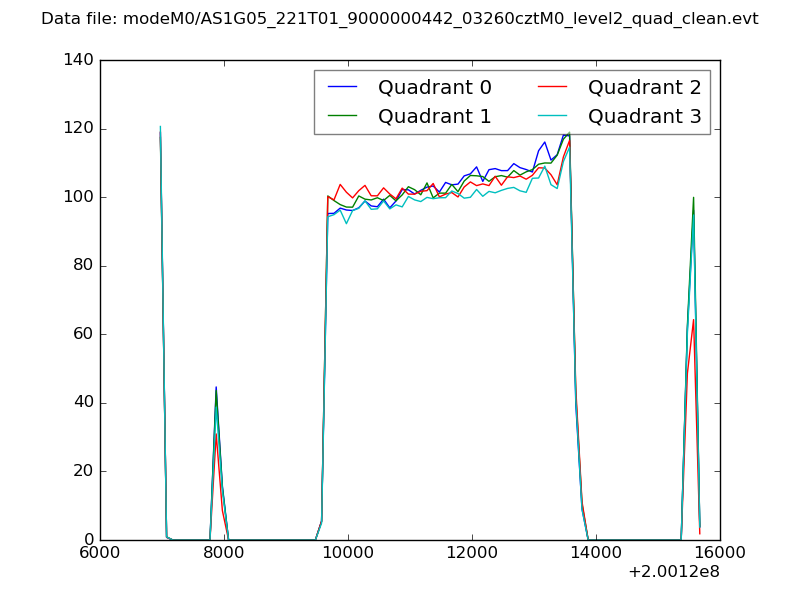 |
|
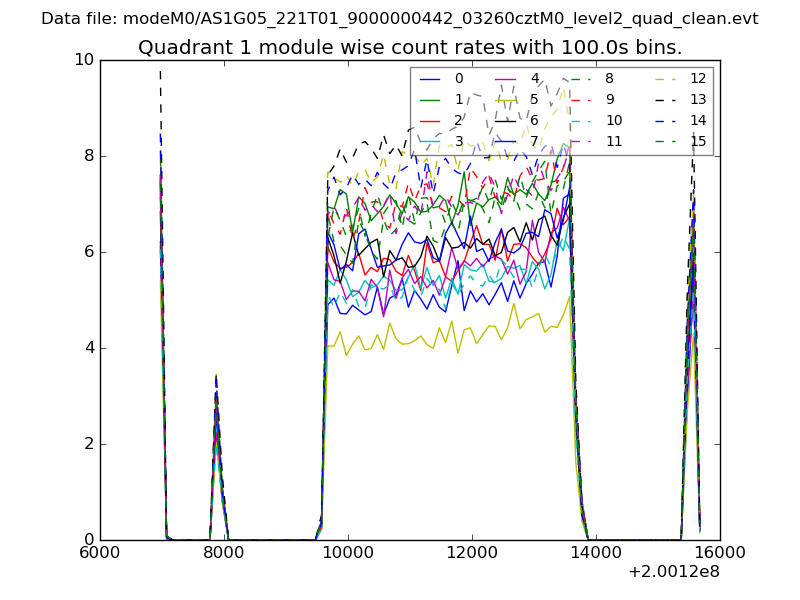
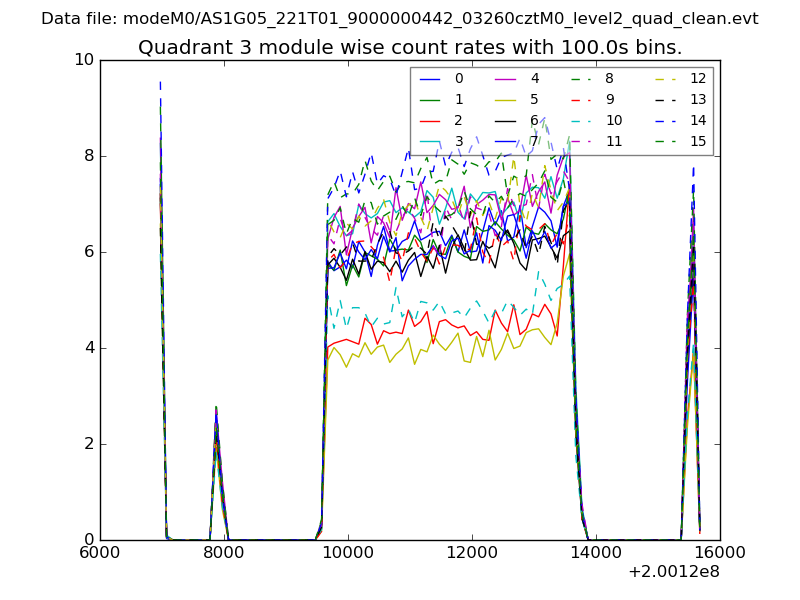
| Module-wise count rates for Quadrant A Data is divided into 100 sec bins |
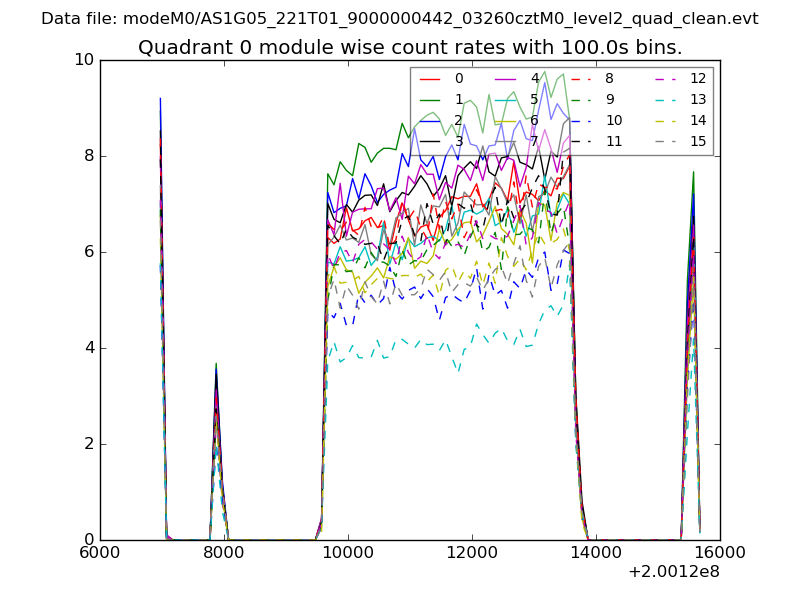 |
 |
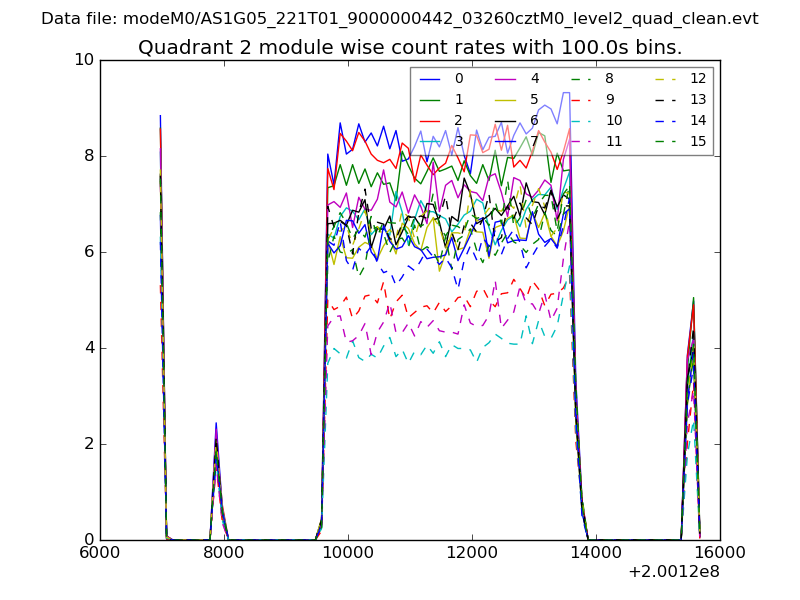
| Module-wise count rates for Quadrant B Data is divided into 100 sec bins |
 |
 |
| Module-wise count rates for Quadrant C Data is divided into 100 sec bins |
 |
 |
| Module-wise count rates for Quadrant D Data is divided into 100 sec bins |
 |
 |
| Parameter | Plot |
|---|---|
| CZT HV Monitor | 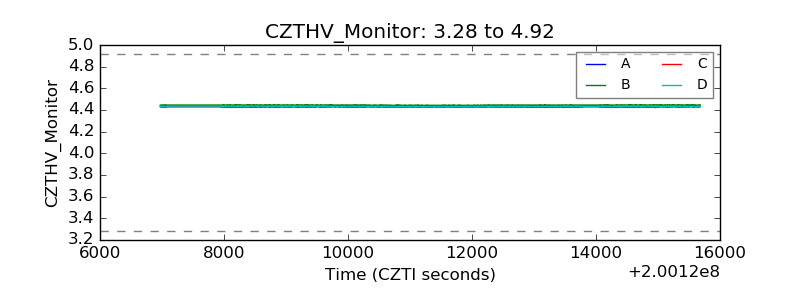 |
| D_VDD | 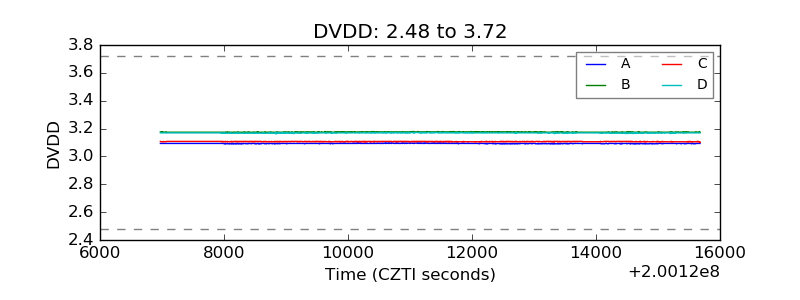 |
| Temperature 1 | 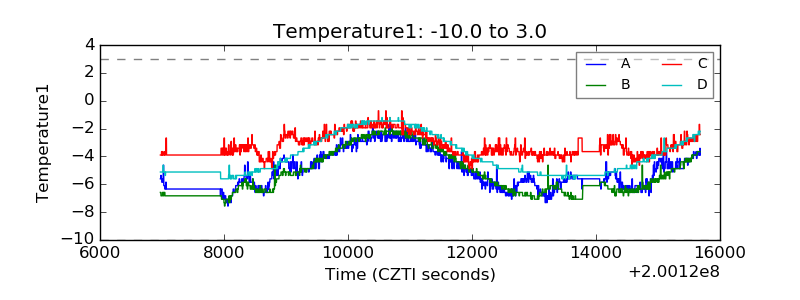 |
| Veto HV Monitor | 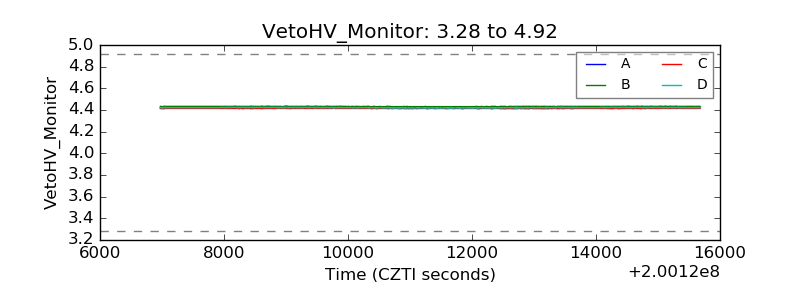 |
| Veto LLD | 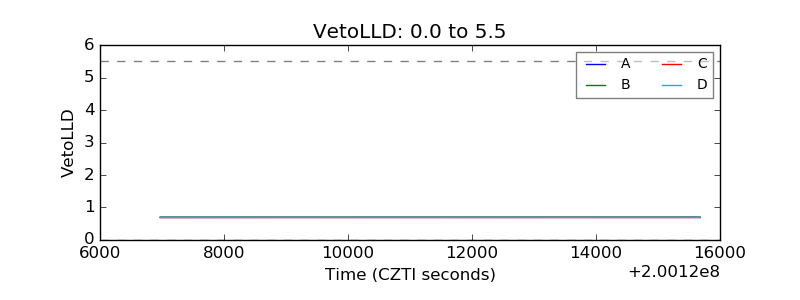 |
| Alpha Counter | 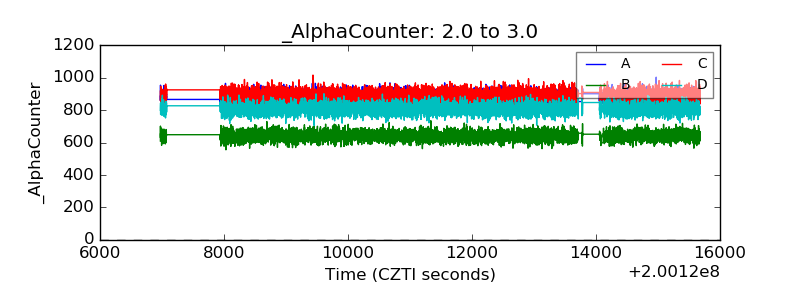 |
| _CPM_Rate | 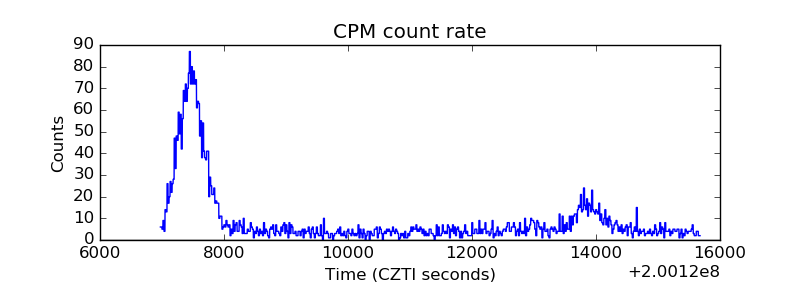 |
| CZT Counter | 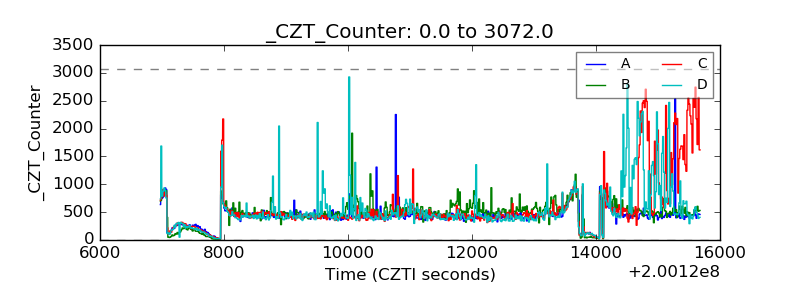 |
| +2.5 Volts monitor | 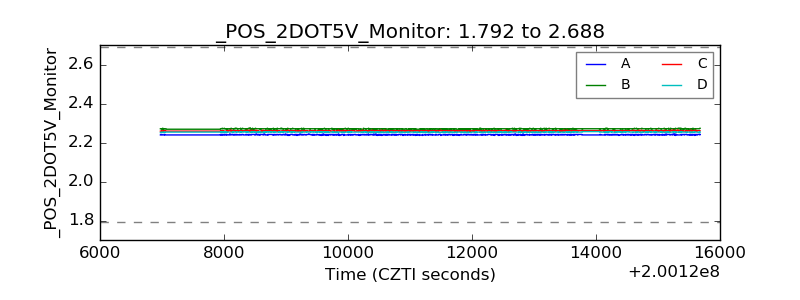 |
| +5 Volts monitor | 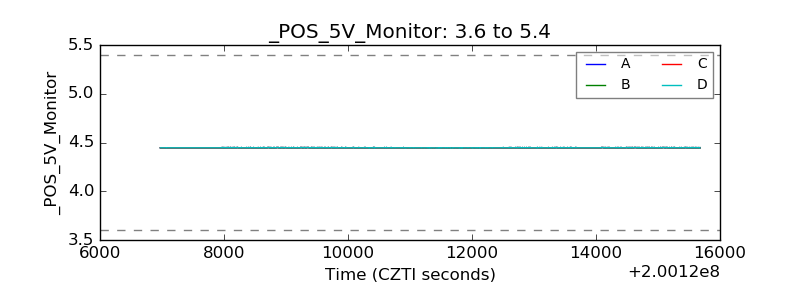 |
| _ROLL_ROT | 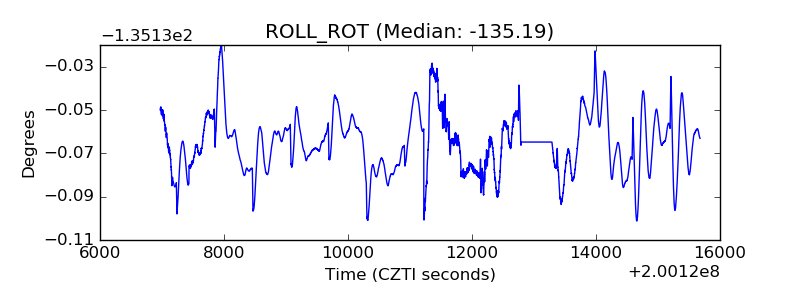 |
| _Roll_DEC | 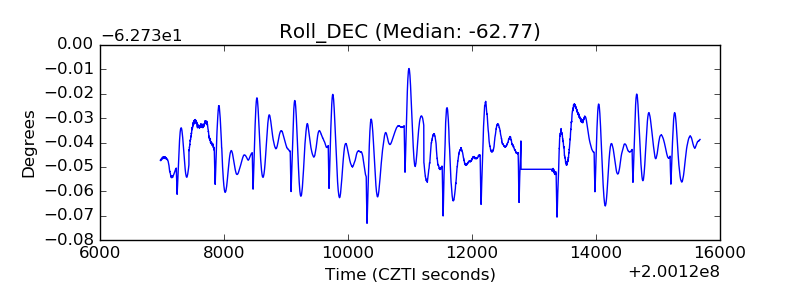 |
| _Roll_RA | 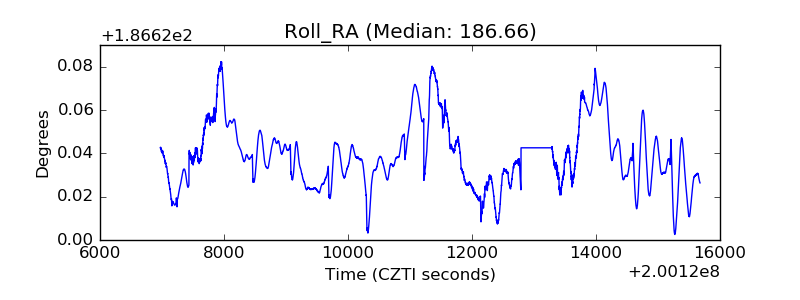 |
| Veto Counter | 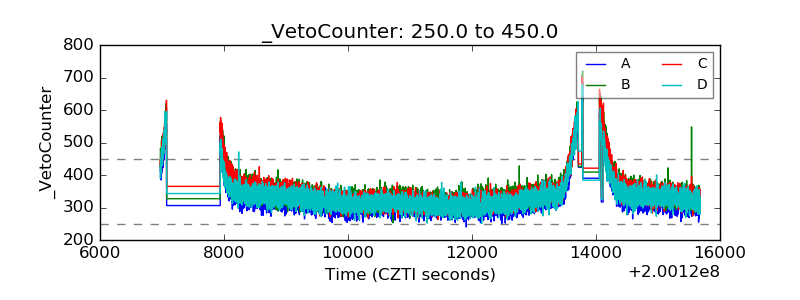 |