| Param | Original file | Final file |
|---|---|---|
| Filename | modeM0/AS1G05_221T01_9000000442_03261cztM0_level2.evt | modeM0/AS1G05_221T01_9000000442_03261cztM0_level2_quad_clean.evt |
| Size (bytes) | 780,793,920 | 87,710,400 |
| Size | 744.6 MB | 83.6 MB |
| Events in quadrant A | 4,034,888 | 539,804 |
| Events in quadrant B | 4,899,198 | 540,846 |
| Events in quadrant C | 9,112,523 | 476,947 |
| Events in quadrant D | 5,036,711 | 519,686 |
| Mode M9 | |||
|---|---|---|---|
| Quadrant | BADHDUFLAG | Total packets | Discarded packets |
| A | 0 | 4 | 0 |
| B | 0 | 4 | 0 |
| C | 0 | 4 | 0 |
| D | 0 | 4 | 0 |
| Mode SS | |||
|---|---|---|---|
| Quadrant | BADHDUFLAG | Total packets | Discarded packets |
| A | 0 | 170 | 0 |
| B | 0 | 170 | 0 |
| C | 0 | 170 | 0 |
| D | 0 | 170 | 0 |
| Mode M0 | |||
|---|---|---|---|
| Quadrant | BADHDUFLAG | Total packets | Discarded packets |
| A | 0 | 17940 | 2 |
| B | 0 | 19843 | 1 |
| C | 0 | 32815 | 1 |
| D | 0 | 20931 | 1 |
| Quadrant | Total seconds | Saturated seconds | Saturation percentage |
|---|---|---|---|
| A | 8320 | 471 | 5.661058% |
| B | 8320 | 448 | 5.384615% |
| C | 8320 | 1806 | 21.706731% |
| D | 8320 | 581 | 6.983173% |
Noise dominated data is calculated using 1-second bins in cleaned event files. If a bin has >2000 counts, and if more than 50% of those come from <1% of pixels, then it is considered to be noise-dominated and hence unusable.
| Quadrant | # 1 sec bins | Bins with >0 counts | Bins with >2000 counts | High rate bins dominated by noise | Noise dominated (total time) | Noise dominated (detector-on time) | Marked lightcurve |
|---|---|---|---|---|---|---|---|
| A | 8675 | 8323 | 37 | 37 | 0.43% | 0.44% | 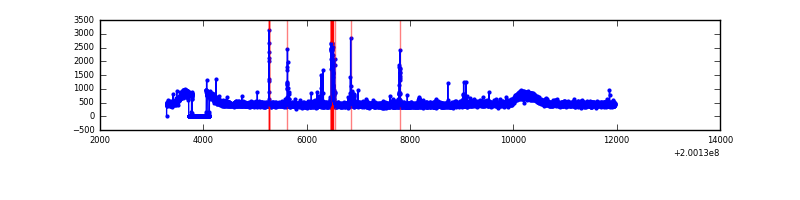 |
| B | 8675 | 8323 | 0 | 0 | 0.00% | 0.00% | 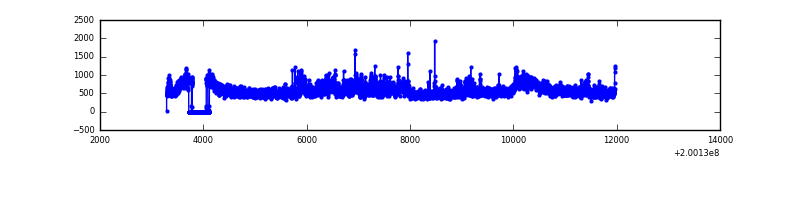 |
| C | 8675 | 8323 | 1346 | 1346 | 15.52% | 16.17% | 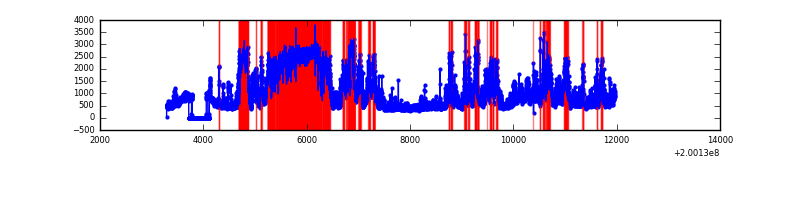 |
| D | 8675 | 8323 | 185 | 185 | 2.13% | 2.22% | 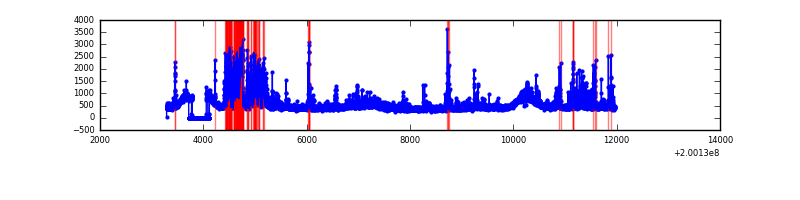 |
Top three noisy pixels from each quadrant. If the there are fewer than three noisy pixels in the level2.evt file, extra rows are filled as -1
| Pixel properties | Quadrant properties | ||||||
|---|---|---|---|---|---|---|---|
| Quadrant | DetID | PixID | Counts | Sigma | Mean | Median | Sigma |
| A | 0 | 50 | 103186 | 494.94 | 997 | 970 | 206.5 |
| A | 0 | 118 | 58708 | 279.57 | 997 | 970 | 206.5 |
| A | 0 | 226 | 16246 | 73.97 | 997 | 970 | 206.5 |
| B | 15 | 204 | 957793 | 4858.98 | 1011 | 984 | 196.9 |
| B | 2 | 249 | 14475 | 68.51 | 1011 | 984 | 196.9 |
| B | 5 | 200 | 14285 | 67.55 | 1011 | 984 | 196.9 |
| C | 1 | 192 | 4662277 | 21790.57 | 913 | 913 | 213.9 |
| C | 14 | 223 | 674421 | 3148.46 | 913 | 913 | 213.9 |
| C | 12 | 175 | 130506 | 605.81 | 913 | 913 | 213.9 |
| D | 12 | 233 | 945574 | 4085.88 | 965 | 936 | 231.2 |
| D | 13 | 223 | 114213 | 489.96 | 965 | 936 | 231.2 |
| D | 13 | 114 | 88160 | 377.27 | 965 | 936 | 231.2 |
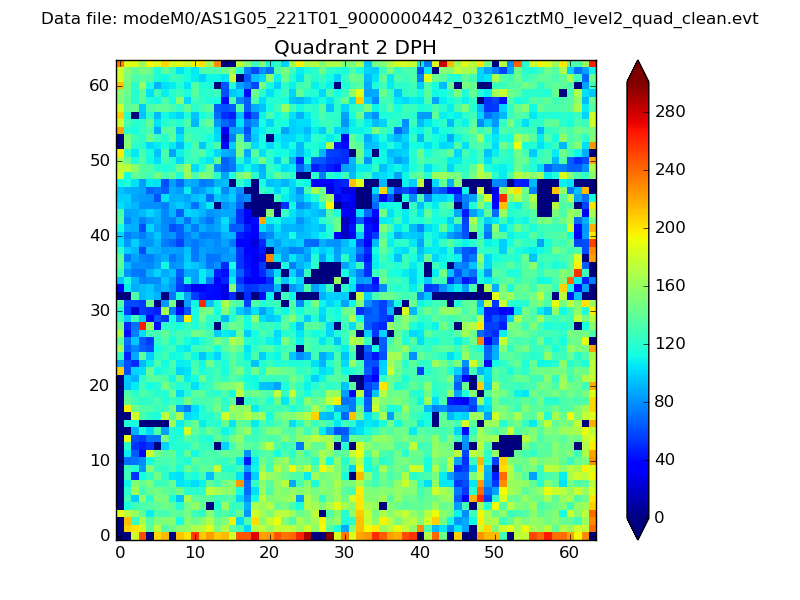
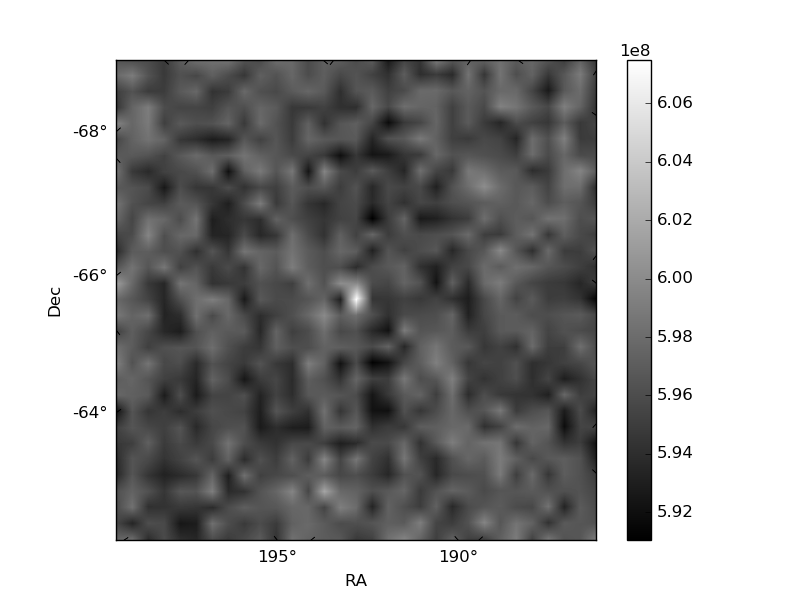
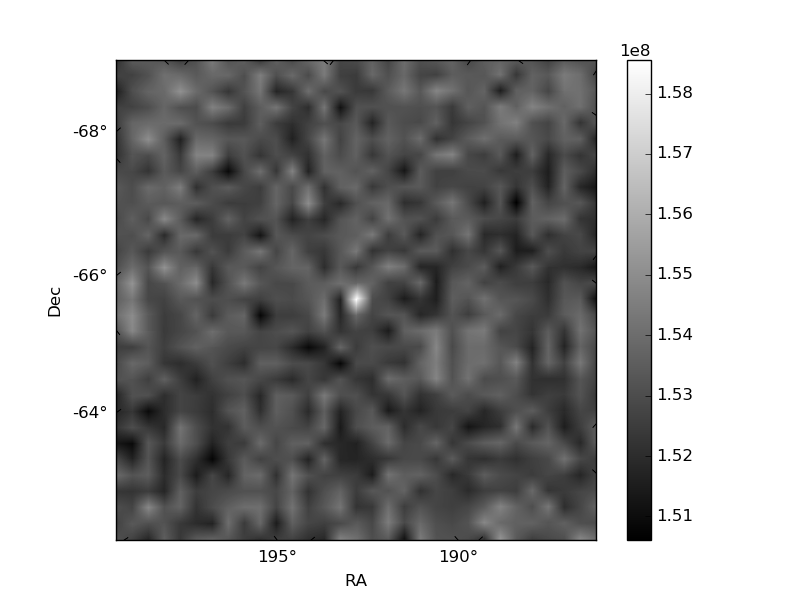
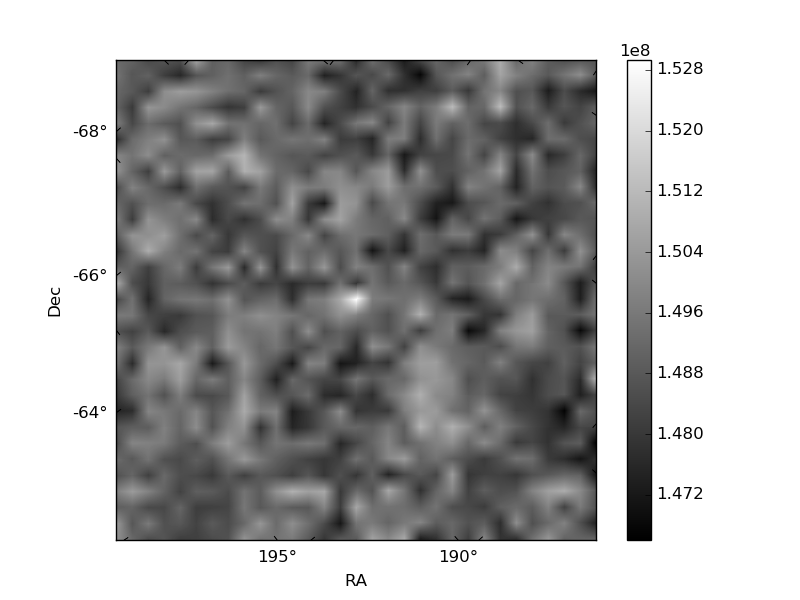
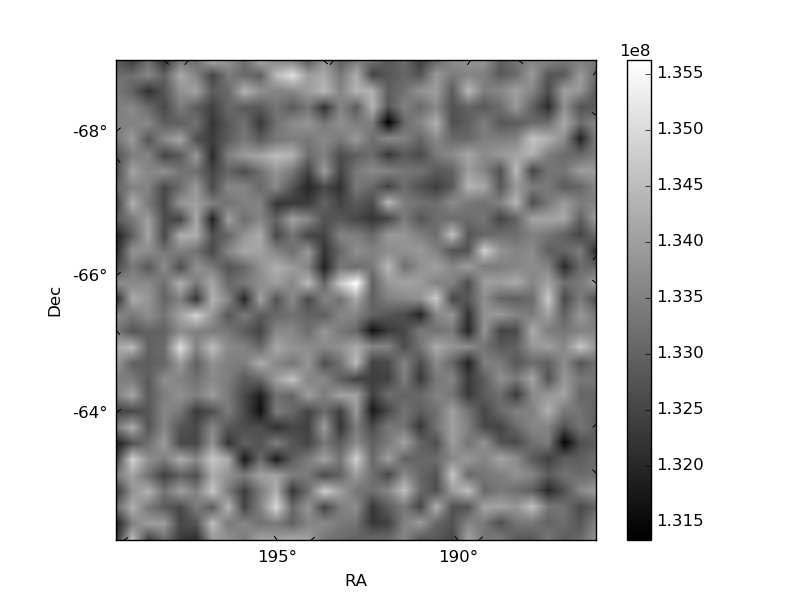
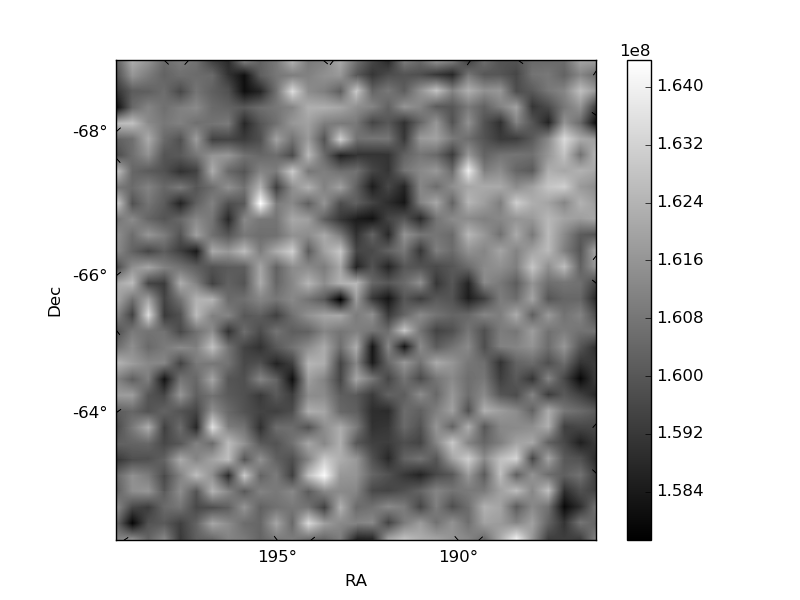
Histogram calculated using DETX and DETY for each event in the final _common_clean file
| Quadrant A | 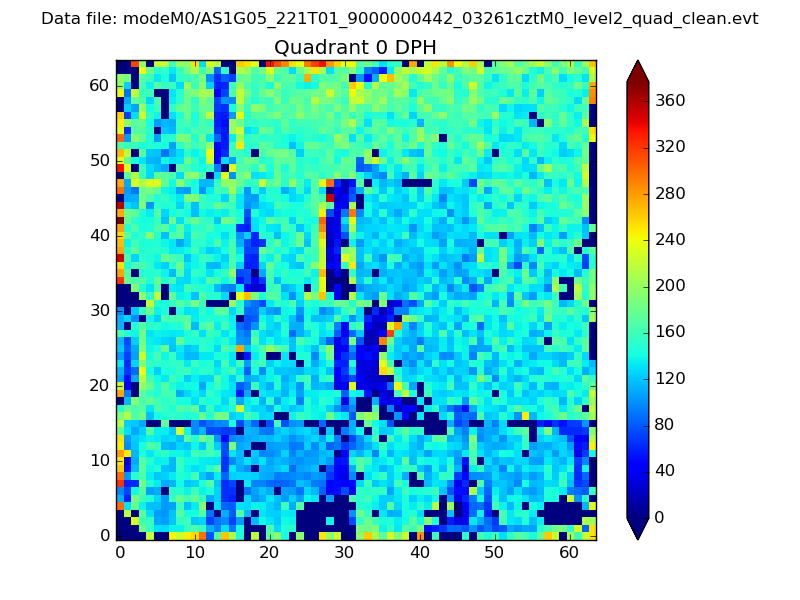 |
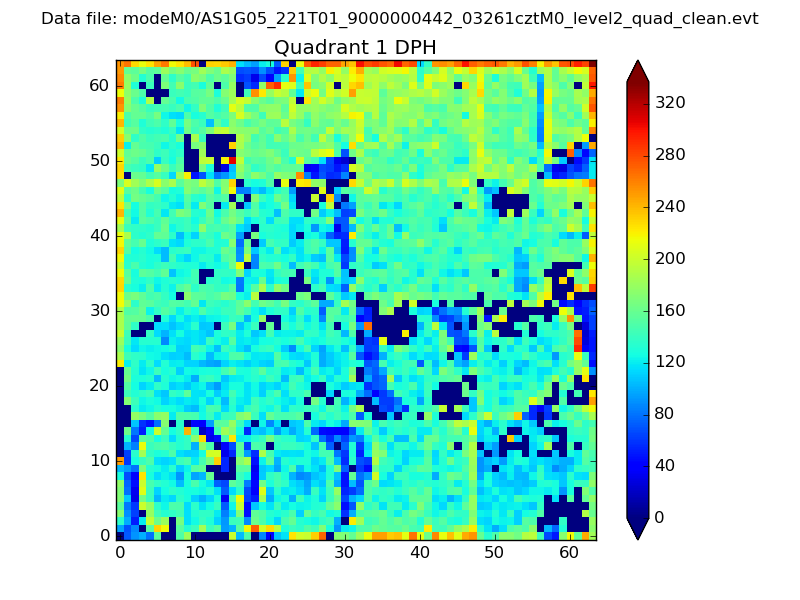 |
Quadrant B |
|---|---|---|---|
| Quadrant D | 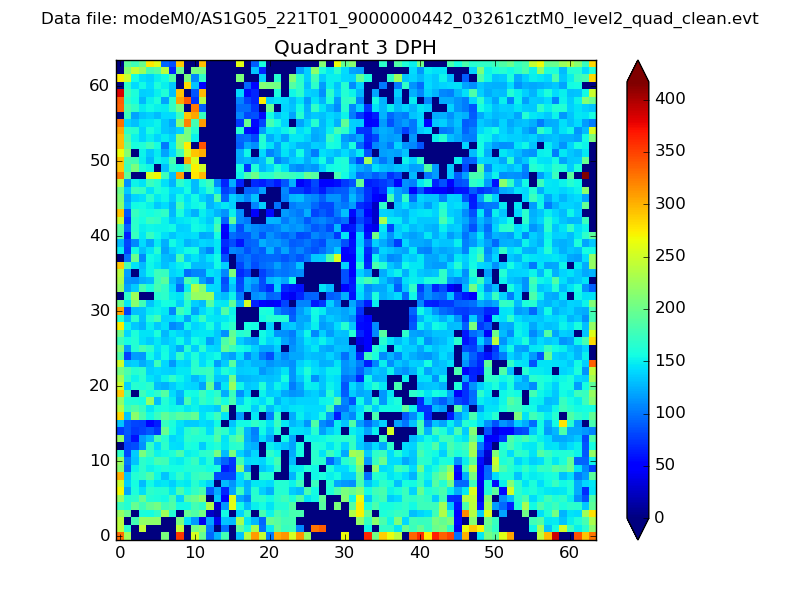 |
 |
Quadrant C |
| Plot type | Count rate plots | Images |
|---|---|---|
| Comparison with Poisson distribution Blue bars denote a histogram of data divided into 1 sec bins. Red curve is a Poisson curve with rate = median count rate of data. |
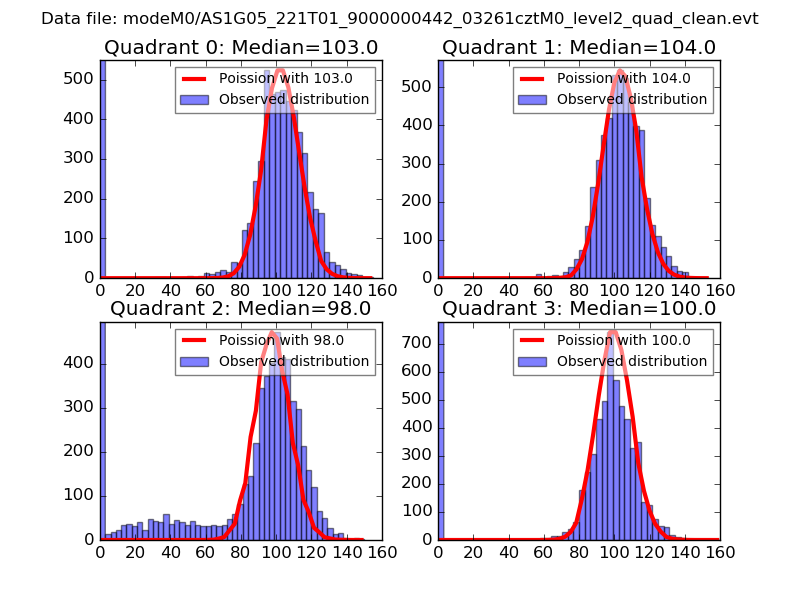 |
 |
| Quadrant-wise count rates Data is divided into 100 sec bins |
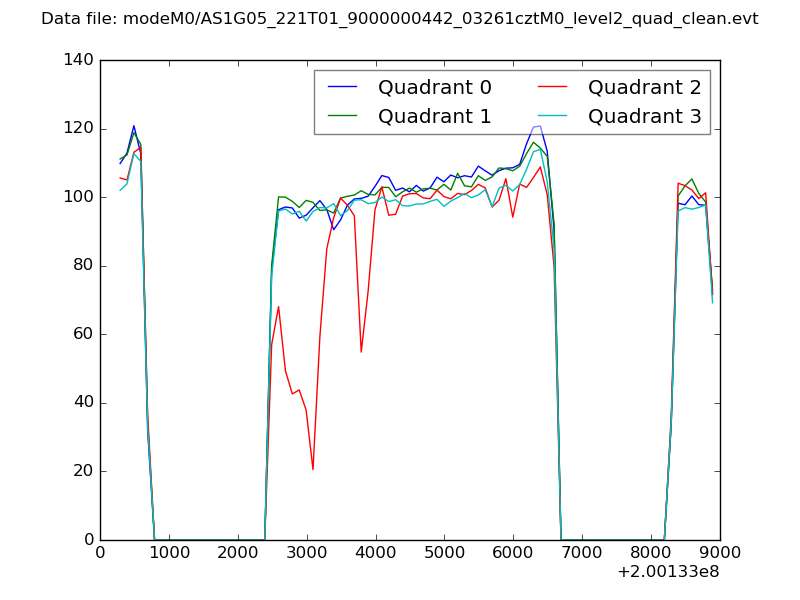 |
|
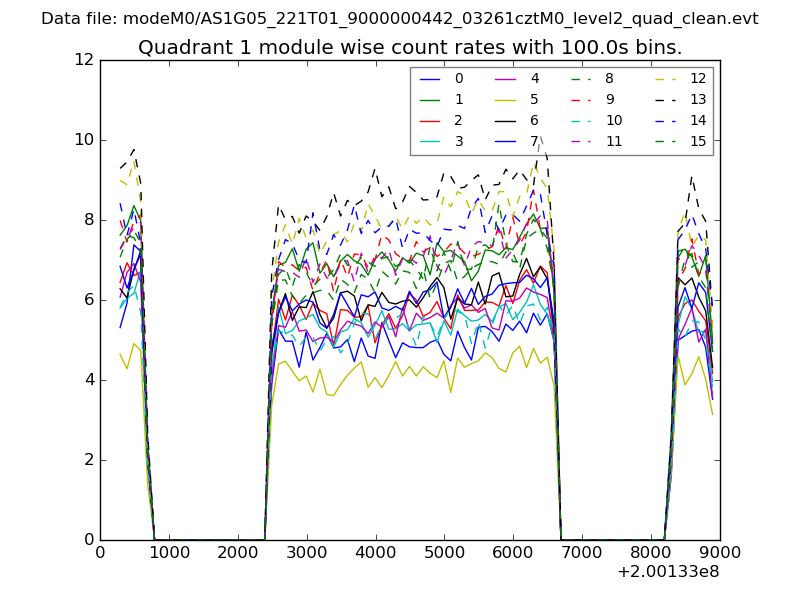
| Module-wise count rates for Quadrant A Data is divided into 100 sec bins |
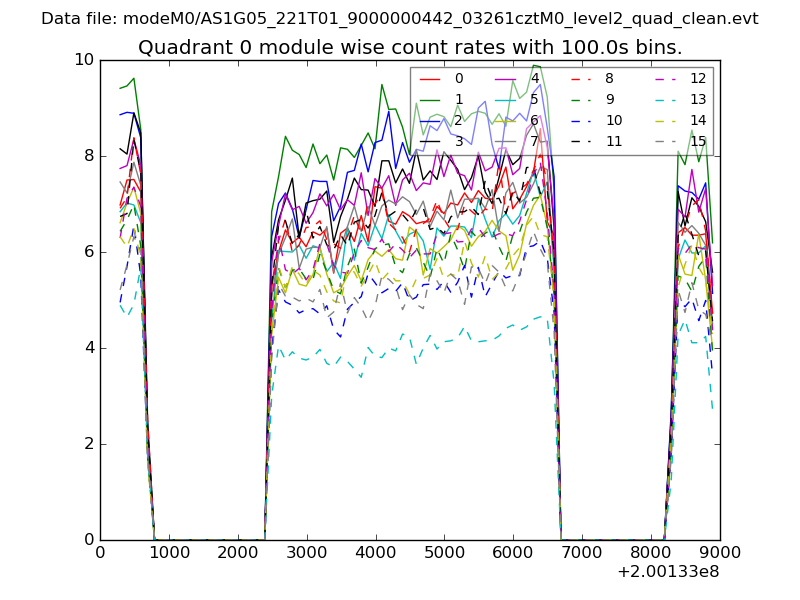 |
 |
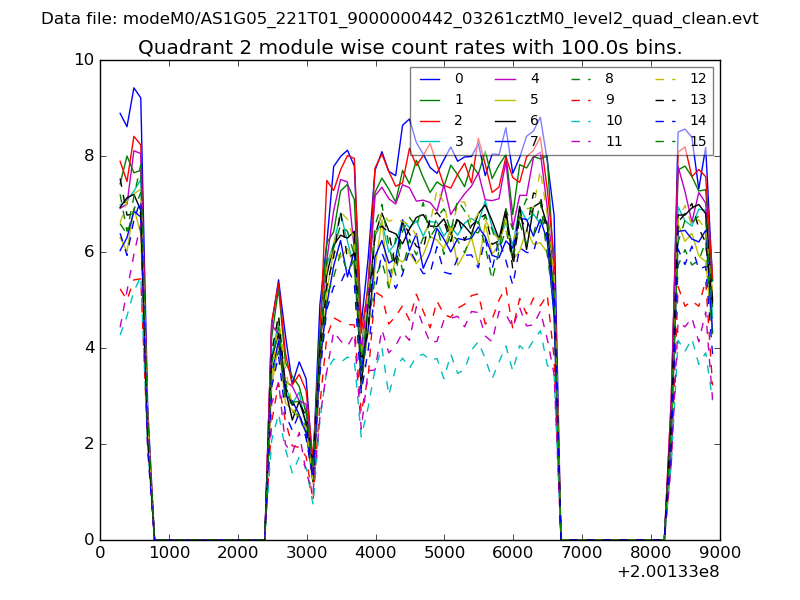
| Module-wise count rates for Quadrant B Data is divided into 100 sec bins |
 |
 |
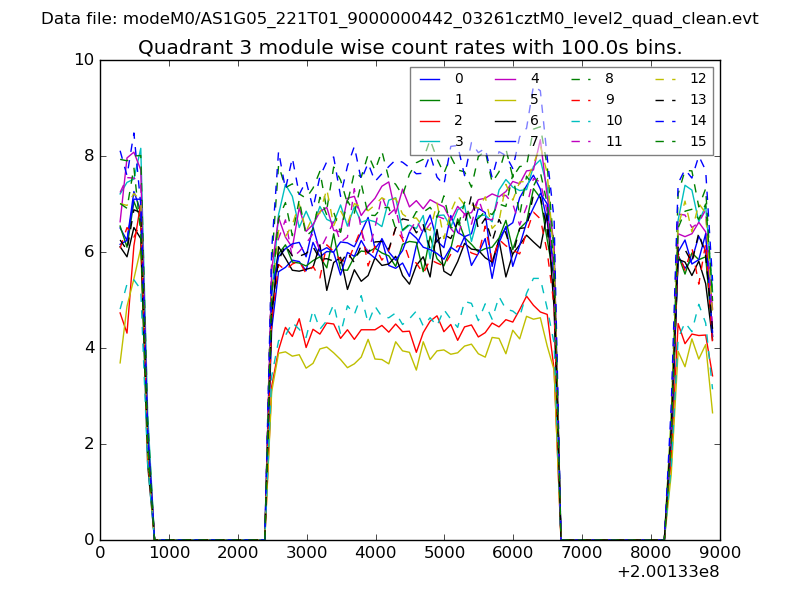
| Module-wise count rates for Quadrant C Data is divided into 100 sec bins |
 |
 |
| Module-wise count rates for Quadrant D Data is divided into 100 sec bins |
 |
 |
| Parameter | Plot |
|---|---|
| CZT HV Monitor |  |
| D_VDD | 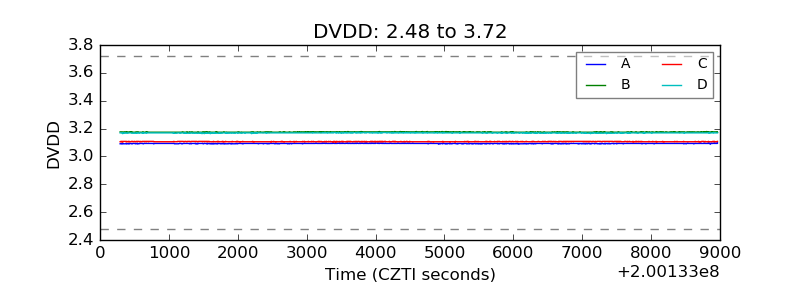 |
| Temperature 1 | 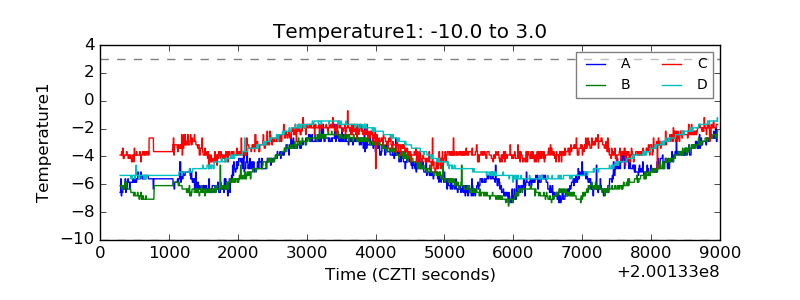 |
| Veto HV Monitor | 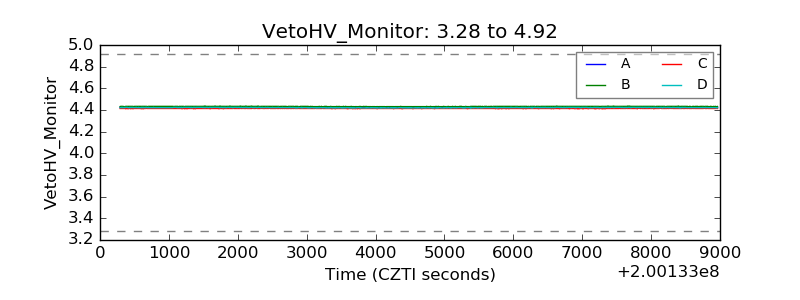 |
| Veto LLD | 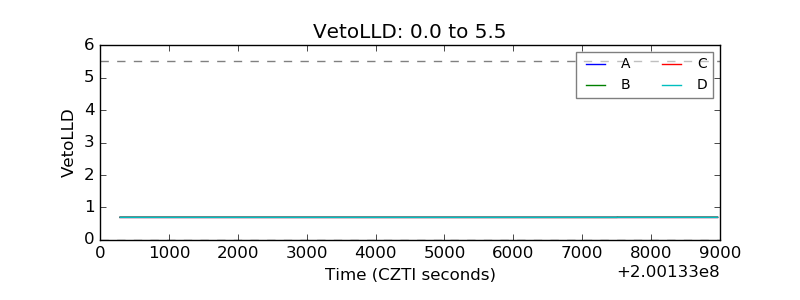 |
| Alpha Counter | 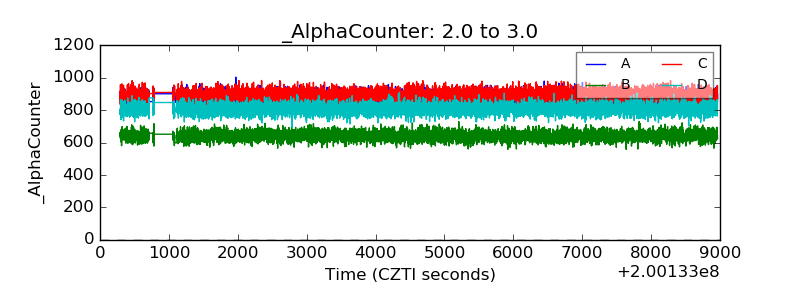 |
| _CPM_Rate | 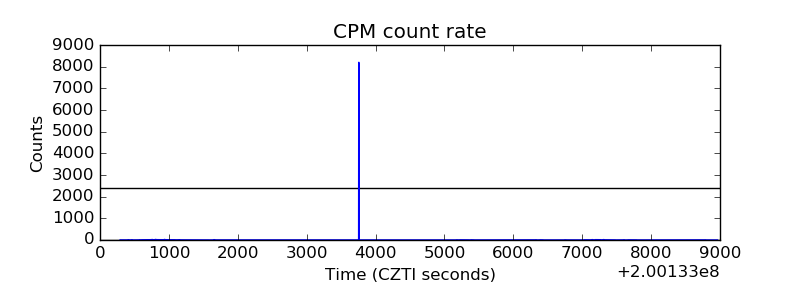 |
| CZT Counter | 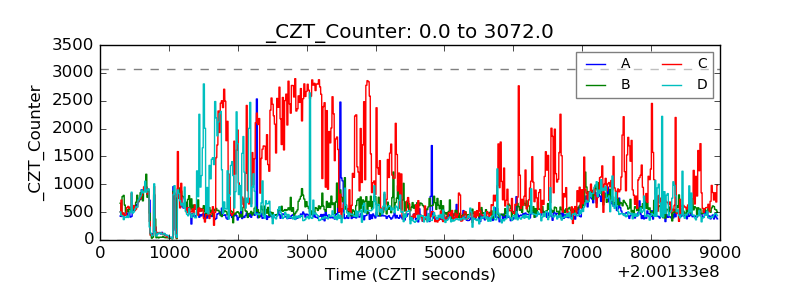 |
| +2.5 Volts monitor |  |
| +5 Volts monitor |  |
| _ROLL_ROT | 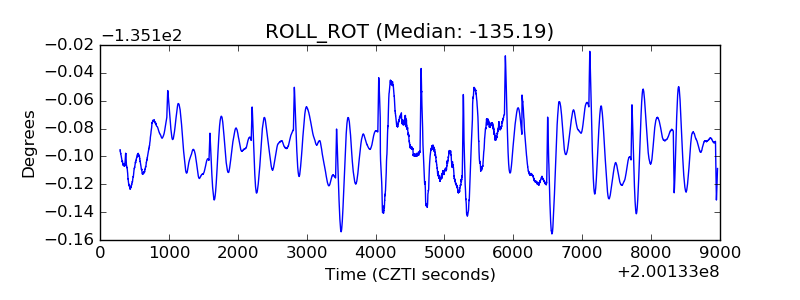 |
| _Roll_DEC | 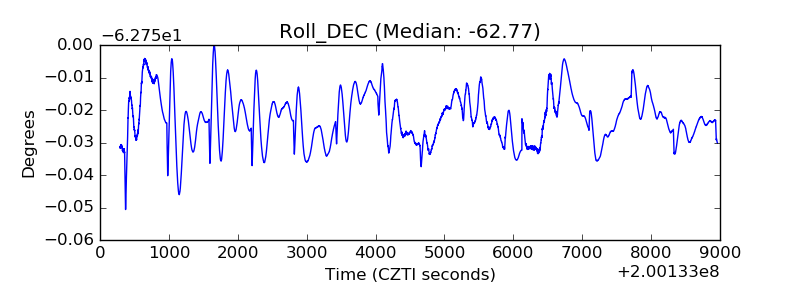 |
| _Roll_RA | 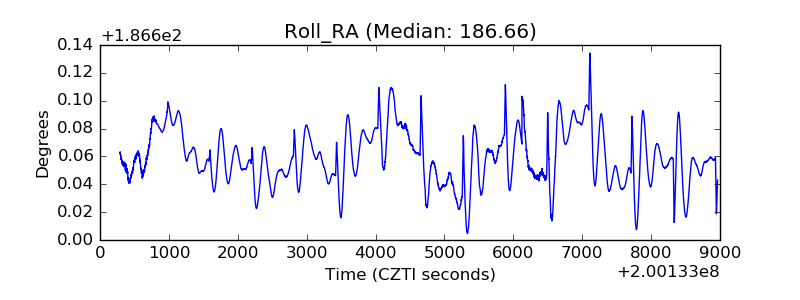 |
| Veto Counter | 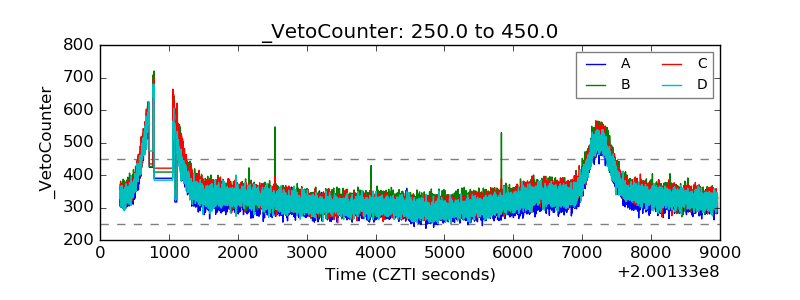 |