| Param | Original file | Final file |
|---|---|---|
| Filename | modeM0/AS1G05_221T01_9000000442_03268cztM0_level2.evt | modeM0/AS1G05_221T01_9000000442_03268cztM0_level2_quad_clean.evt |
| Size (bytes) | 451,883,520 | 82,558,080 |
| Size | 430.9 MB | 78.7 MB |
| Events in quadrant A | 3,051,386 | 519,923 |
| Events in quadrant B | 3,953,788 | 525,048 |
| Events in quadrant C | 3,202,865 | 510,460 |
| Events in quadrant D | 3,036,976 | 492,401 |
| Mode M9 | |||
|---|---|---|---|
| Quadrant | BADHDUFLAG | Total packets | Discarded packets |
| A | 0 | 17 | 0 |
| B | 0 | 17 | 0 |
| C | 0 | 17 | 0 |
| D | 0 | 18 | 0 |
| Mode SS | |||
|---|---|---|---|
| Quadrant | BADHDUFLAG | Total packets | Discarded packets |
| A | 0 | 132 | 0 |
| B | 0 | 132 | 0 |
| C | 0 | 132 | 0 |
| D | 0 | 132 | 0 |
| Mode M0 | |||
|---|---|---|---|
| Quadrant | BADHDUFLAG | Total packets | Discarded packets |
| A | 0 | 13702 | 3 |
| B | 0 | 16251 | 2 |
| C | 0 | 14198 | 2 |
| D | 0 | 14016 | 2 |
| Quadrant | Total seconds | Saturated seconds | Saturation percentage |
|---|---|---|---|
| A | 6479 | 45 | 0.694552% |
| B | 6479 | 49 | 0.756290% |
| C | 6479 | 57 | 0.879765% |
| D | 6479 | 78 | 1.203889% |
Noise dominated data is calculated using 1-second bins in cleaned event files. If a bin has >2000 counts, and if more than 50% of those come from <1% of pixels, then it is considered to be noise-dominated and hence unusable.
| Quadrant | # 1 sec bins | Bins with >0 counts | Bins with >2000 counts | High rate bins dominated by noise | Noise dominated (total time) | Noise dominated (detector-on time) | Marked lightcurve |
|---|---|---|---|---|---|---|---|
| A | 7554 | 6480 | 12 | 12 | 0.16% | 0.19% | 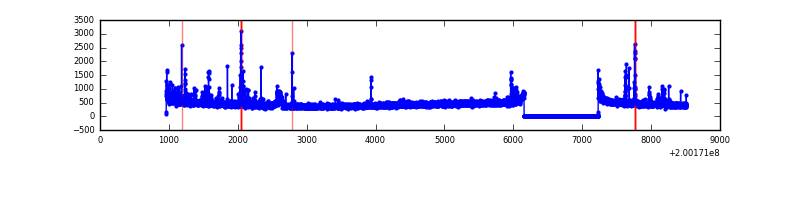 |
| B | 7554 | 6480 | 5 | 5 | 0.07% | 0.08% | 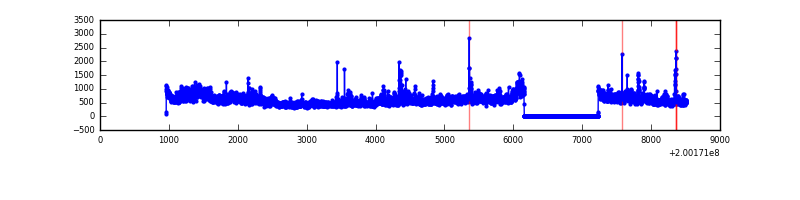 |
| C | 7554 | 6480 | 40 | 40 | 0.53% | 0.62% | 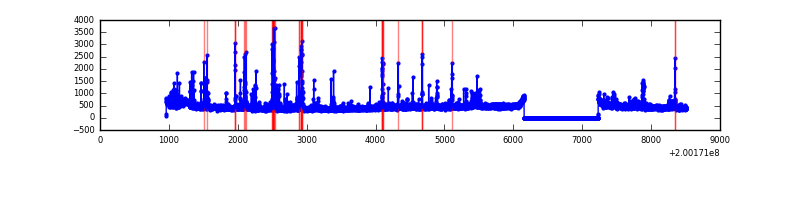 |
| D | 7554 | 6480 | 64 | 64 | 0.85% | 0.99% | 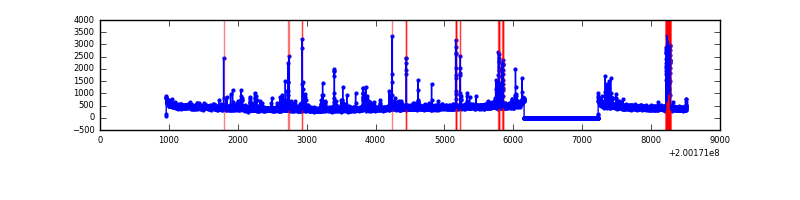 |
Top three noisy pixels from each quadrant. If the there are fewer than three noisy pixels in the level2.evt file, extra rows are filled as -1
| Pixel properties | Quadrant properties | ||||||
|---|---|---|---|---|---|---|---|
| Quadrant | DetID | PixID | Counts | Sigma | Mean | Median | Sigma |
| A | 0 | 118 | 88393 | 579.26 | 733 | 717 | 151.4 |
| A | 3 | 1 | 61233 | 399.82 | 733 | 717 | 151.4 |
| A | 0 | 50 | 34329 | 222.07 | 733 | 717 | 151.4 |
| B | 15 | 204 | 932622 | 6417.69 | 749 | 732 | 145.2 |
| B | 14 | 167 | 52127 | 353.94 | 749 | 732 | 145.2 |
| B | 2 | 249 | 40214 | 271.9 | 749 | 732 | 145.2 |
| C | 14 | 223 | 224293 | 1349.37 | 707 | 711 | 165.7 |
| C | 1 | 192 | 96826 | 580.08 | 707 | 711 | 165.7 |
| C | 12 | 4 | 49297 | 293.23 | 707 | 711 | 165.7 |
| D | 13 | 223 | 226469 | 1331.2 | 696 | 674 | 169.6 |
| D | 2 | 248 | 64401 | 375.71 | 696 | 674 | 169.6 |
| D | 2 | 31 | 36494 | 211.18 | 696 | 674 | 169.6 |
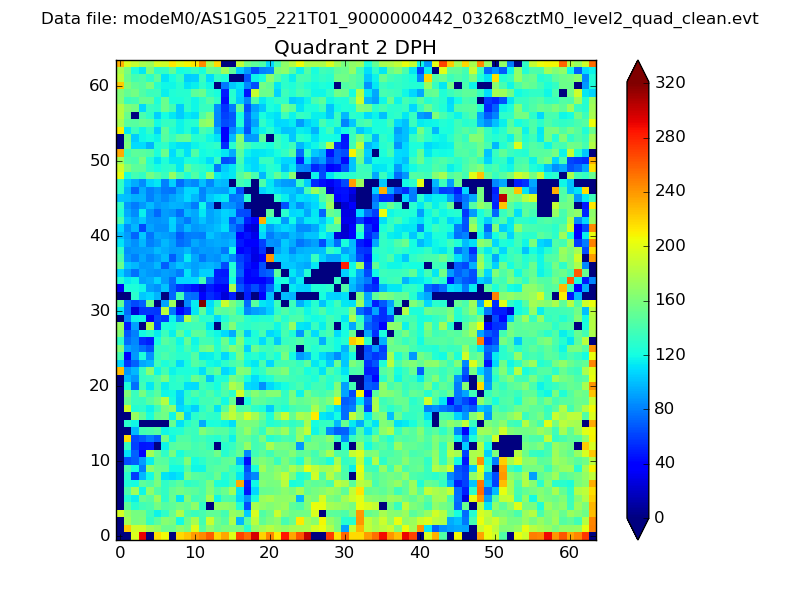
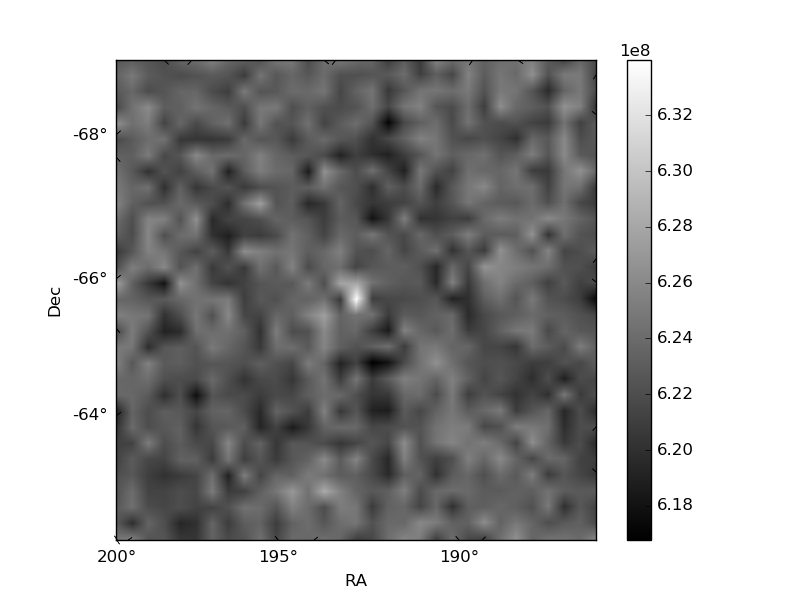
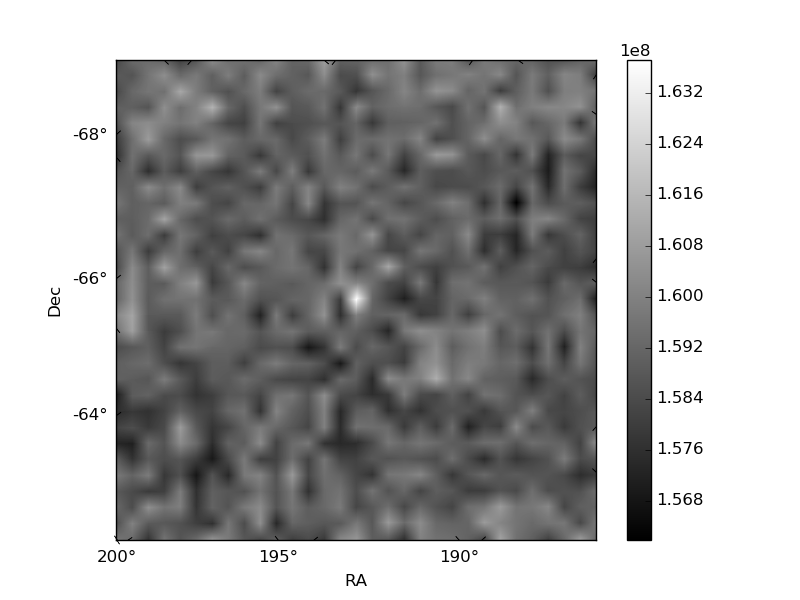
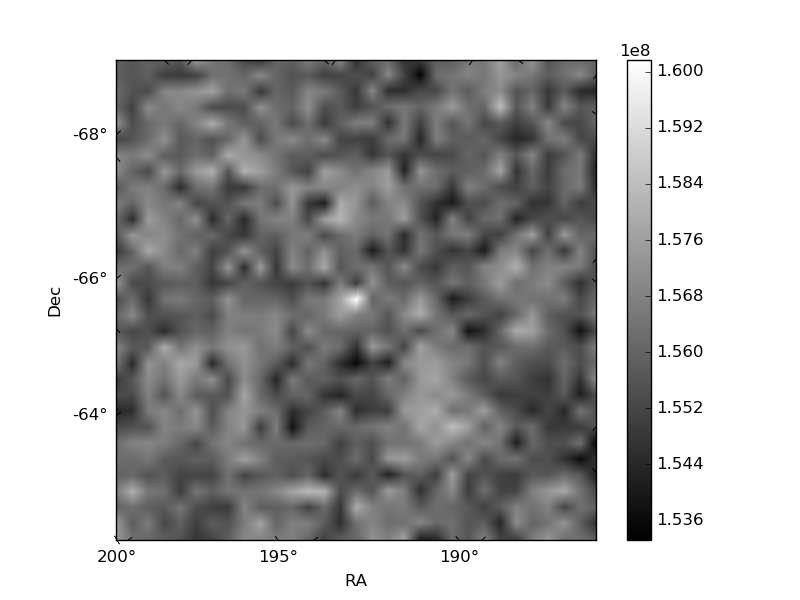
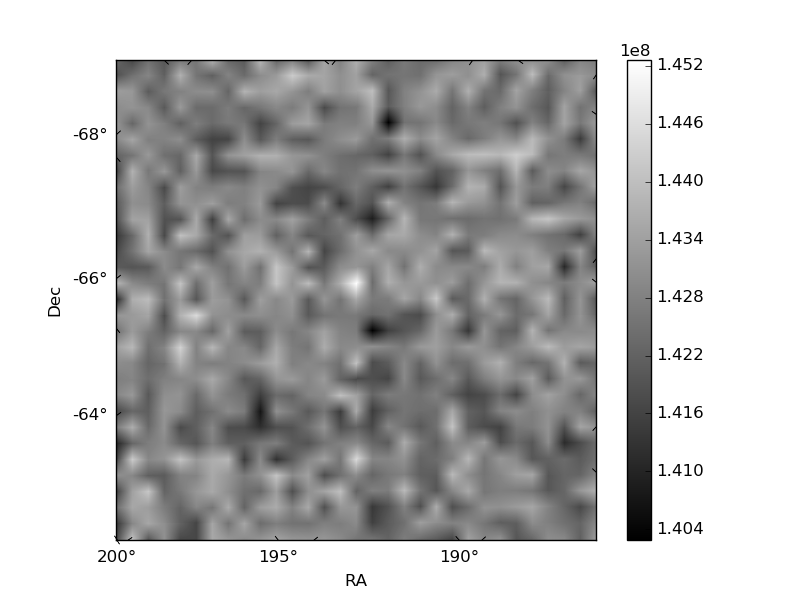
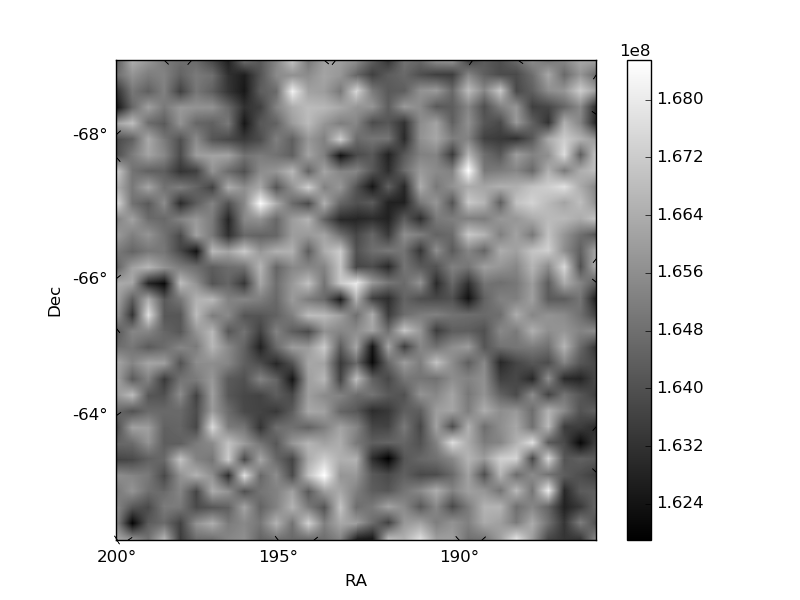
Histogram calculated using DETX and DETY for each event in the final _common_clean file
| Quadrant A | 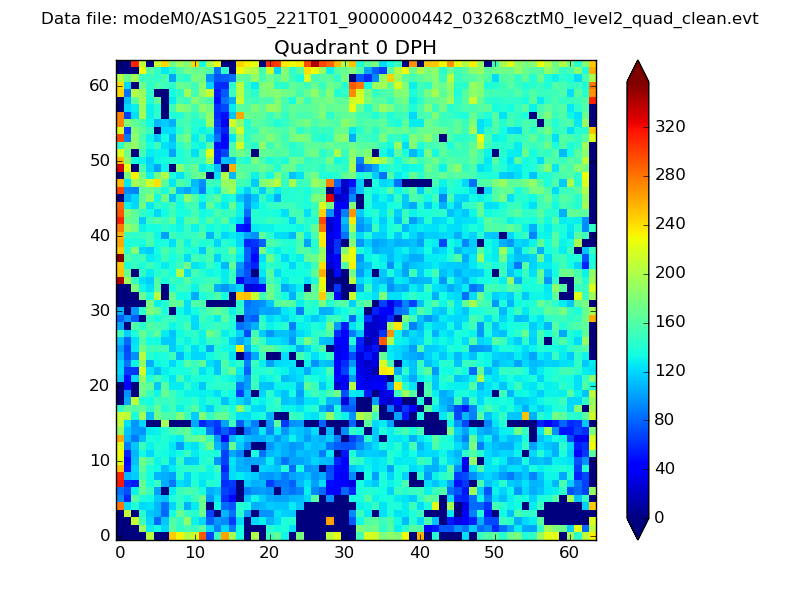 |
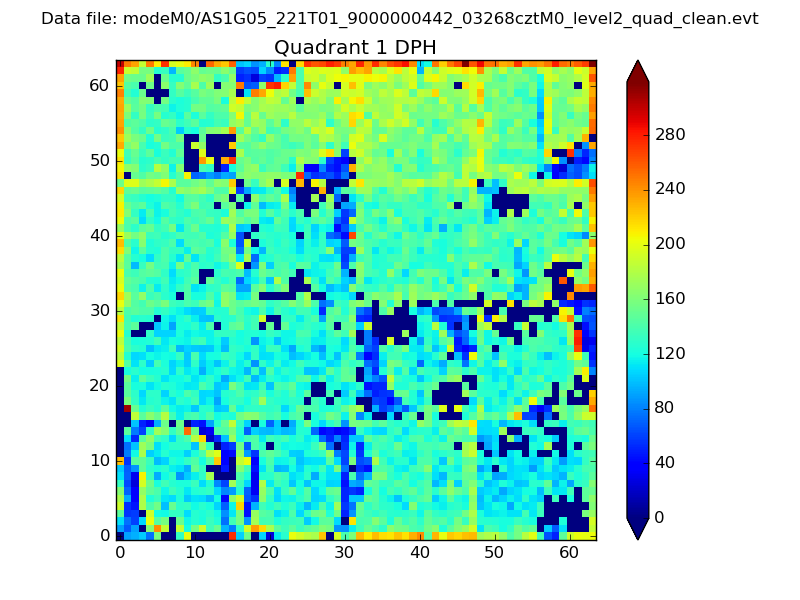 |
Quadrant B |
|---|---|---|---|
| Quadrant D | 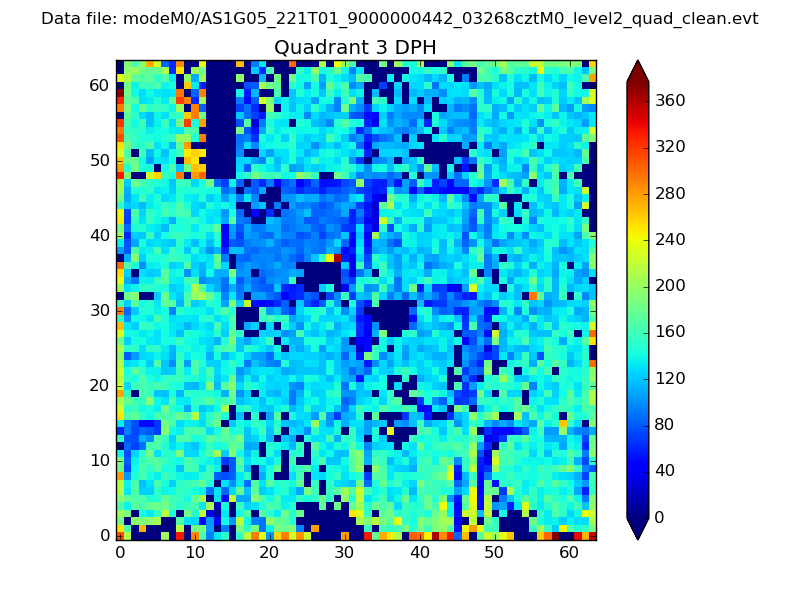 |
 |
Quadrant C |
| Plot type | Count rate plots | Images |
|---|---|---|
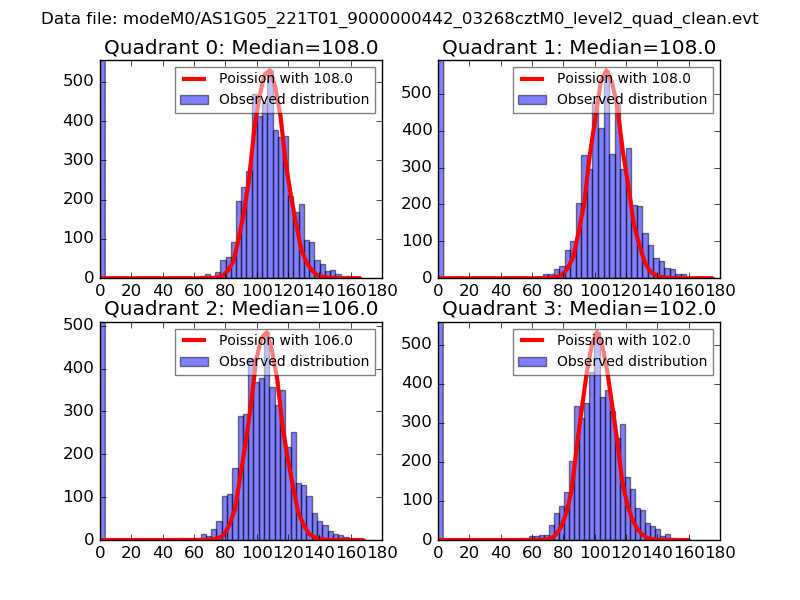
| Comparison with Poisson distribution Blue bars denote a histogram of data divided into 1 sec bins. Red curve is a Poisson curve with rate = median count rate of data. |
 |
 |
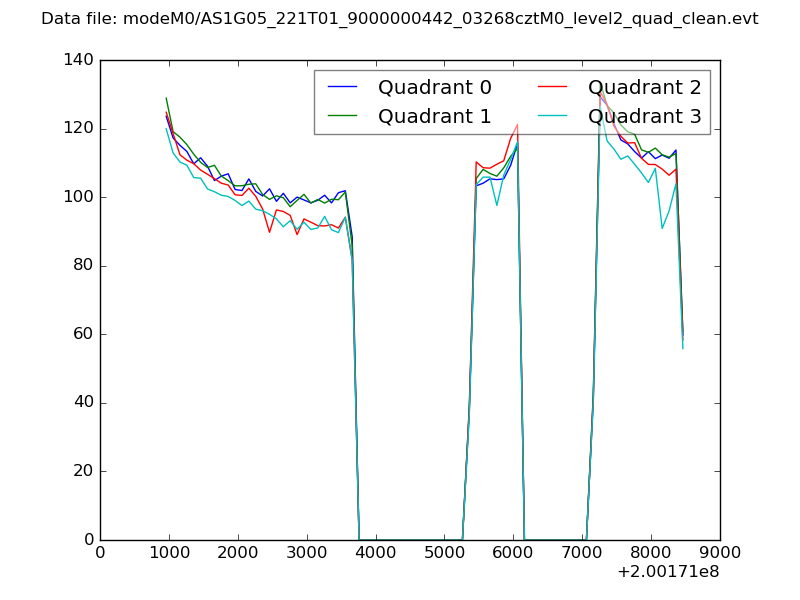
| Quadrant-wise count rates Data is divided into 100 sec bins |
 |
|
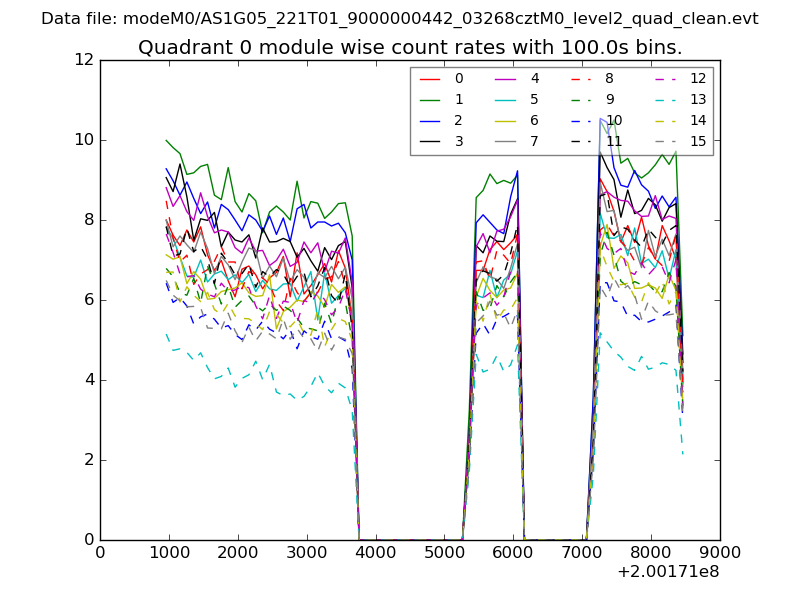
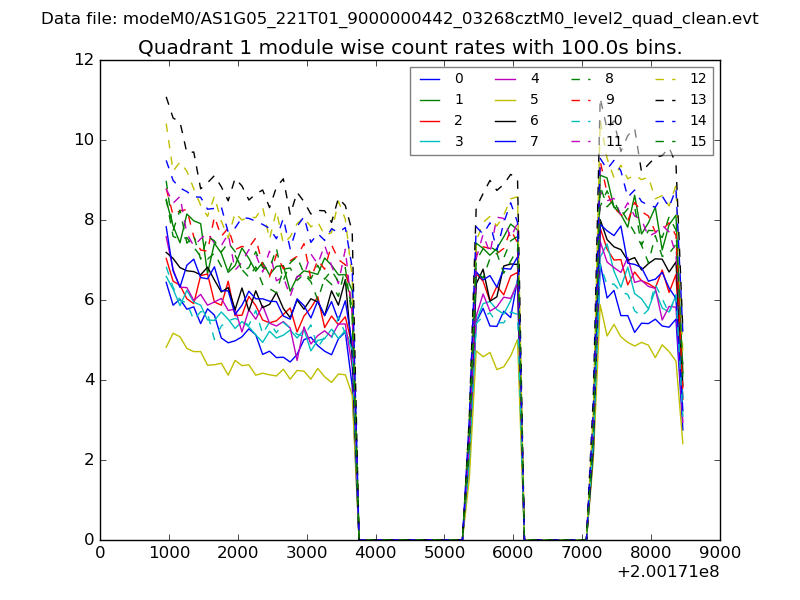
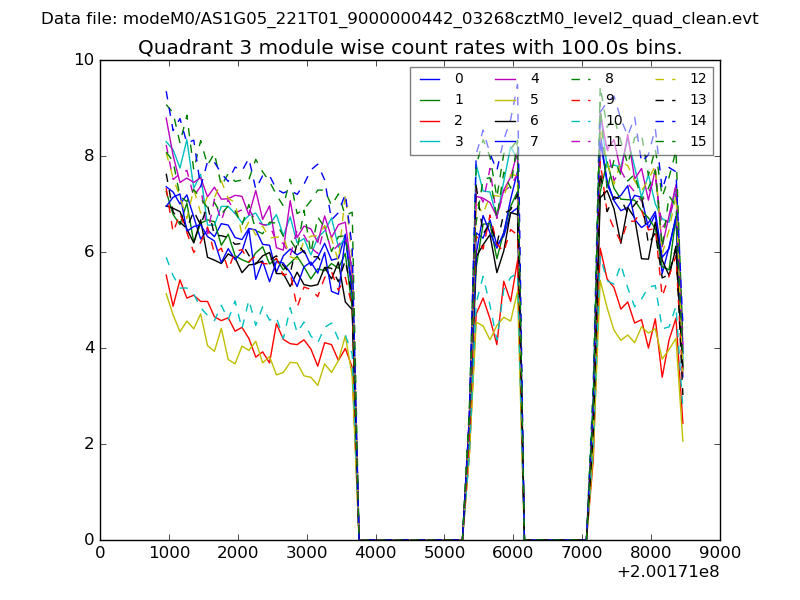
| Module-wise count rates for Quadrant A Data is divided into 100 sec bins |
 |
 |
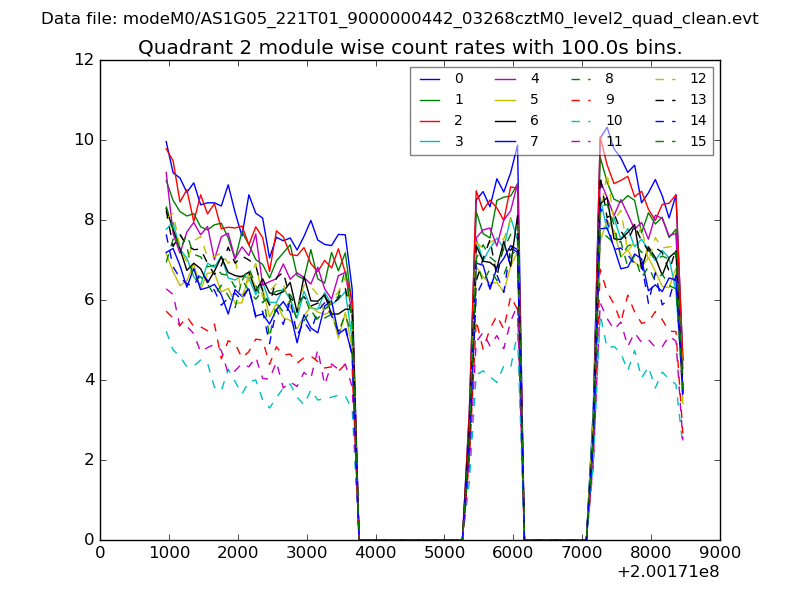
| Module-wise count rates for Quadrant B Data is divided into 100 sec bins |
 |
 |
| Module-wise count rates for Quadrant C Data is divided into 100 sec bins |
 |
 |
| Module-wise count rates for Quadrant D Data is divided into 100 sec bins |
 |
 |
| Parameter | Plot |
|---|---|
| CZT HV Monitor | 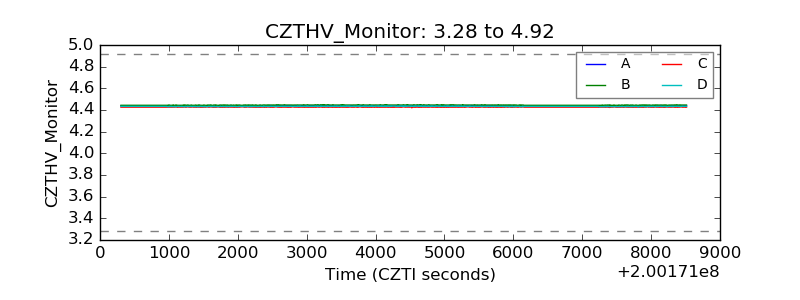 |
| D_VDD | 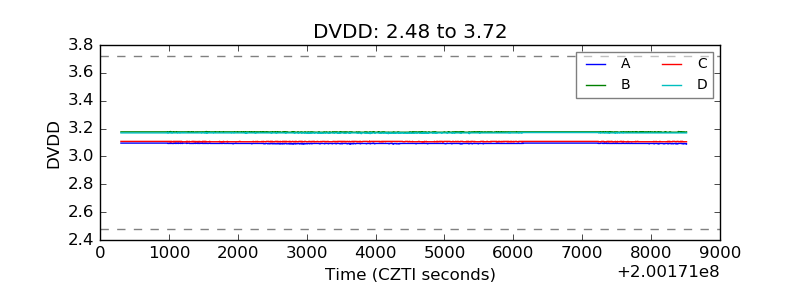 |
| Temperature 1 | 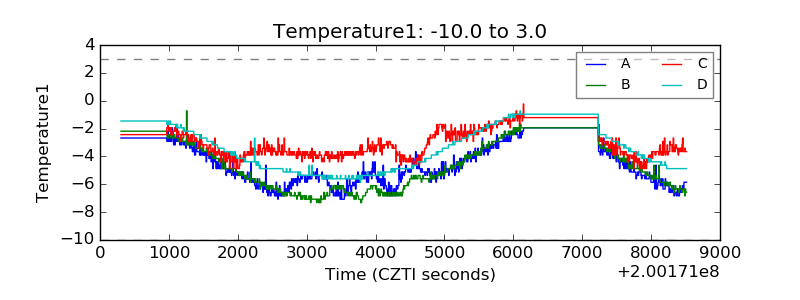 |
| Veto HV Monitor | 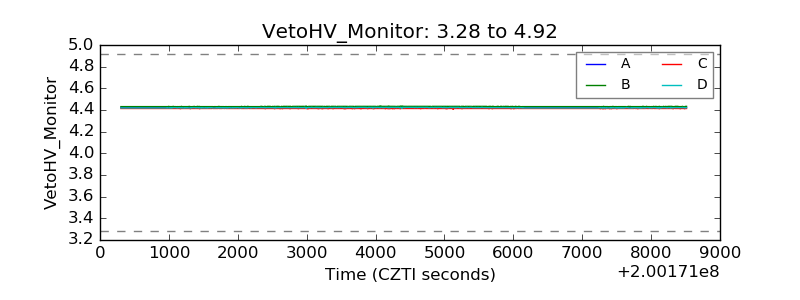 |
| Veto LLD | 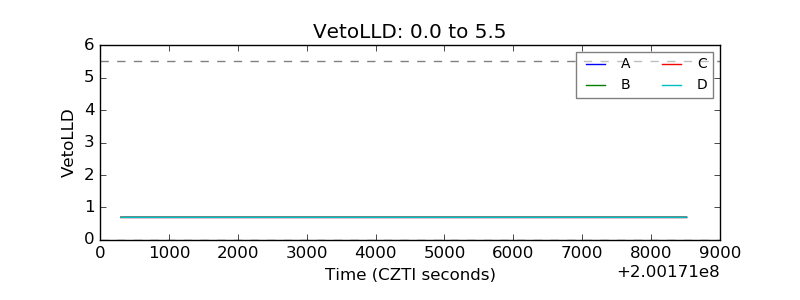 |
| Alpha Counter | 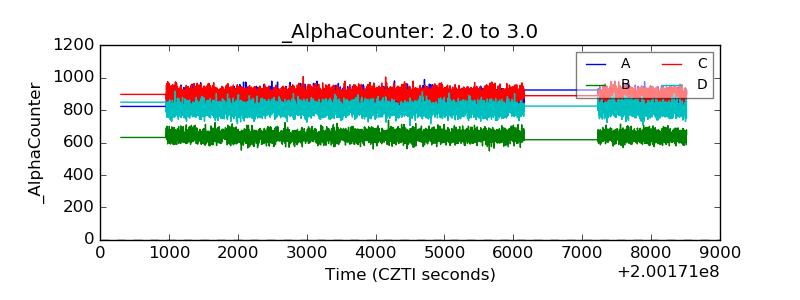 |
| _CPM_Rate | 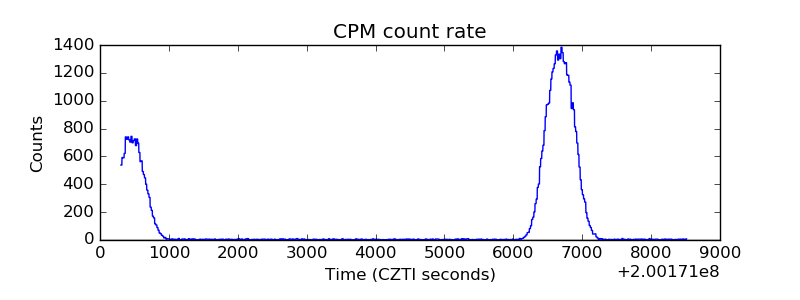 |
| CZT Counter | 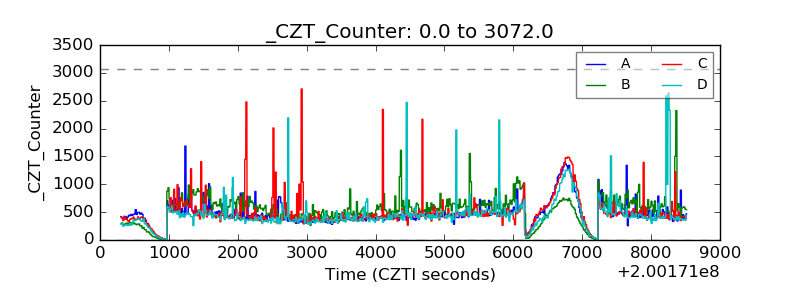 |
| +2.5 Volts monitor |  |
| +5 Volts monitor |  |
| _ROLL_ROT | 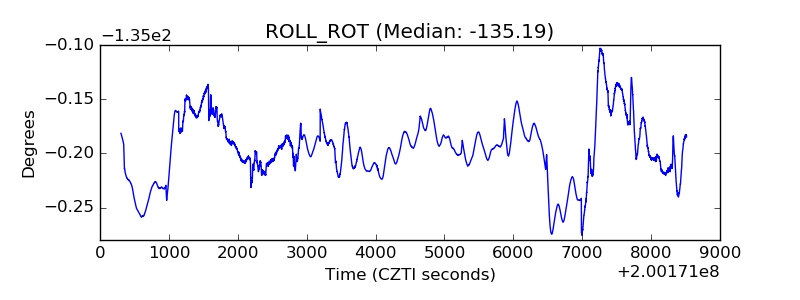 |
| _Roll_DEC | 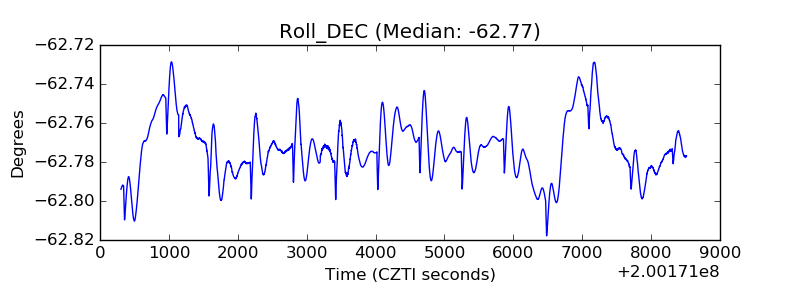 |
| _Roll_RA | 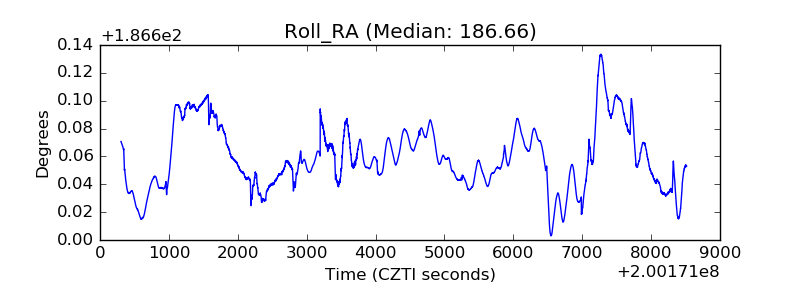 |
| Veto Counter | 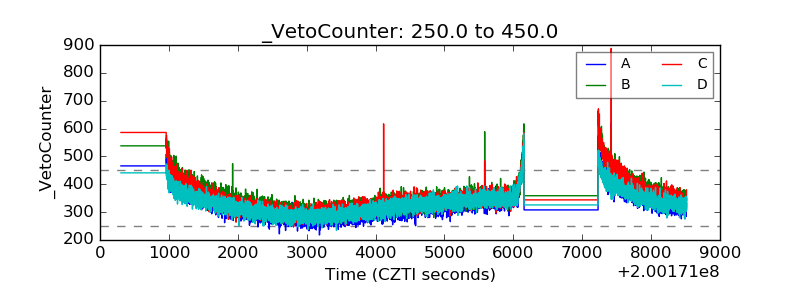 |