| Param | Original file | Final file |
|---|---|---|
| Filename | modeM0/AS1G05_002T02_9000000444_03270cztM0_level2.evt | modeM0/AS1G05_002T02_9000000444_03270cztM0_level2_quad_clean.evt |
| Size (bytes) | 437,279,040 | 76,884,480 |
| Size | 417.0 MB | 73.3 MB |
| Events in quadrant A | 2,799,192 | 477,259 |
| Events in quadrant B | 3,413,663 | 489,045 |
| Events in quadrant C | 3,559,270 | 468,656 |
| Events in quadrant D | 3,046,444 | 457,286 |
| Mode M0 | |||
|---|---|---|---|
| Quadrant | BADHDUFLAG | Total packets | Discarded packets |
| A | 0 | 12701 | 3 |
| B | 0 | 14202 | 2 |
| C | 0 | 14835 | 2 |
| D | 0 | 13630 | 2 |
| Mode M9 | |||
|---|---|---|---|
| Quadrant | BADHDUFLAG | Total packets | Discarded packets |
| A | 0 | 21 | 0 |
| B | 0 | 21 | 0 |
| C | 0 | 21 | 0 |
| D | 0 | 22 | 0 |
| Mode SS | |||
|---|---|---|---|
| Quadrant | BADHDUFLAG | Total packets | Discarded packets |
| A | 0 | 126 | 0 |
| B | 0 | 126 | 0 |
| C | 0 | 126 | 0 |
| D | 0 | 126 | 0 |
| Quadrant | Total seconds | Saturated seconds | Saturation percentage |
|---|---|---|---|
| A | 6246 | 10 | 0.160102% |
| B | 6246 | 30 | 0.480307% |
| C | 6246 | 169 | 2.705732% |
| D | 6246 | 56 | 0.896574% |
Noise dominated data is calculated using 1-second bins in cleaned event files. If a bin has >2000 counts, and if more than 50% of those come from <1% of pixels, then it is considered to be noise-dominated and hence unusable.
| Quadrant | # 1 sec bins | Bins with >0 counts | Bins with >2000 counts | High rate bins dominated by noise | Noise dominated (total time) | Noise dominated (detector-on time) | Marked lightcurve |
|---|---|---|---|---|---|---|---|
| A | 7526 | 6247 | 0 | 0 | 0.00% | 0.00% | 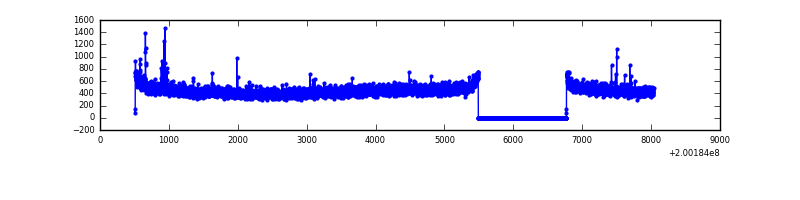 |
| B | 7526 | 6247 | 2 | 2 | 0.03% | 0.03% | 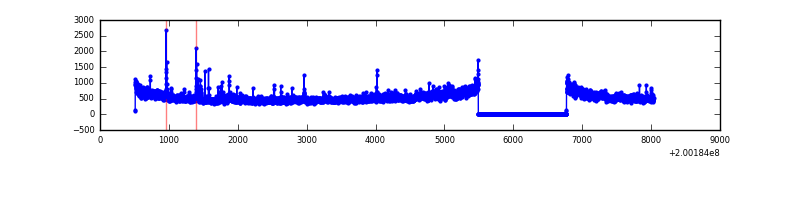 |
| C | 7526 | 6247 | 146 | 146 | 1.94% | 2.34% | 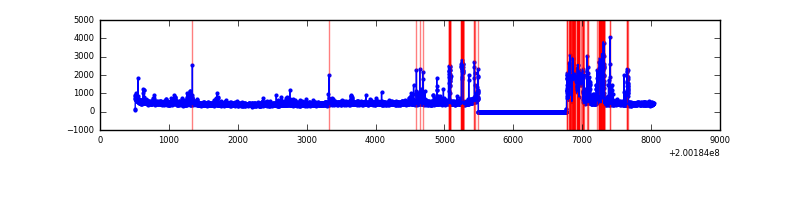 |
| D | 7526 | 6247 | 43 | 43 | 0.57% | 0.69% | 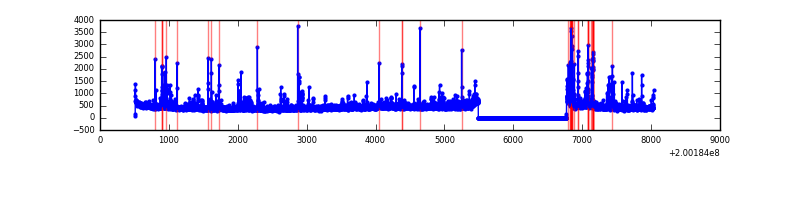 |
Top three noisy pixels from each quadrant. If the there are fewer than three noisy pixels in the level2.evt file, extra rows are filled as -1
| Pixel properties | Quadrant properties | ||||||
|---|---|---|---|---|---|---|---|
| Quadrant | DetID | PixID | Counts | Sigma | Mean | Median | Sigma |
| A | 0 | 118 | 14612 | 94.95 | 720 | 707 | 146.4 |
| A | 0 | 226 | 8657 | 54.29 | 720 | 707 | 146.4 |
| A | 12 | 194 | 7524 | 46.55 | 720 | 707 | 146.4 |
| B | 15 | 204 | 485227 | 3431.86 | 740 | 722 | 141.2 |
| B | 2 | 249 | 36222 | 251.45 | 740 | 722 | 141.2 |
| B | 6 | 205 | 14743 | 99.31 | 740 | 722 | 141.2 |
| C | 14 | 223 | 704105 | 4377.47 | 699 | 704 | 160.7 |
| C | 2 | 53 | 61519 | 378.47 | 699 | 704 | 160.7 |
| C | 6 | 80 | 23853 | 144.06 | 699 | 704 | 160.7 |
| D | 13 | 223 | 224432 | 1346.14 | 691 | 671 | 166.2 |
| D | 5 | 233 | 93295 | 557.22 | 691 | 671 | 166.2 |
| D | 13 | 239 | 35113 | 207.2 | 691 | 671 | 166.2 |
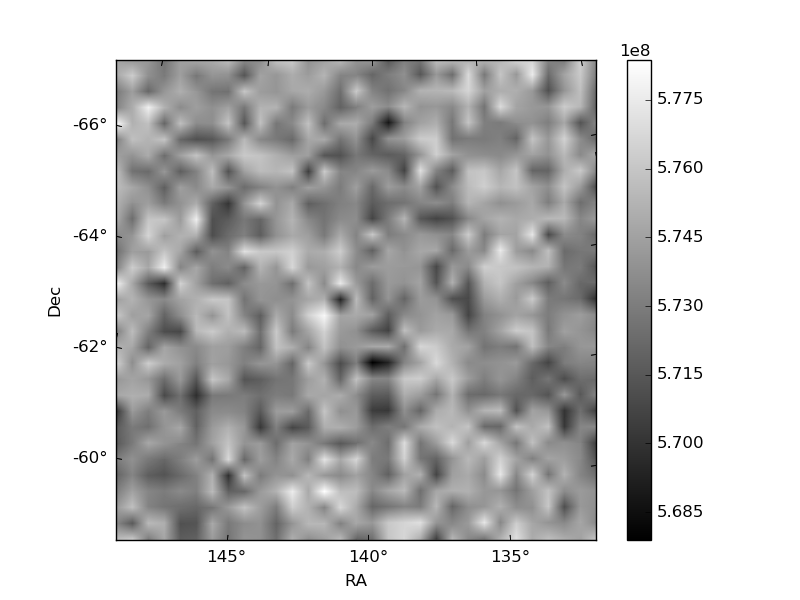
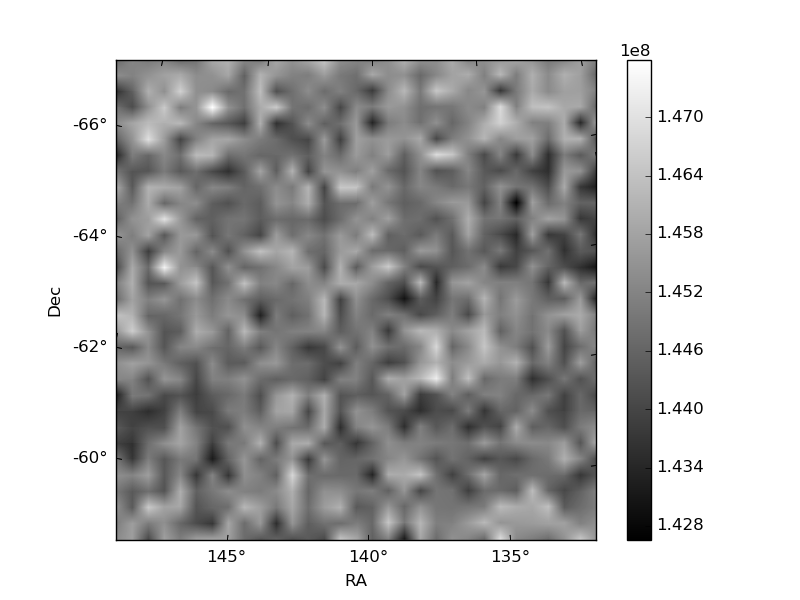
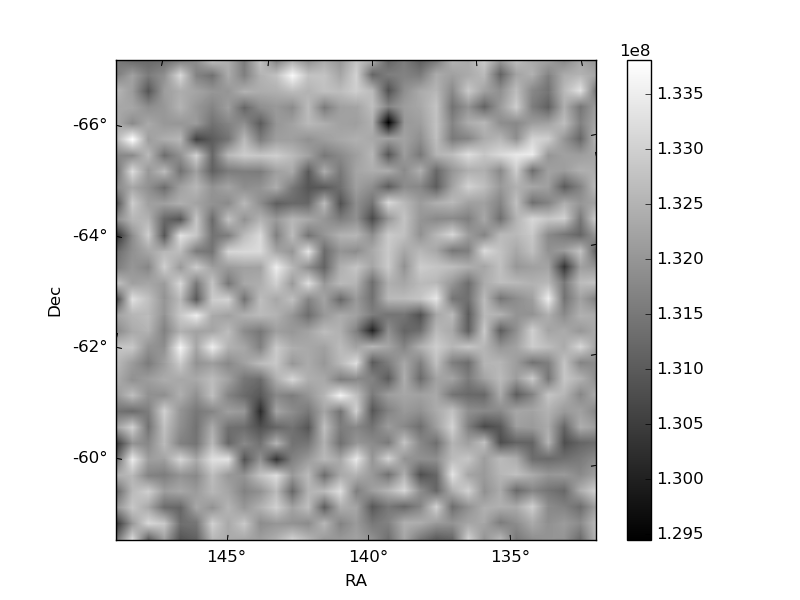
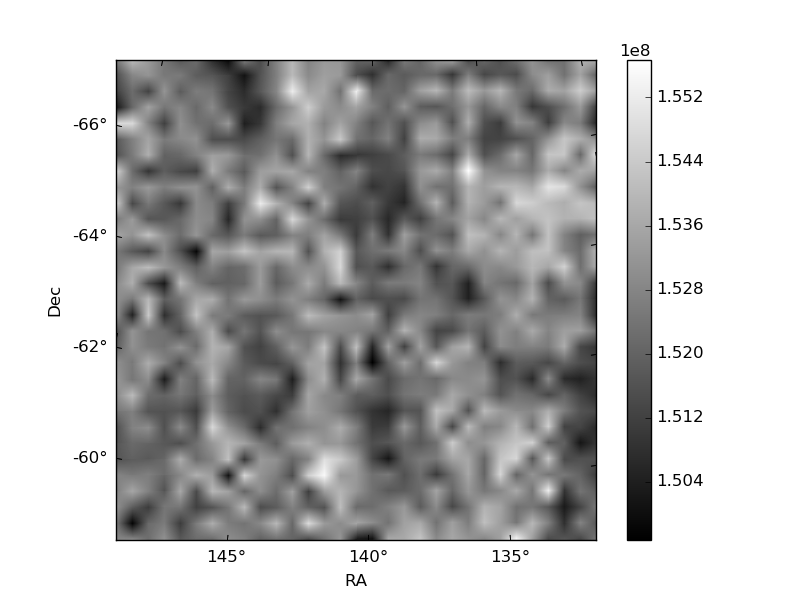
Histogram calculated using DETX and DETY for each event in the final _common_clean file
| Quadrant A | 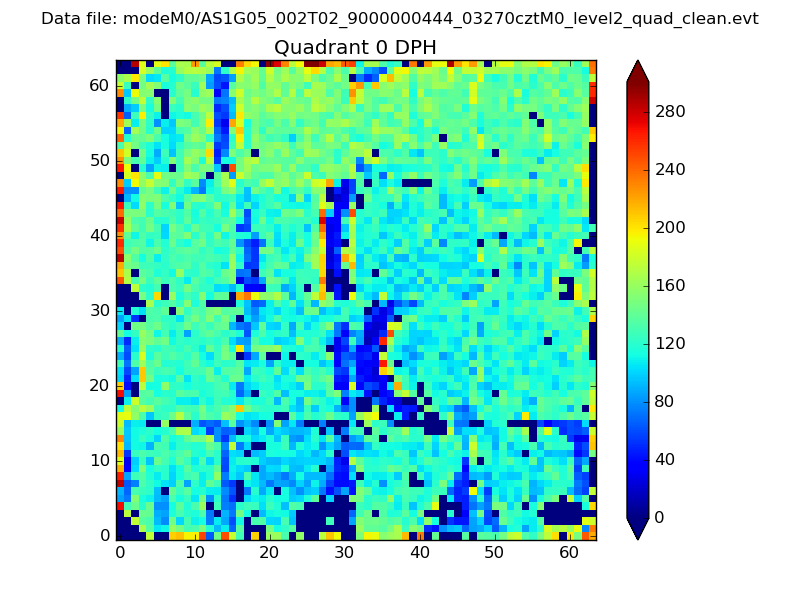 |
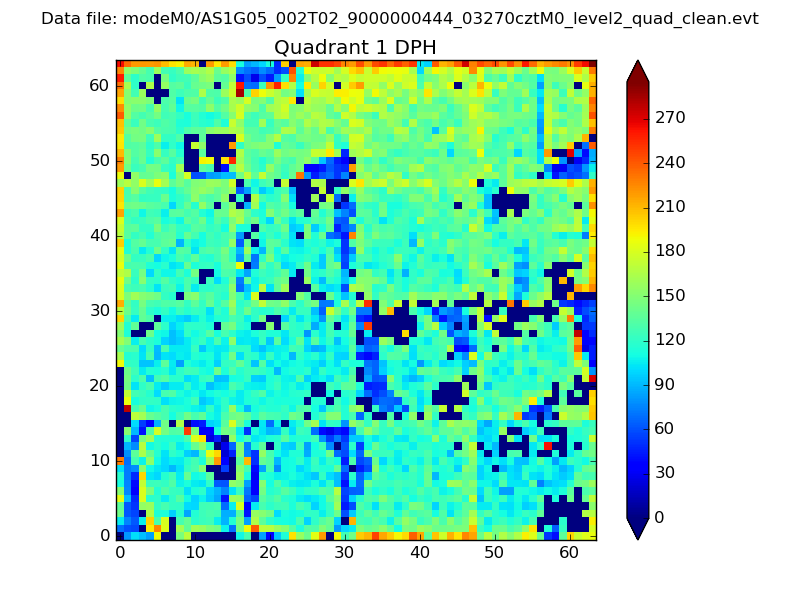 |
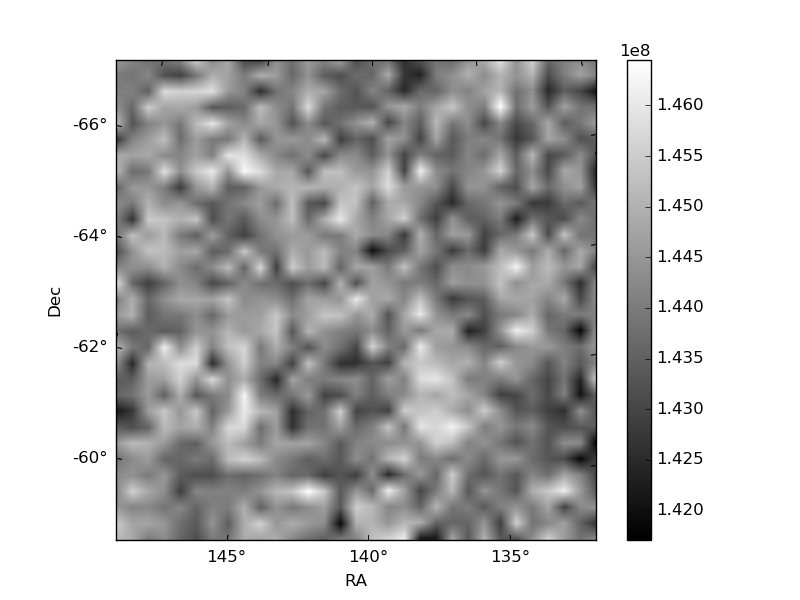
Quadrant B |
|---|---|---|---|
| Quadrant D | 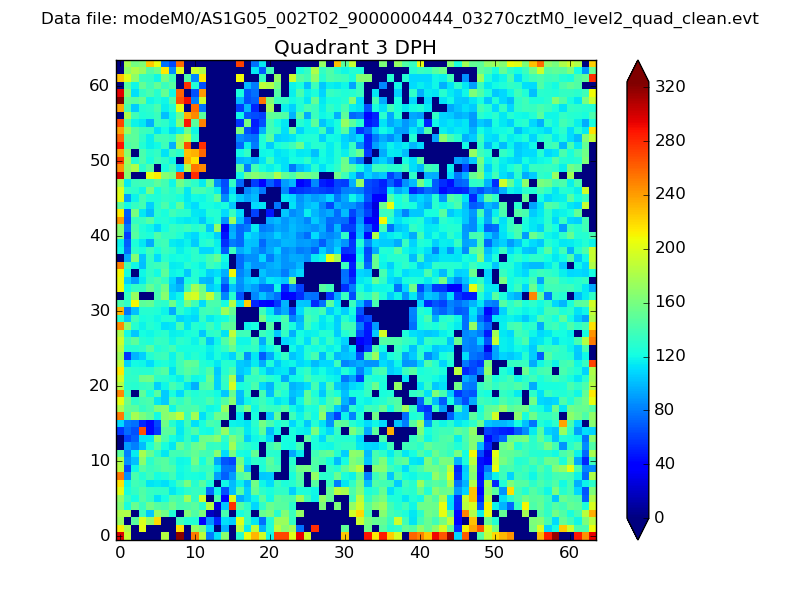 |
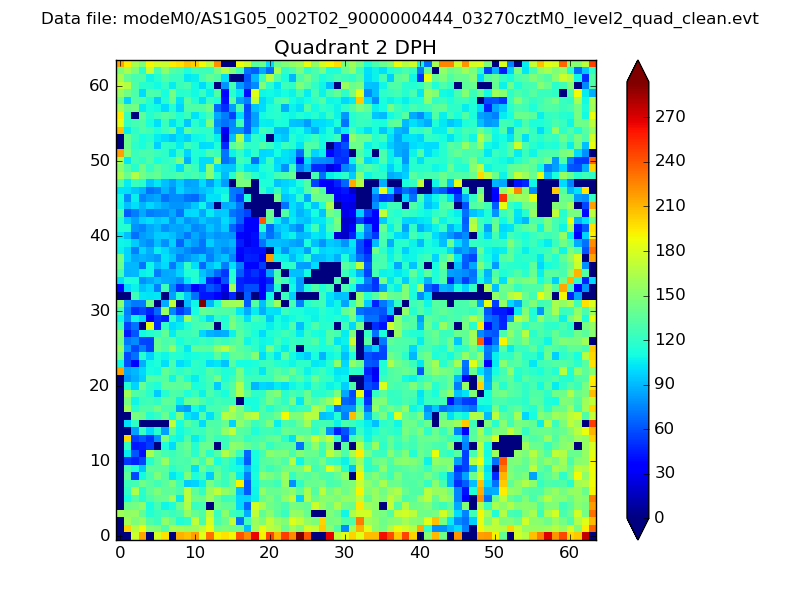 |
Quadrant C |
| Plot type | Count rate plots | Images |
|---|---|---|
| Comparison with Poisson distribution Blue bars denote a histogram of data divided into 1 sec bins. Red curve is a Poisson curve with rate = median count rate of data. |
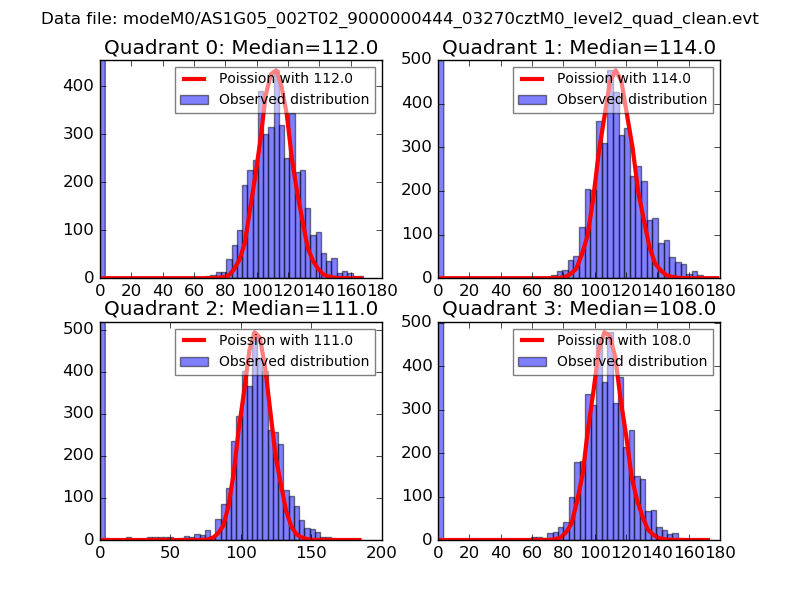 |
 |
| Quadrant-wise count rates Data is divided into 100 sec bins |
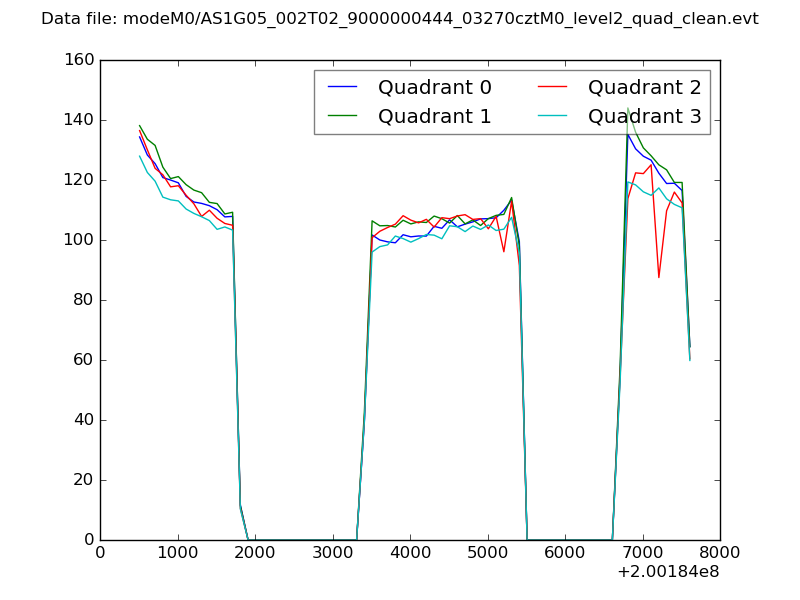 |
|
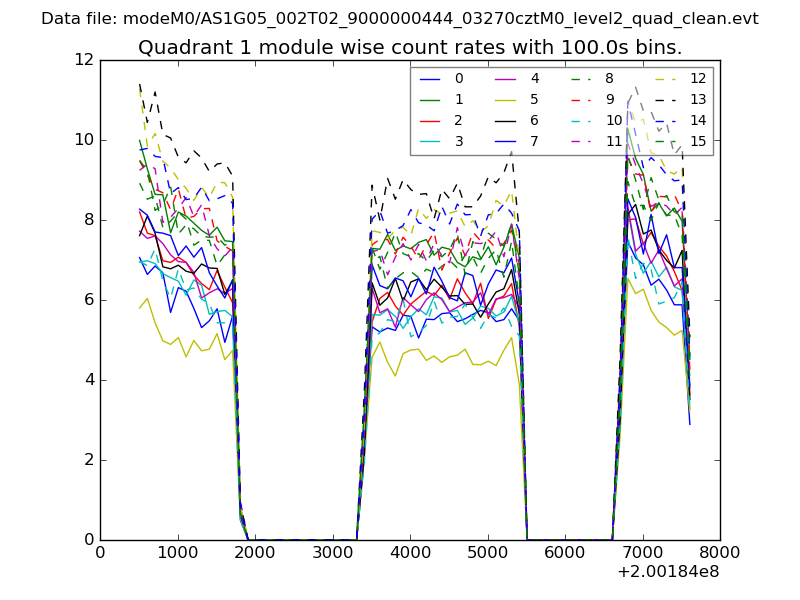
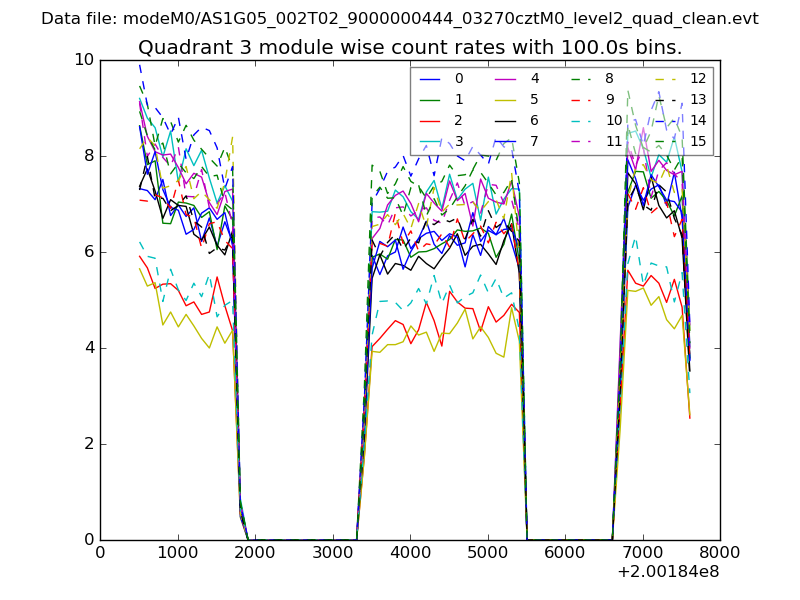
| Module-wise count rates for Quadrant A Data is divided into 100 sec bins |
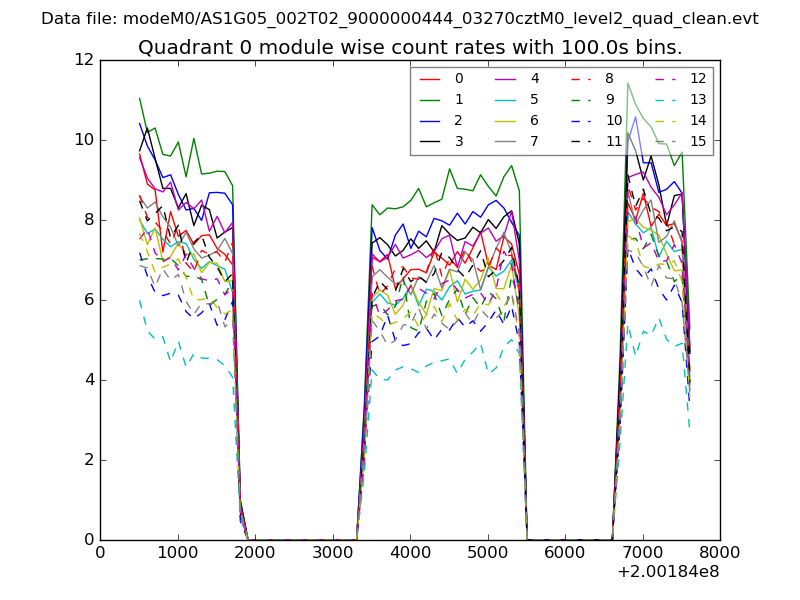 |
 |
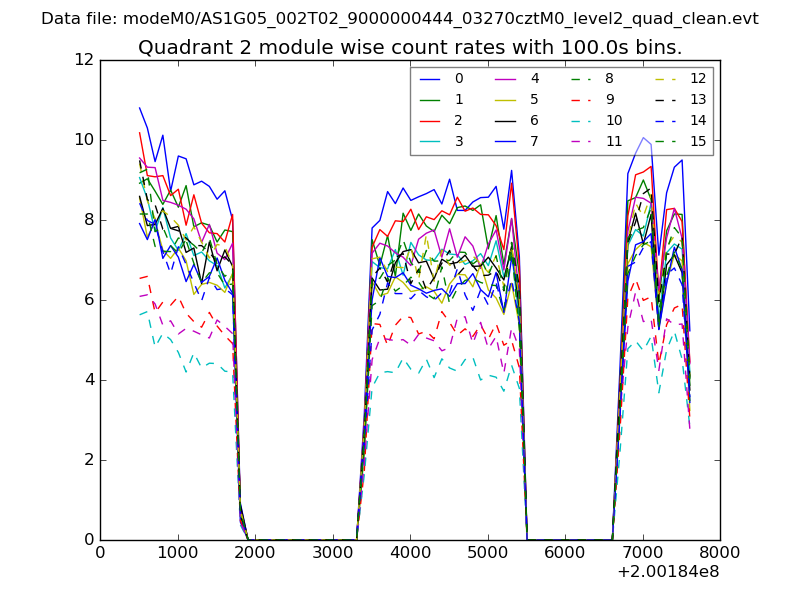
| Module-wise count rates for Quadrant B Data is divided into 100 sec bins |
 |
 |
| Module-wise count rates for Quadrant C Data is divided into 100 sec bins |
 |
 |
| Module-wise count rates for Quadrant D Data is divided into 100 sec bins |
 |
 |
| Parameter | Plot |
|---|---|
| CZT HV Monitor | 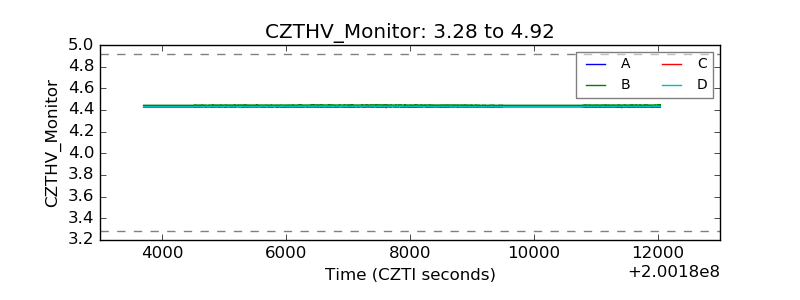 |
| D_VDD | 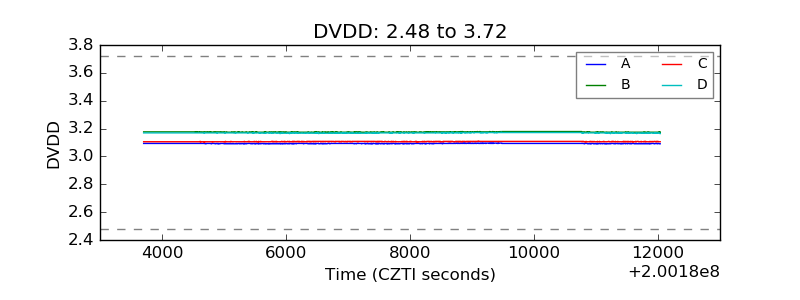 |
| Temperature 1 | 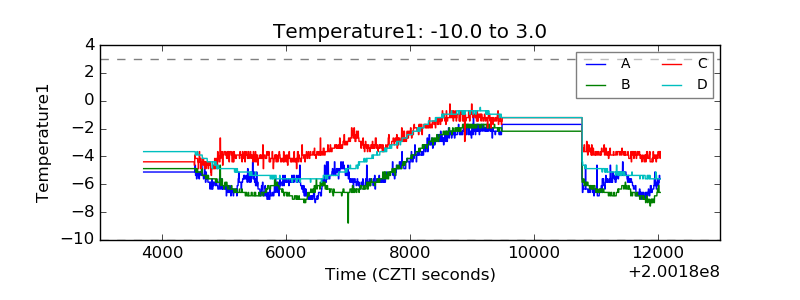 |
| Veto HV Monitor | 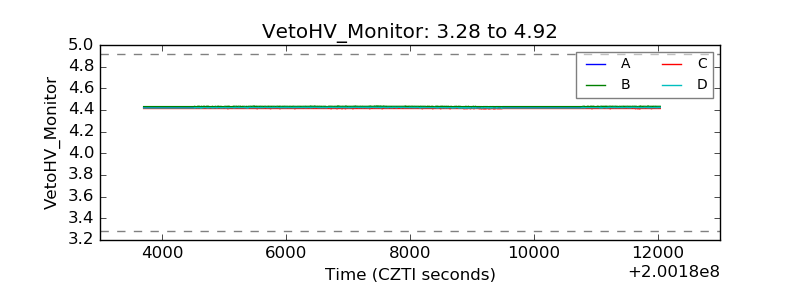 |
| Veto LLD | 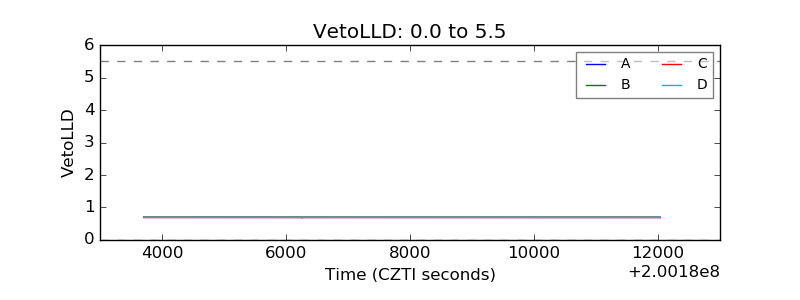 |
| Alpha Counter | 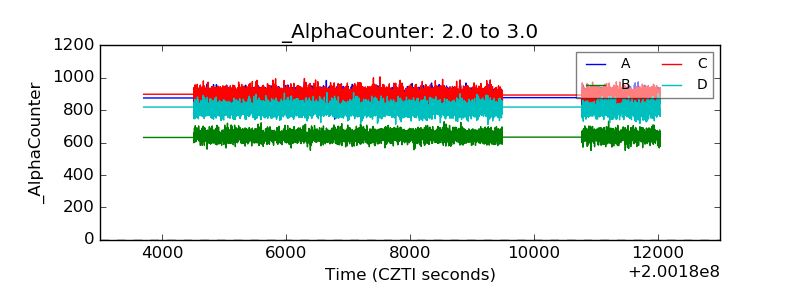 |
| _CPM_Rate | 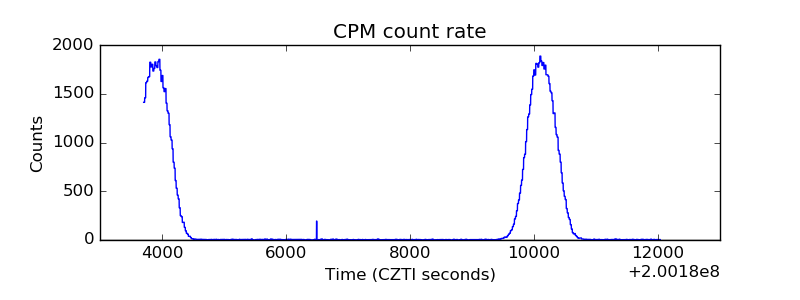 |
| CZT Counter | 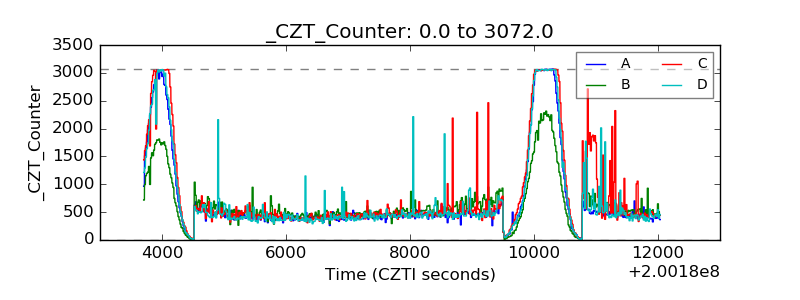 |
| +2.5 Volts monitor |  |
| +5 Volts monitor | 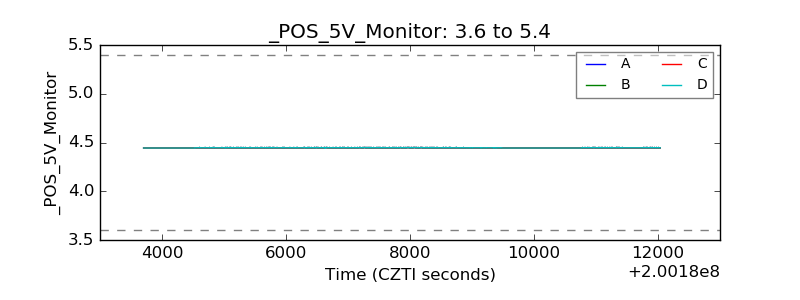 |
| _ROLL_ROT | 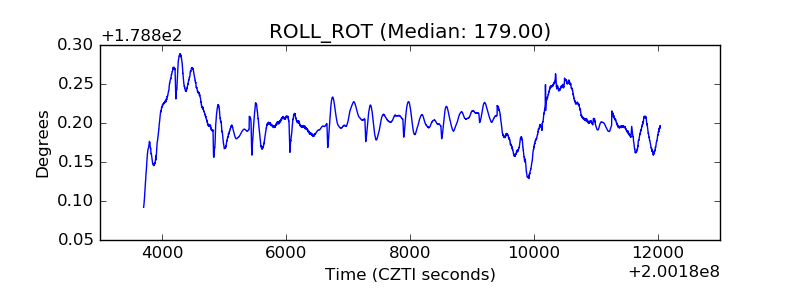 |
| _Roll_DEC | 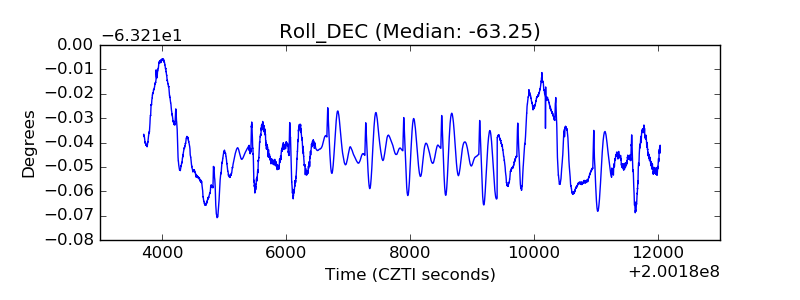 |
| _Roll_RA | 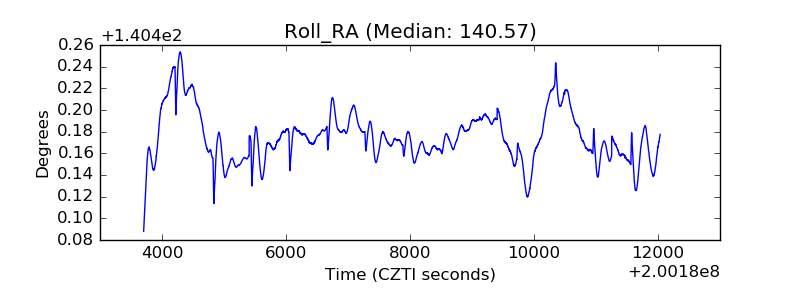 |
| Veto Counter | 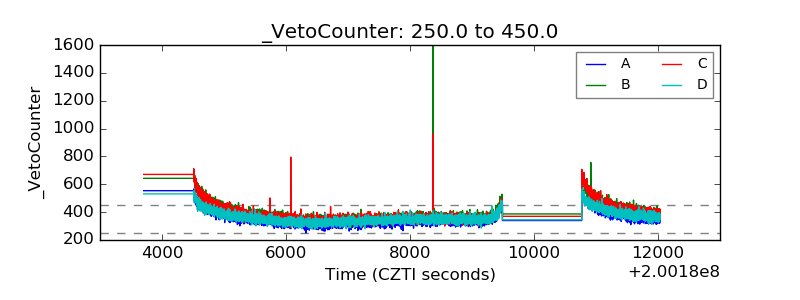 |