| Param | Original file | Final file |
|---|---|---|
| Filename | modeM0/AS1G05_002T02_9000000444_03272cztM0_level2.evt | modeM0/AS1G05_002T02_9000000444_03272cztM0_level2_quad_clean.evt |
| Size (bytes) | 468,391,680 | 64,739,520 |
| Size | 446.7 MB | 61.7 MB |
| Events in quadrant A | 3,141,008 | 374,878 |
| Events in quadrant B | 4,055,247 | 380,144 |
| Events in quadrant C | 3,302,217 | 383,285 |
| Events in quadrant D | 3,244,179 | 367,146 |
| Mode M0 | |||
|---|---|---|---|
| Quadrant | BADHDUFLAG | Total packets | Discarded packets |
| A | 0 | 13894 | 3 |
| B | 0 | 16250 | 2 |
| C | 0 | 14155 | 2 |
| D | 0 | 14311 | 2 |
| Mode M9 | |||
|---|---|---|---|
| Quadrant | BADHDUFLAG | Total packets | Discarded packets |
| A | 0 | 20 | 0 |
| B | 0 | 20 | 0 |
| C | 0 | 20 | 0 |
| D | 0 | 21 | 0 |
| Mode SS | |||
|---|---|---|---|
| Quadrant | BADHDUFLAG | Total packets | Discarded packets |
| A | 0 | 132 | 0 |
| B | 0 | 132 | 0 |
| C | 0 | 132 | 0 |
| D | 0 | 132 | 0 |
| Quadrant | Total seconds | Saturated seconds | Saturation percentage |
|---|---|---|---|
| A | 6520 | 100 | 1.533742% |
| B | 6520 | 86 | 1.319018% |
| C | 6520 | 54 | 0.828221% |
| D | 6520 | 73 | 1.119632% |
Noise dominated data is calculated using 1-second bins in cleaned event files. If a bin has >2000 counts, and if more than 50% of those come from <1% of pixels, then it is considered to be noise-dominated and hence unusable.
| Quadrant | # 1 sec bins | Bins with >0 counts | Bins with >2000 counts | High rate bins dominated by noise | Noise dominated (total time) | Noise dominated (detector-on time) | Marked lightcurve |
|---|---|---|---|---|---|---|---|
| A | 7770 | 6521 | 48 | 48 | 0.62% | 0.74% | 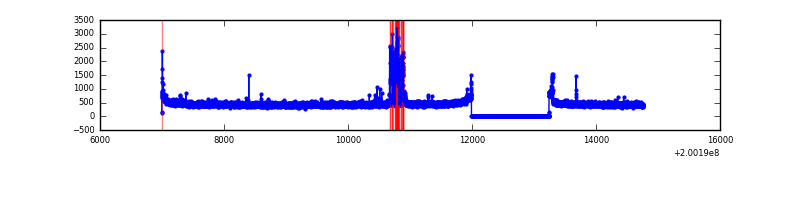 |
| B | 7770 | 6521 | 7 | 7 | 0.09% | 0.11% | 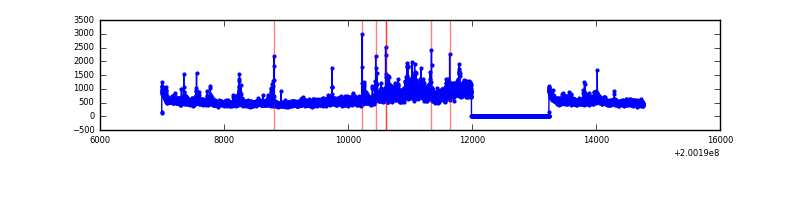 |
| C | 7770 | 6521 | 25 | 25 | 0.32% | 0.38% | 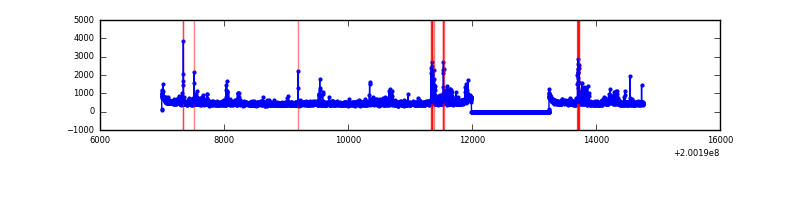 |
| D | 7770 | 6521 | 49 | 49 | 0.63% | 0.75% | 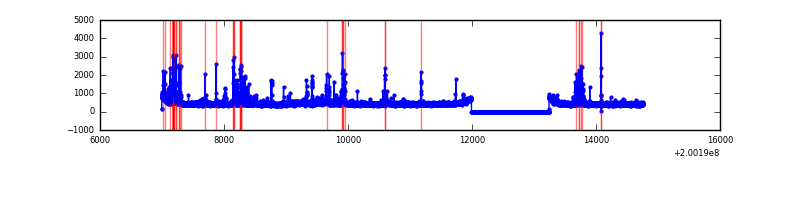 |
Top three noisy pixels from each quadrant. If the there are fewer than three noisy pixels in the level2.evt file, extra rows are filled as -1
| Pixel properties | Quadrant properties | ||||||
|---|---|---|---|---|---|---|---|
| Quadrant | DetID | PixID | Counts | Sigma | Mean | Median | Sigma |
| A | 0 | 50 | 209130 | 1368.48 | 753 | 737 | 152.3 |
| A | 0 | 118 | 25461 | 162.36 | 753 | 737 | 152.3 |
| A | 0 | 226 | 9780 | 59.38 | 753 | 737 | 152.3 |
| B | 15 | 204 | 947885 | 6442.0 | 774 | 755 | 147.0 |
| B | 2 | 249 | 58667 | 393.89 | 774 | 755 | 147.0 |
| B | 5 | 200 | 48381 | 323.93 | 774 | 755 | 147.0 |
| C | 2 | 53 | 111280 | 648.06 | 744 | 746 | 170.6 |
| C | 14 | 223 | 92304 | 536.8 | 744 | 746 | 170.6 |
| C | 1 | 16 | 64710 | 375.02 | 744 | 746 | 170.6 |
| D | 13 | 223 | 178771 | 1020.89 | 732 | 711 | 174.4 |
| D | 13 | 239 | 144297 | 823.24 | 732 | 711 | 174.4 |
| D | 2 | 209 | 54953 | 310.99 | 732 | 711 | 174.4 |
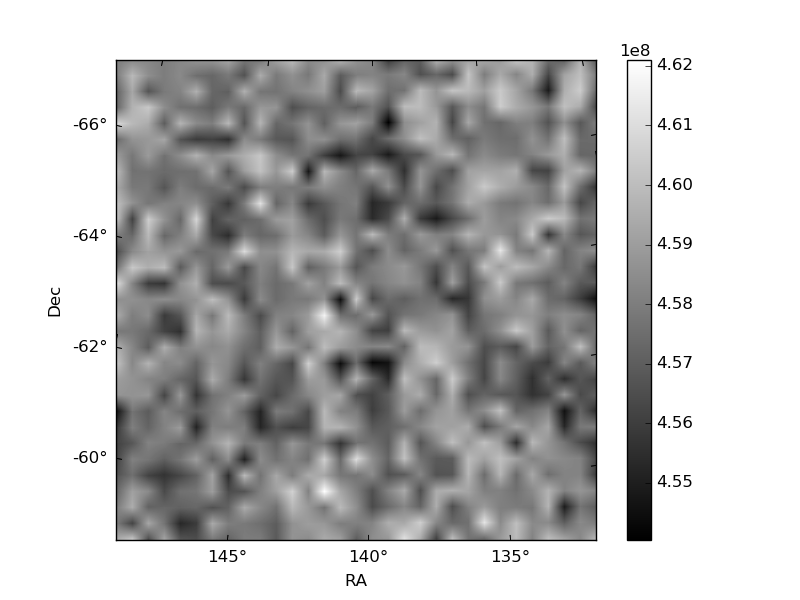
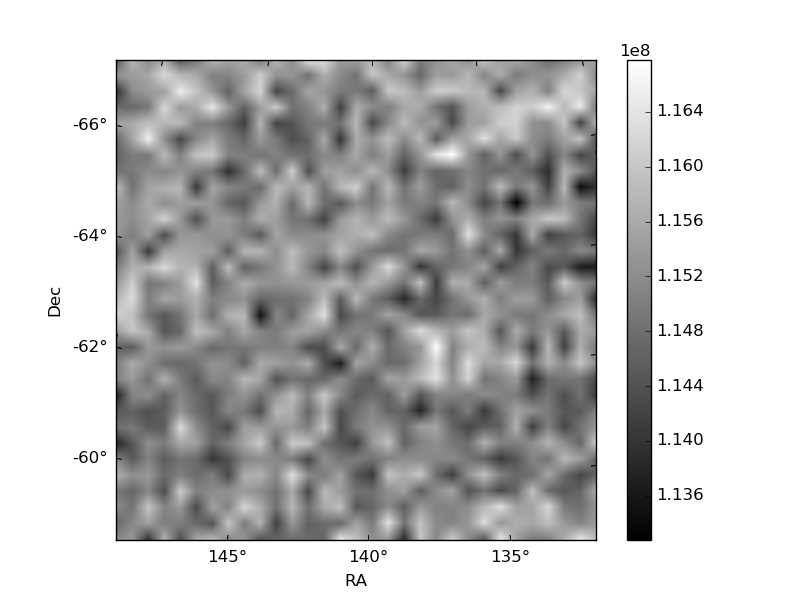
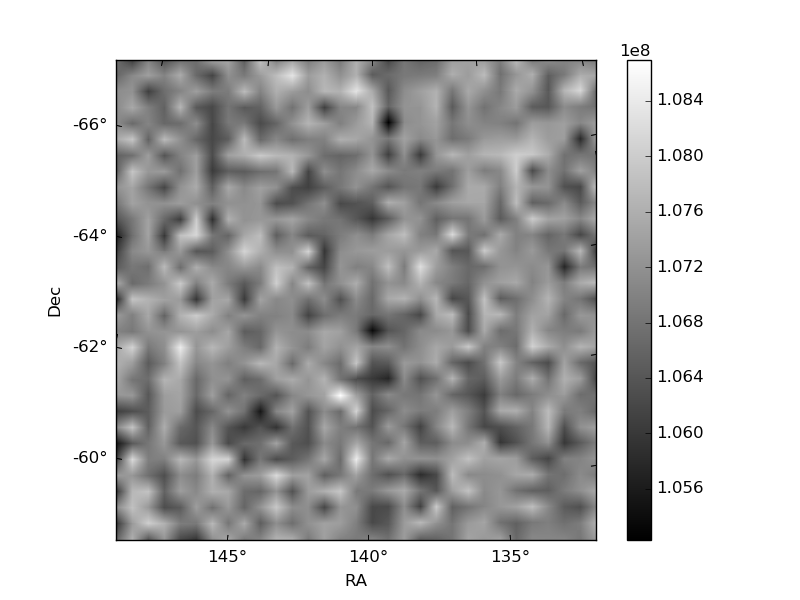
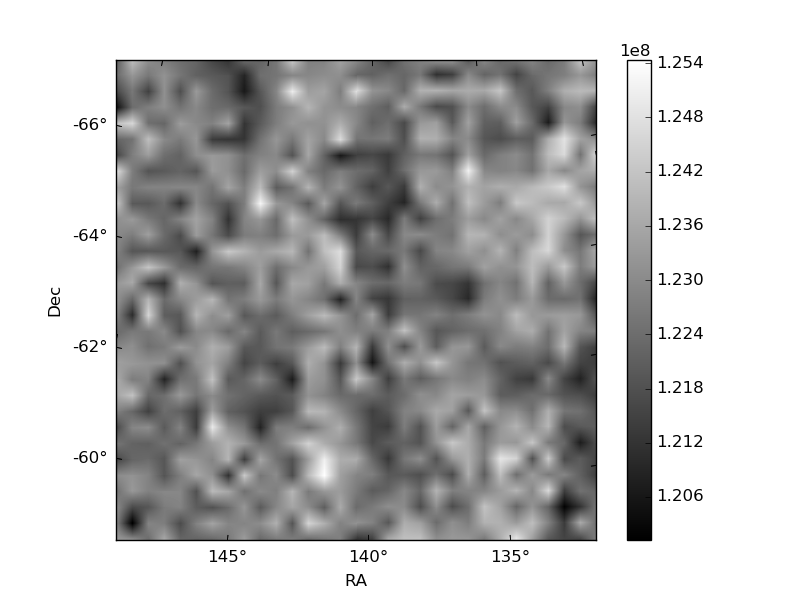
Histogram calculated using DETX and DETY for each event in the final _common_clean file
| Quadrant A | 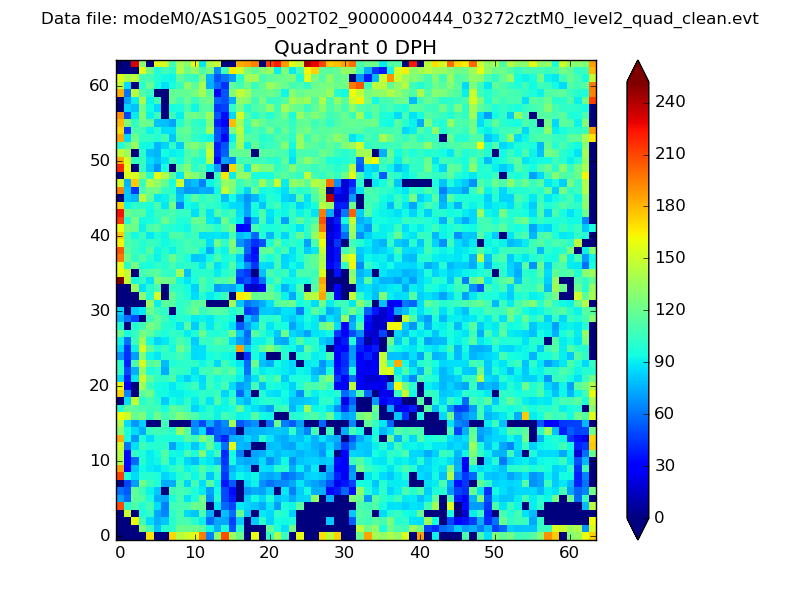 |
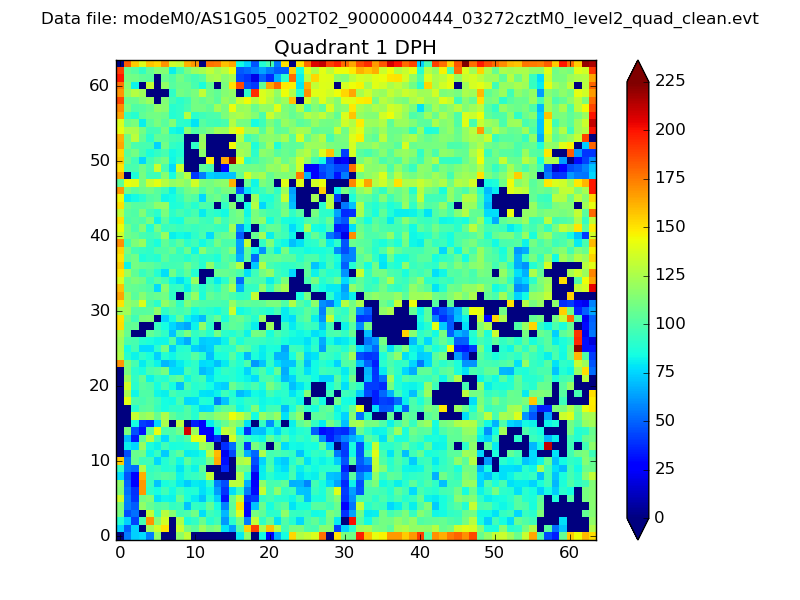 |
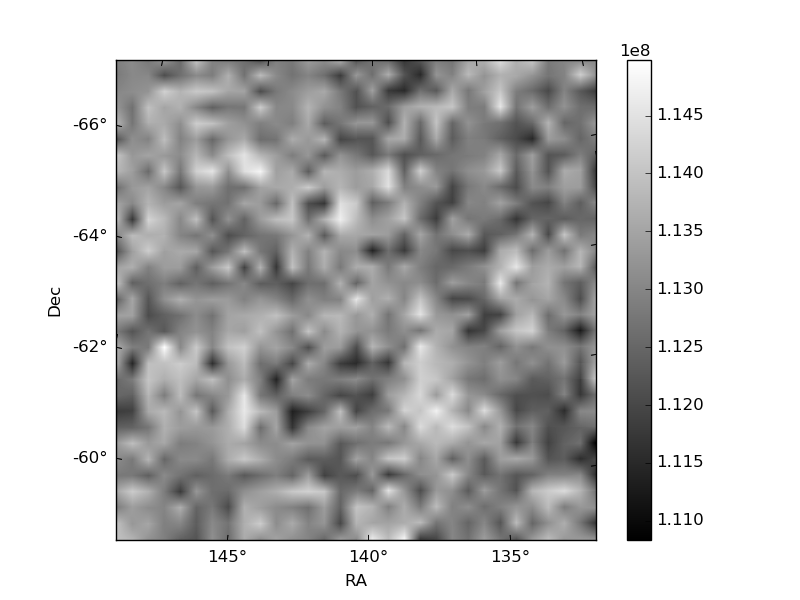
Quadrant B |
|---|---|---|---|
| Quadrant D | 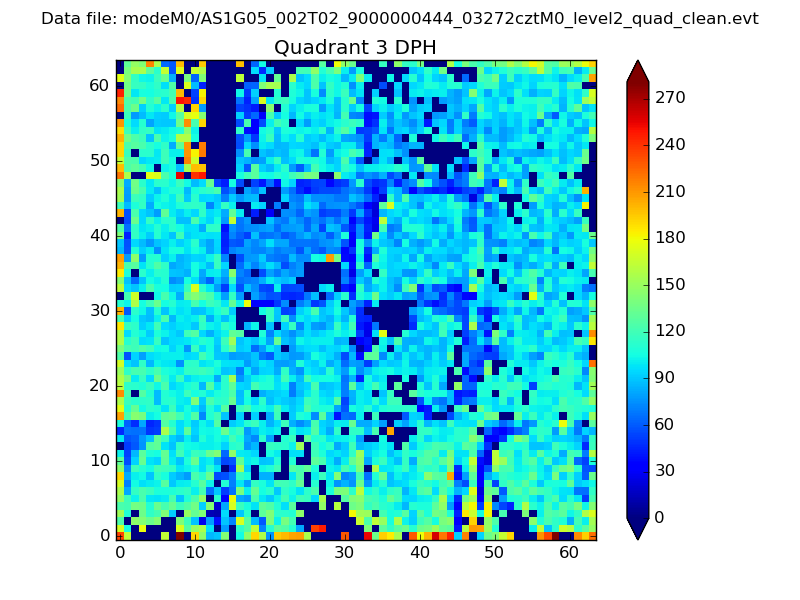 |
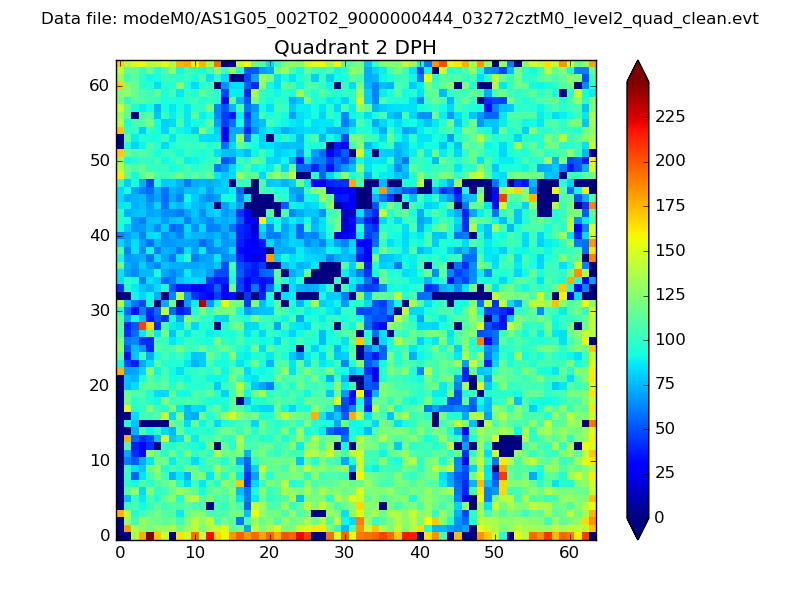 |
Quadrant C |
| Plot type | Count rate plots | Images |
|---|---|---|
| Comparison with Poisson distribution Blue bars denote a histogram of data divided into 1 sec bins. Red curve is a Poisson curve with rate = median count rate of data. |
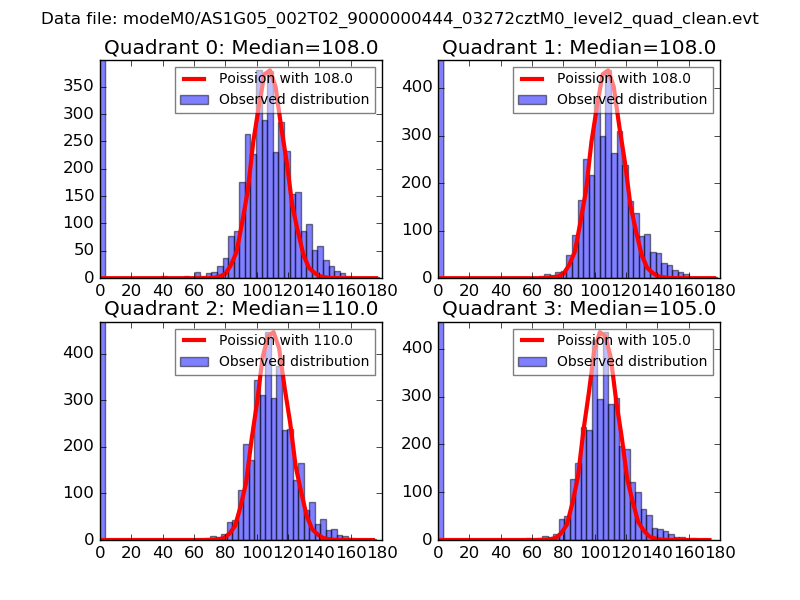 |
 |
| Quadrant-wise count rates Data is divided into 100 sec bins |
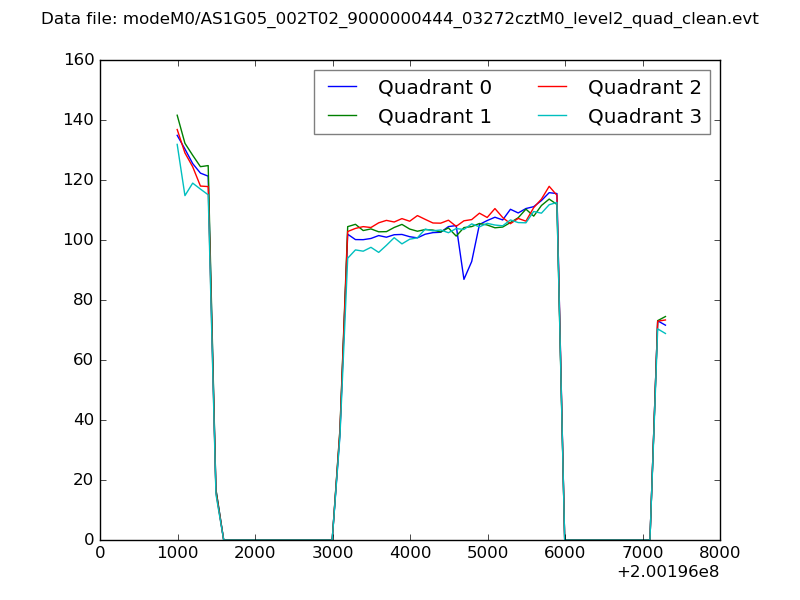 |
|
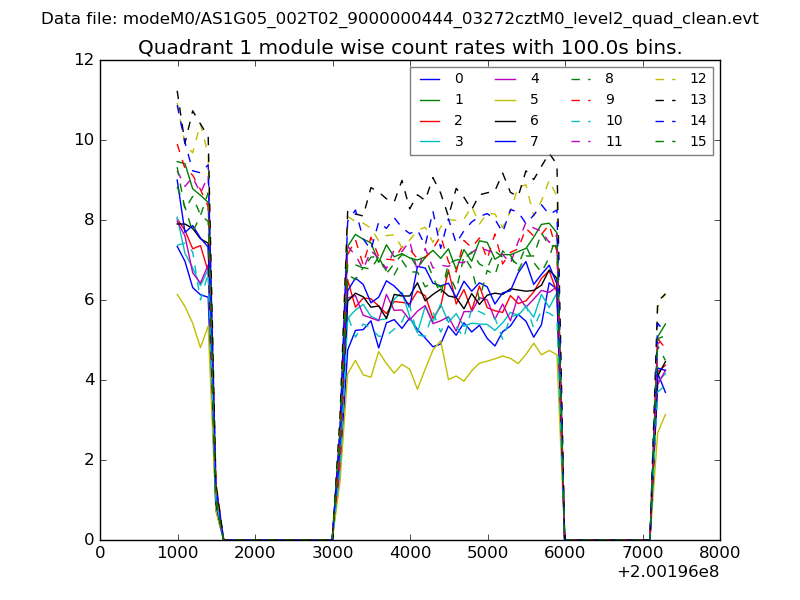
| Module-wise count rates for Quadrant A Data is divided into 100 sec bins |
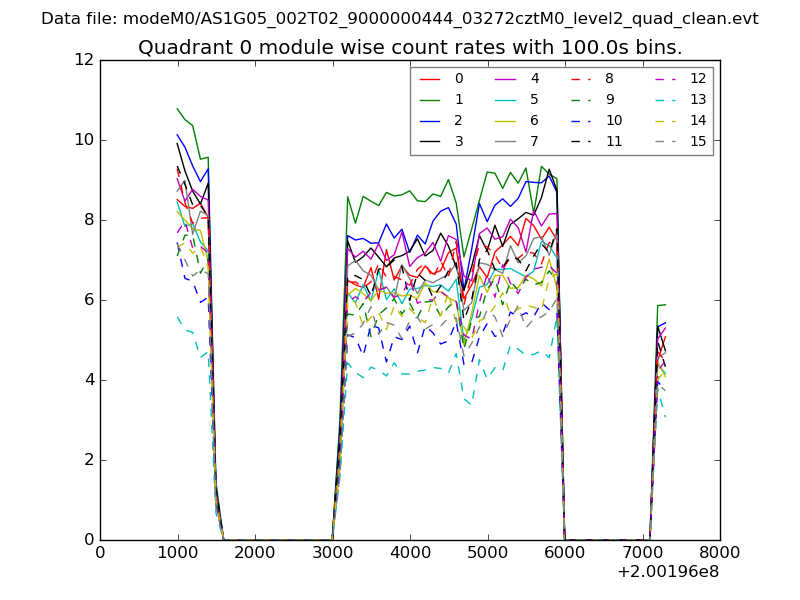 |
 |
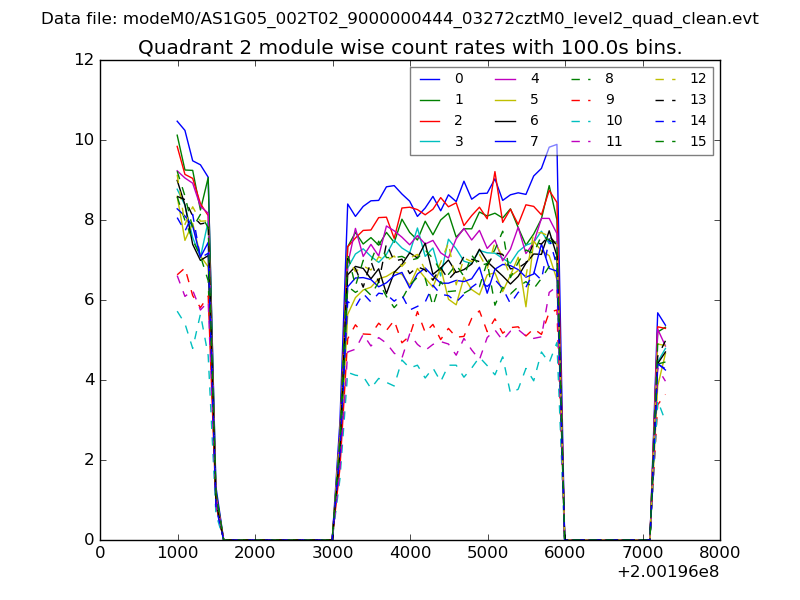
| Module-wise count rates for Quadrant B Data is divided into 100 sec bins |
 |
 |
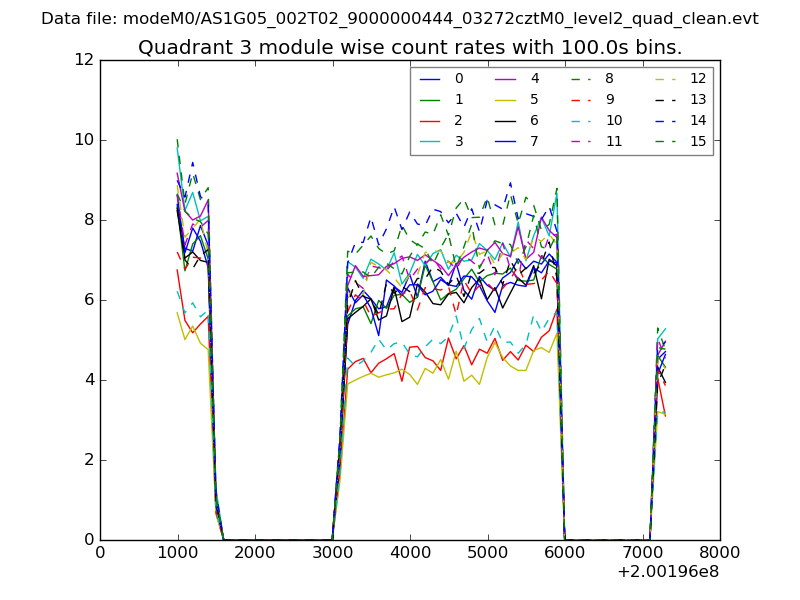
| Module-wise count rates for Quadrant C Data is divided into 100 sec bins |
 |
 |
| Module-wise count rates for Quadrant D Data is divided into 100 sec bins |
 |
 |
| Parameter | Plot |
|---|---|
| CZT HV Monitor | 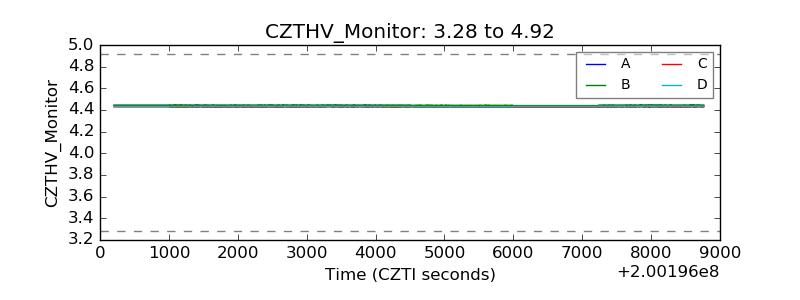 |
| D_VDD | 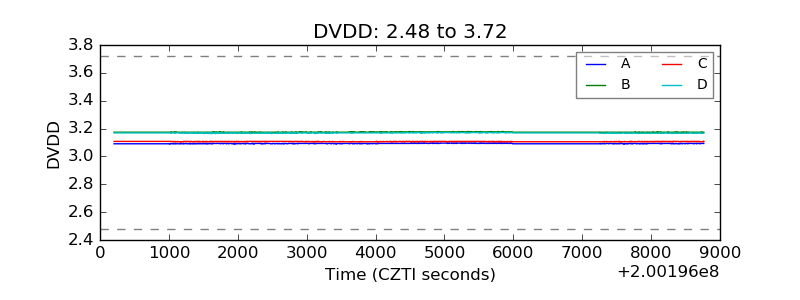 |
| Temperature 1 | 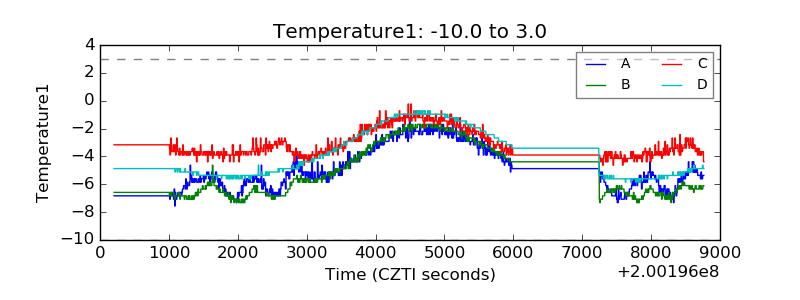 |
| Veto HV Monitor | 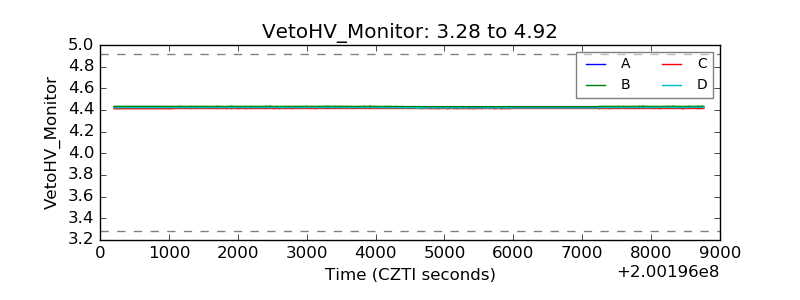 |
| Veto LLD | 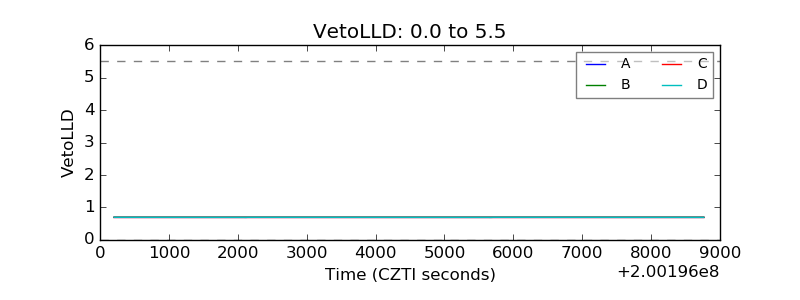 |
| Alpha Counter | 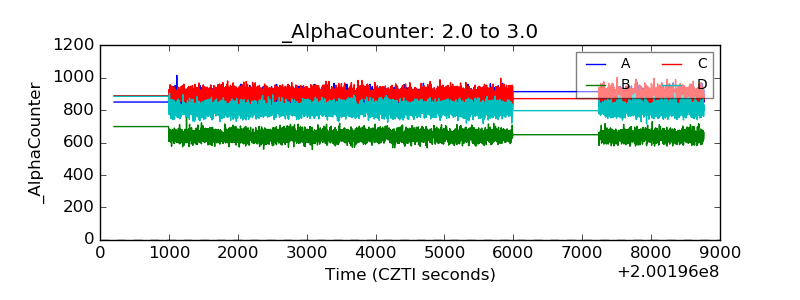 |
| _CPM_Rate | 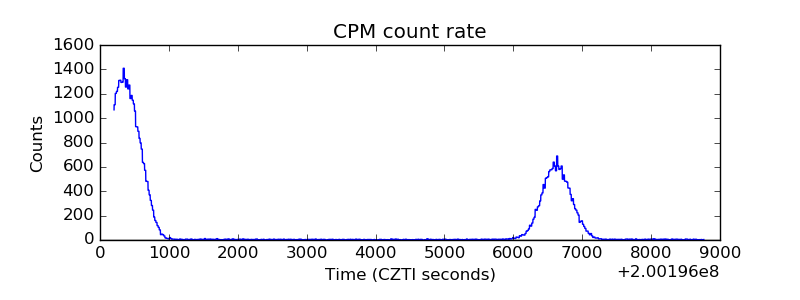 |
| CZT Counter | 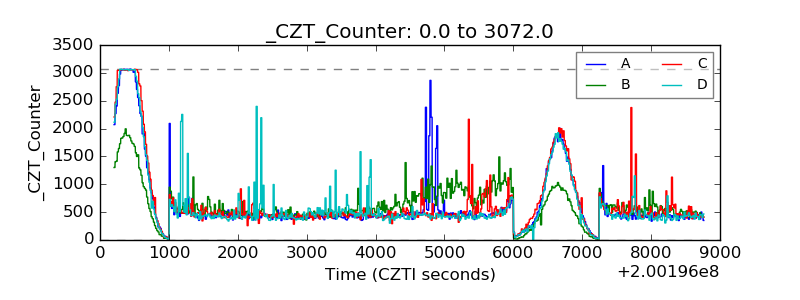 |
| +2.5 Volts monitor |  |
| +5 Volts monitor |  |
| _ROLL_ROT | 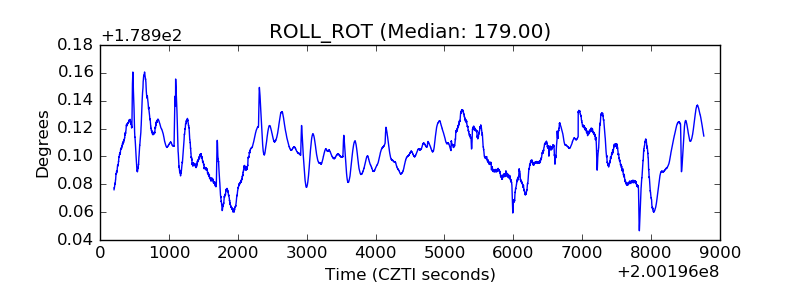 |
| _Roll_DEC | 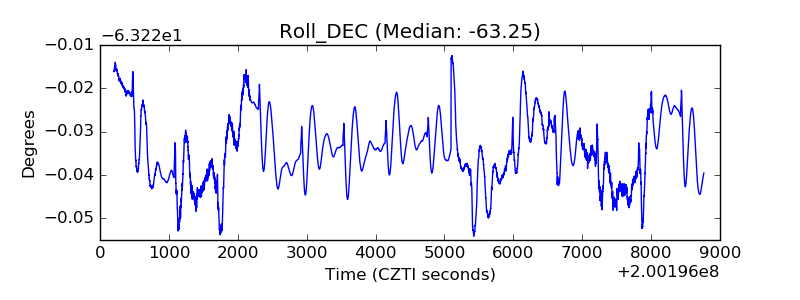 |
| _Roll_RA | 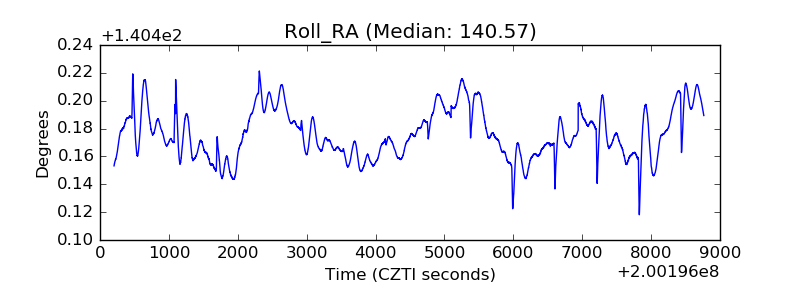 |
| Veto Counter | 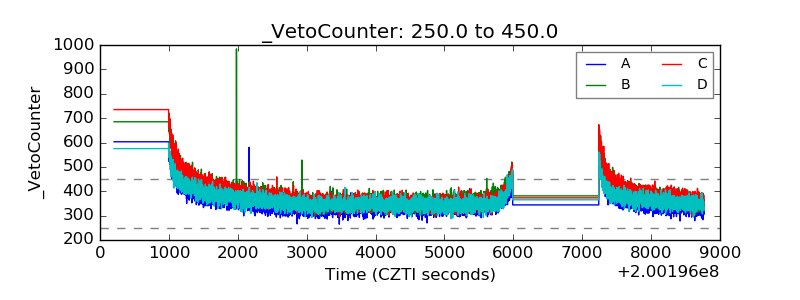 |