| Param | Original file | Final file |
|---|---|---|
| Filename | modeM0/AS1G05_002T02_9000000444_03273cztM0_level2.evt | modeM0/AS1G05_002T02_9000000444_03273cztM0_level2_quad_clean.evt |
| Size (bytes) | 497,882,880 | 73,321,920 |
| Size | 474.8 MB | 69.9 MB |
| Events in quadrant A | 3,467,829 | 432,132 |
| Events in quadrant B | 4,253,355 | 431,642 |
| Events in quadrant C | 3,590,774 | 437,713 |
| Events in quadrant D | 3,284,314 | 424,227 |
| Mode M0 | |||
|---|---|---|---|
| Quadrant | BADHDUFLAG | Total packets | Discarded packets |
| A | 0 | 15360 | 3 |
| B | 0 | 17372 | 2 |
| C | 0 | 15440 | 2 |
| D | 0 | 15065 | 2 |
| Mode M9 | |||
|---|---|---|---|
| Quadrant | BADHDUFLAG | Total packets | Discarded packets |
| A | 0 | 24 | 0 |
| B | 0 | 24 | 0 |
| C | 0 | 24 | 0 |
| D | 0 | 24 | 0 |
| Mode SS | |||
|---|---|---|---|
| Quadrant | BADHDUFLAG | Total packets | Discarded packets |
| A | 0 | 144 | 0 |
| B | 0 | 144 | 0 |
| C | 0 | 144 | 0 |
| D | 0 | 144 | 0 |
| Quadrant | Total seconds | Saturated seconds | Saturation percentage |
|---|---|---|---|
| A | 7104 | 156 | 2.195946% |
| B | 7104 | 182 | 2.561937% |
| C | 7104 | 129 | 1.815878% |
| D | 7104 | 96 | 1.351351% |
Noise dominated data is calculated using 1-second bins in cleaned event files. If a bin has >2000 counts, and if more than 50% of those come from <1% of pixels, then it is considered to be noise-dominated and hence unusable.
| Quadrant | # 1 sec bins | Bins with >0 counts | Bins with >2000 counts | High rate bins dominated by noise | Noise dominated (total time) | Noise dominated (detector-on time) | Marked lightcurve |
|---|---|---|---|---|---|---|---|
| A | 9379 | 7106 | 42 | 42 | 0.45% | 0.59% | 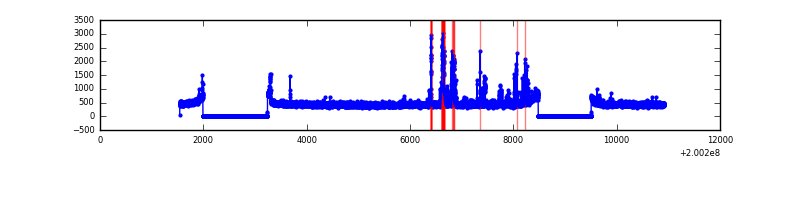 |
| B | 9379 | 7106 | 18 | 18 | 0.19% | 0.25% | 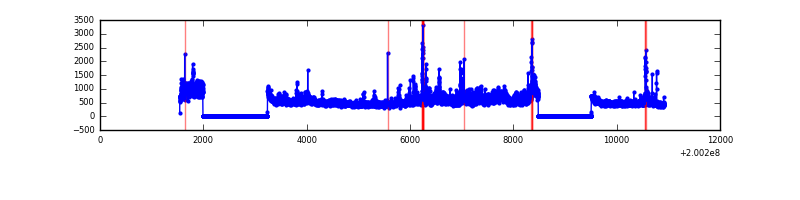 |
| C | 9379 | 7106 | 22 | 22 | 0.23% | 0.31% | 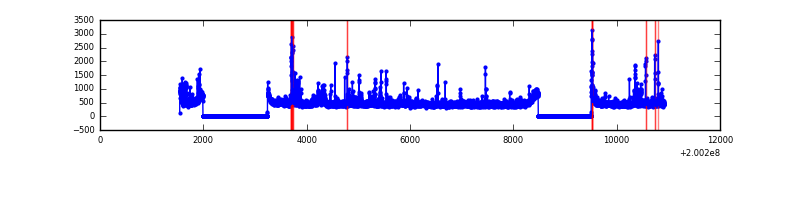 |
| D | 9379 | 7106 | 15 | 15 | 0.16% | 0.21% | 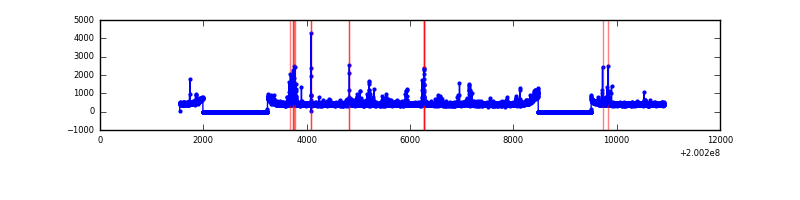 |
Top three noisy pixels from each quadrant. If the there are fewer than three noisy pixels in the level2.evt file, extra rows are filled as -1
| Pixel properties | Quadrant properties | ||||||
|---|---|---|---|---|---|---|---|
| Quadrant | DetID | PixID | Counts | Sigma | Mean | Median | Sigma |
| A | 0 | 50 | 185852 | 1107.1 | 821 | 802 | 167.1 |
| A | 0 | 118 | 63464 | 374.89 | 821 | 802 | 167.1 |
| A | 14 | 249 | 44809 | 263.28 | 821 | 802 | 167.1 |
| B | 15 | 204 | 819718 | 5188.61 | 836 | 816 | 157.8 |
| B | 2 | 249 | 139298 | 877.43 | 836 | 816 | 157.8 |
| B | 5 | 200 | 27044 | 166.18 | 836 | 816 | 157.8 |
| C | 14 | 48 | 168252 | 907.75 | 804 | 805 | 184.5 |
| C | 2 | 53 | 83464 | 448.1 | 804 | 805 | 184.5 |
| C | 1 | 16 | 70940 | 380.21 | 804 | 805 | 184.5 |
| D | 13 | 239 | 74029 | 382.25 | 799 | 775 | 191.6 |
| D | 13 | 223 | 73792 | 381.01 | 799 | 775 | 191.6 |
| D | 5 | 233 | 33176 | 169.07 | 799 | 775 | 191.6 |
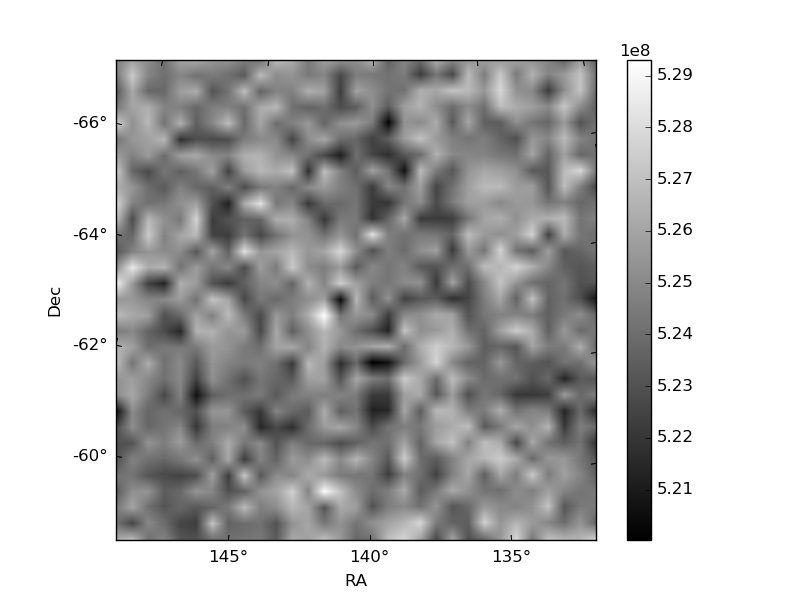
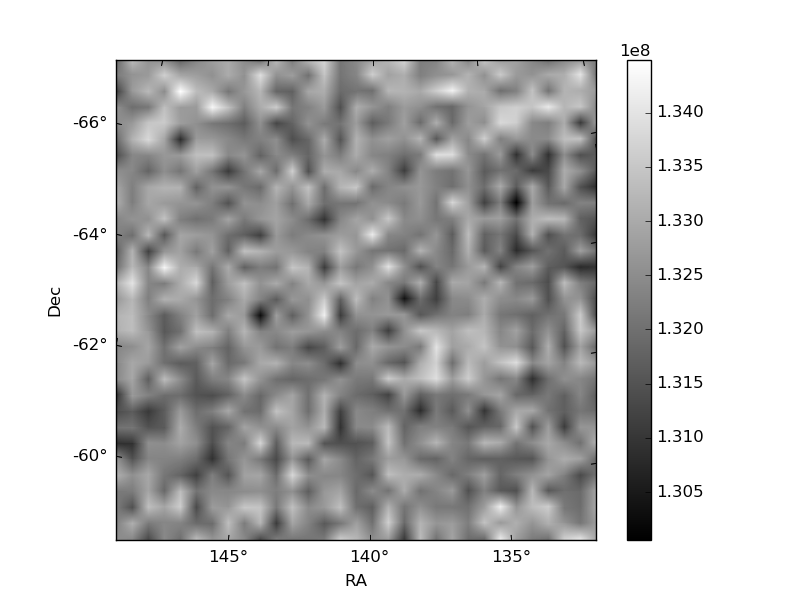
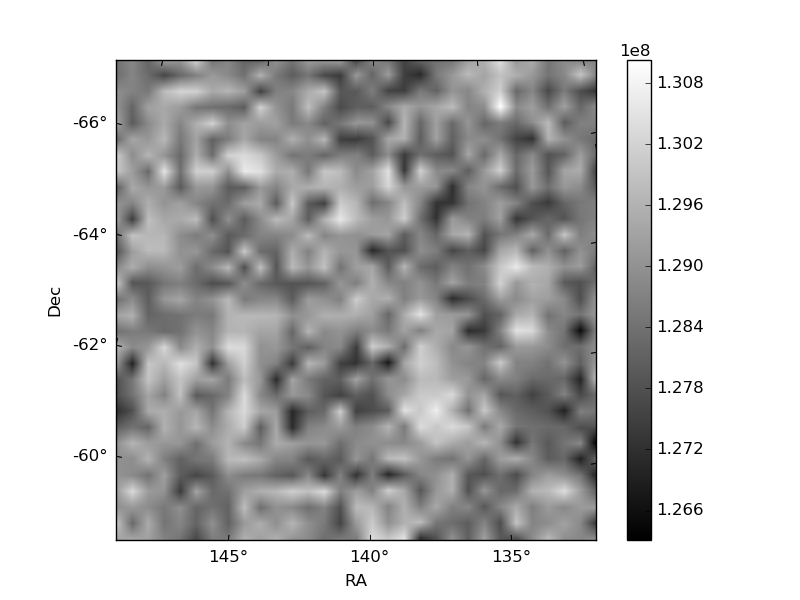
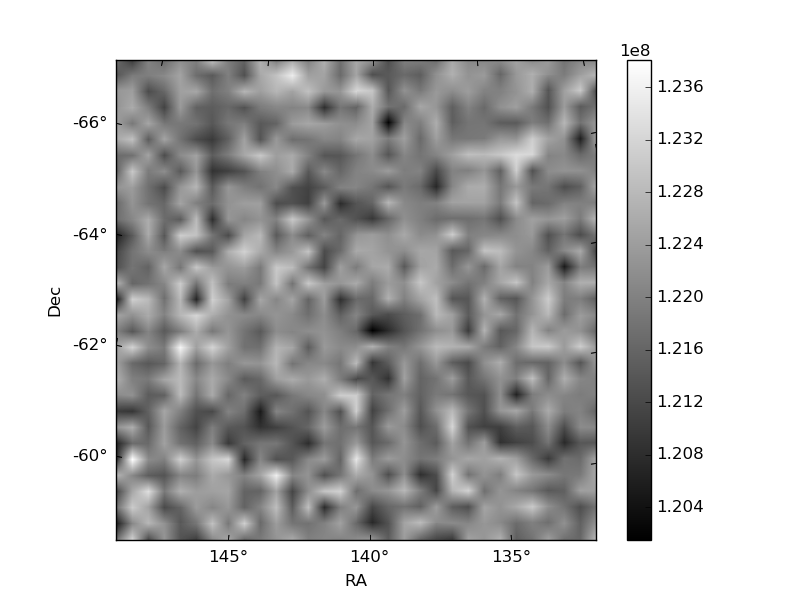
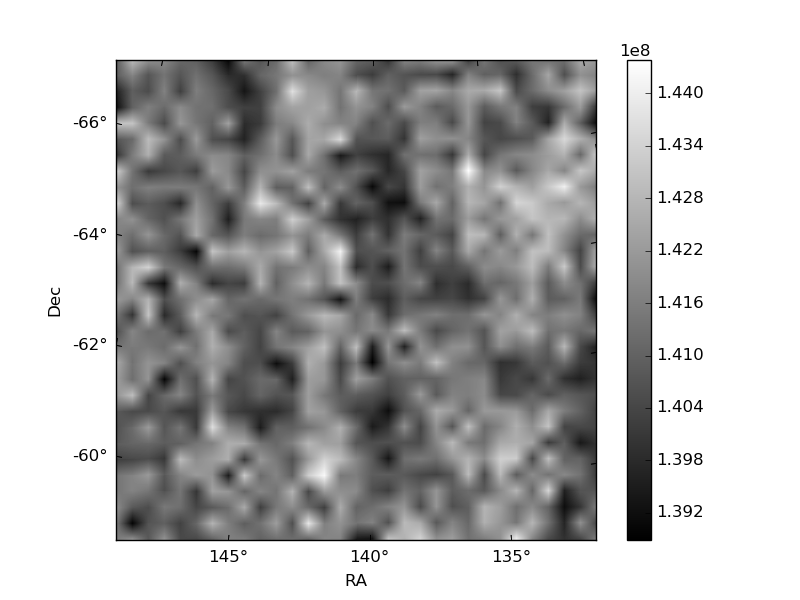
Histogram calculated using DETX and DETY for each event in the final _common_clean file
| Quadrant A | 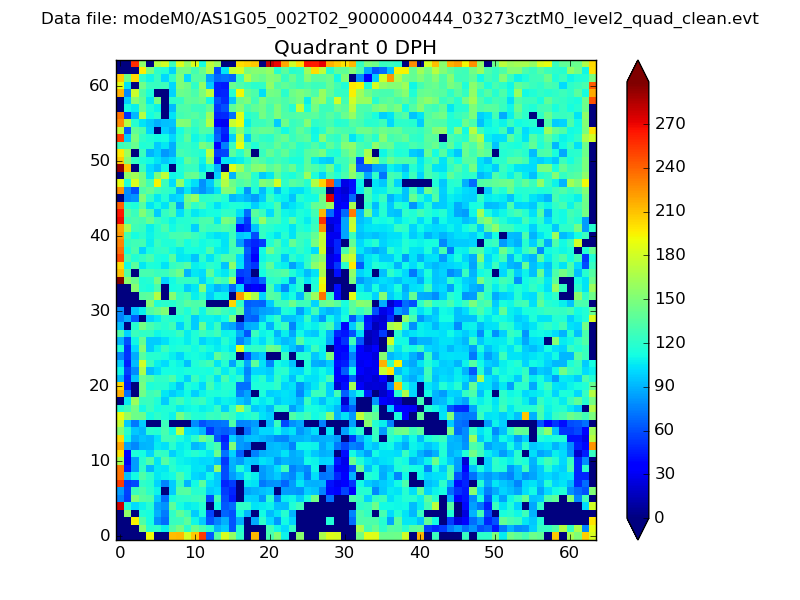 |
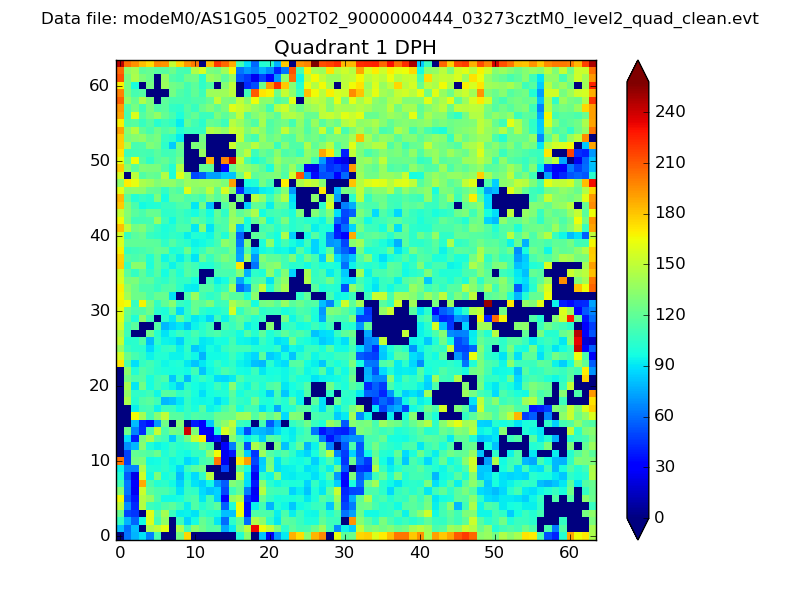 |
Quadrant B |
|---|---|---|---|
| Quadrant D | 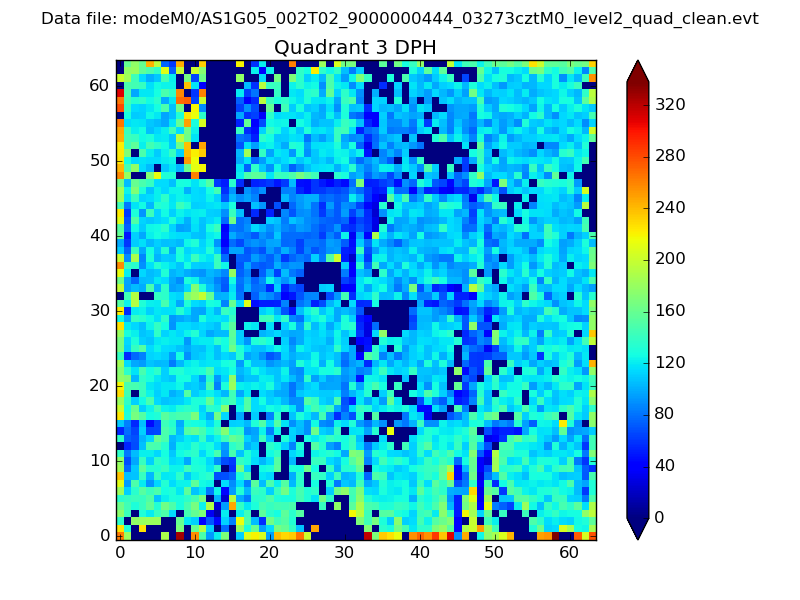 |
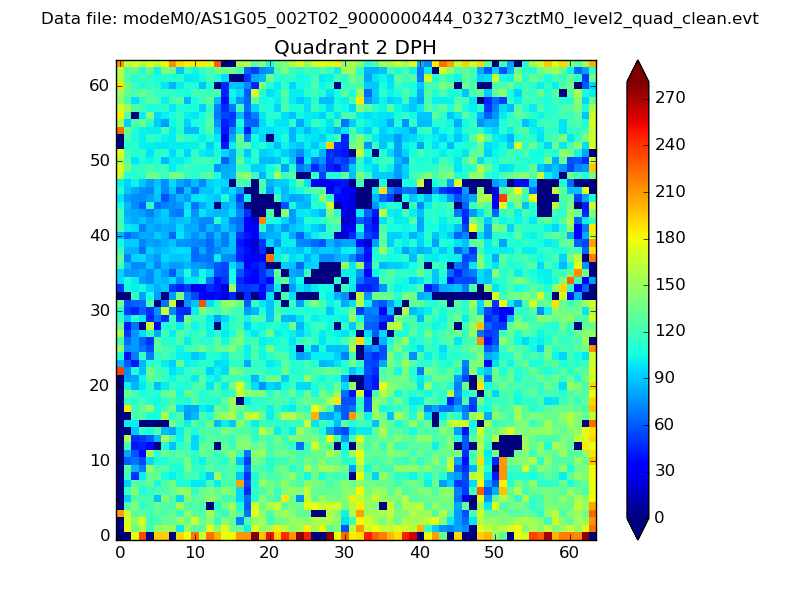 |
Quadrant C |
| Plot type | Count rate plots | Images |
|---|---|---|
| Comparison with Poisson distribution Blue bars denote a histogram of data divided into 1 sec bins. Red curve is a Poisson curve with rate = median count rate of data. |
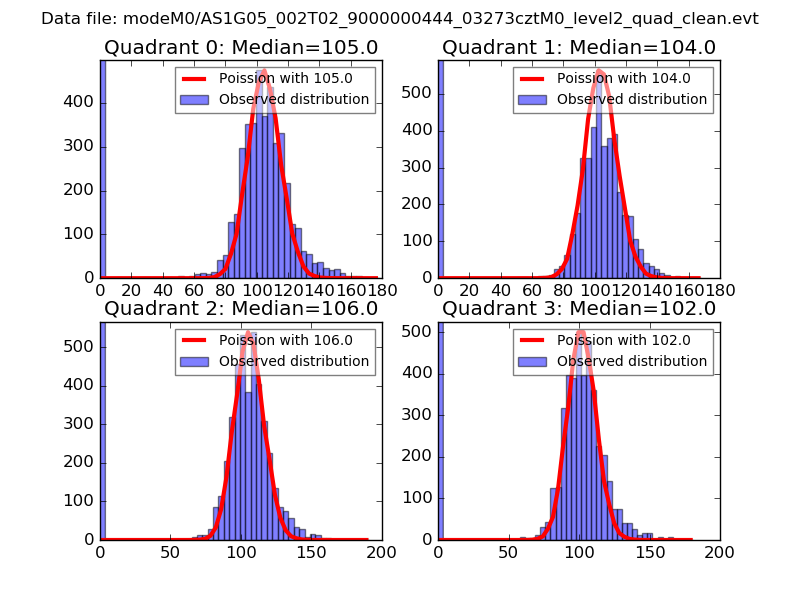 |
 |
| Quadrant-wise count rates Data is divided into 100 sec bins |
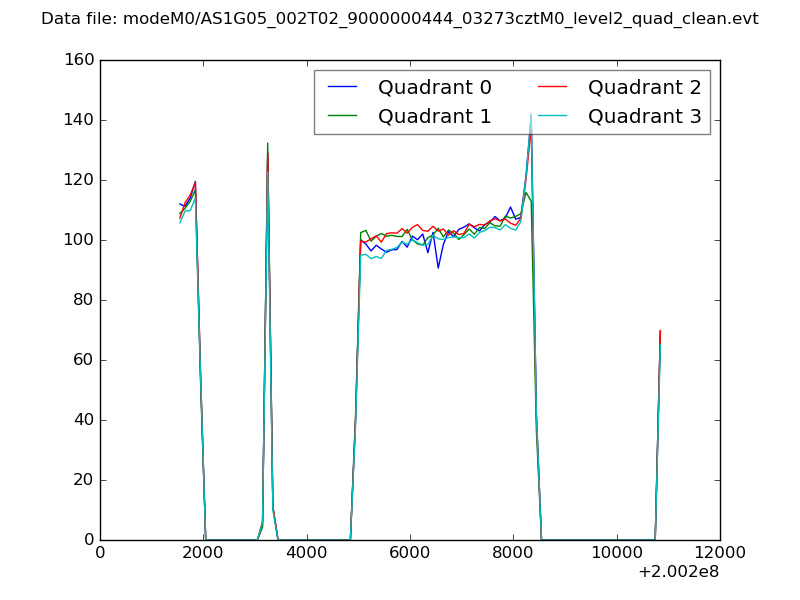 |
|
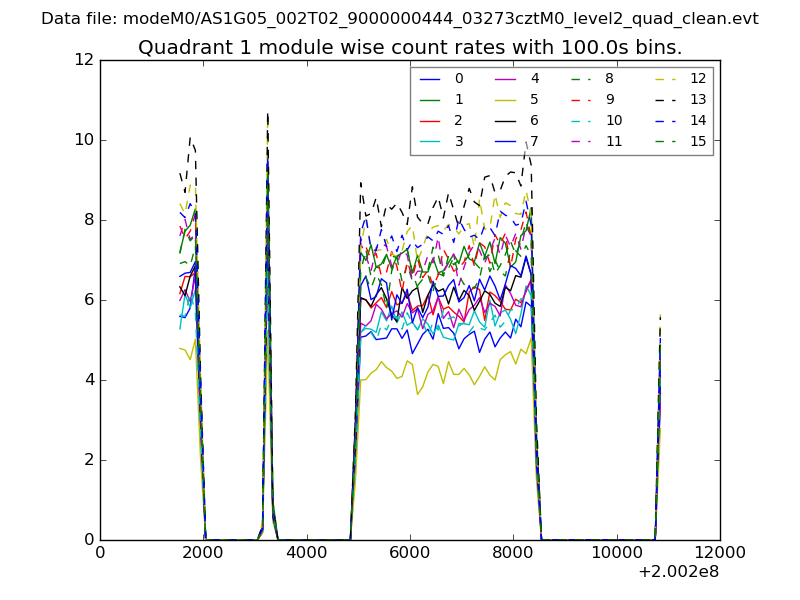
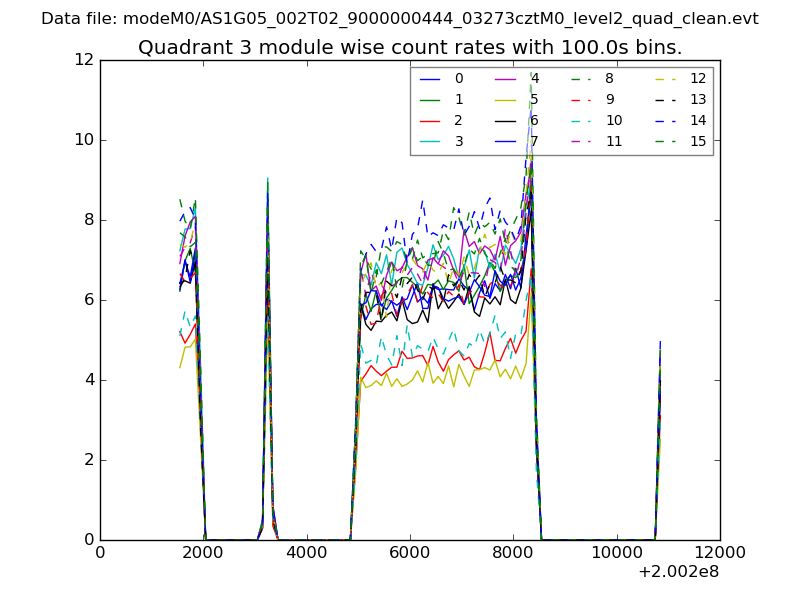
| Module-wise count rates for Quadrant A Data is divided into 100 sec bins |
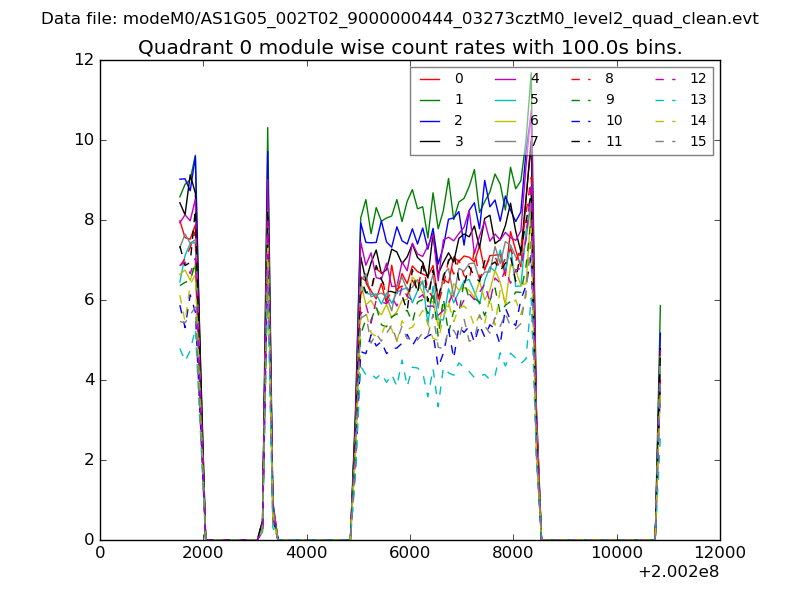 |
 |
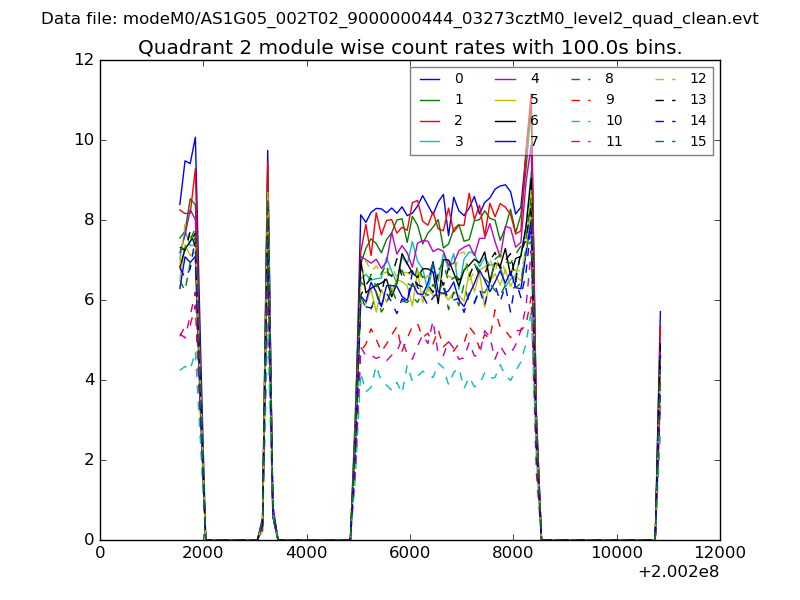
| Module-wise count rates for Quadrant B Data is divided into 100 sec bins |
 |
 |
| Module-wise count rates for Quadrant C Data is divided into 100 sec bins |
 |
 |
| Module-wise count rates for Quadrant D Data is divided into 100 sec bins |
 |
 |
| Parameter | Plot |
|---|---|
| CZT HV Monitor | 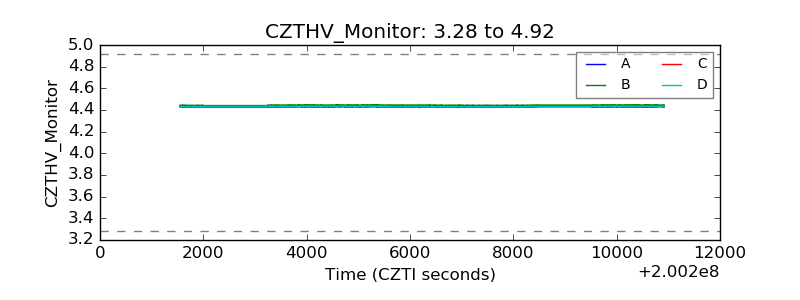 |
| D_VDD | 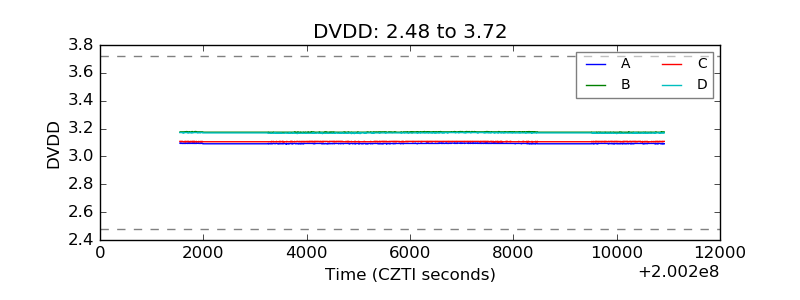 |
| Temperature 1 | 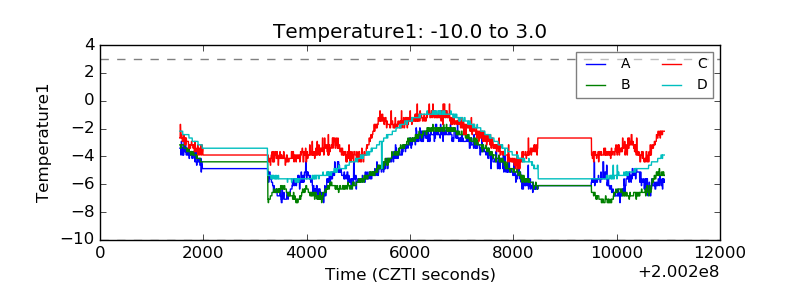 |
| Veto HV Monitor | 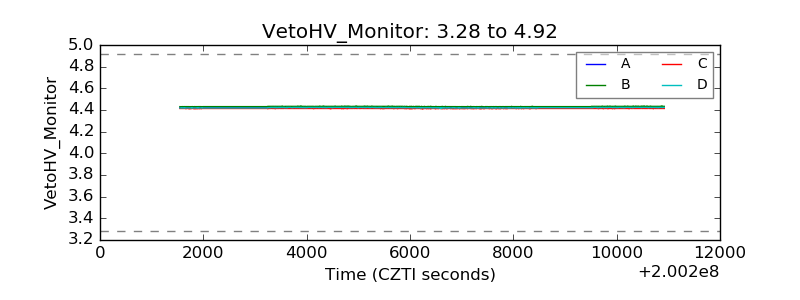 |
| Veto LLD | 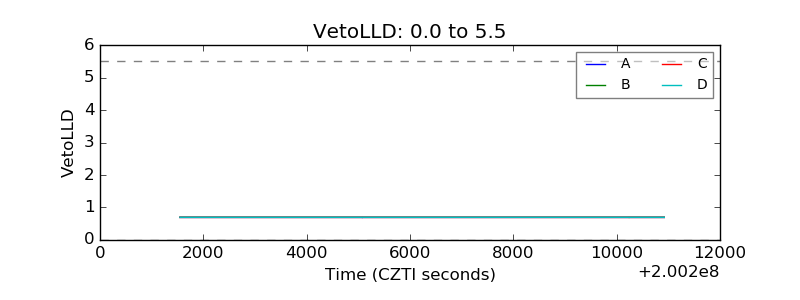 |
| Alpha Counter | 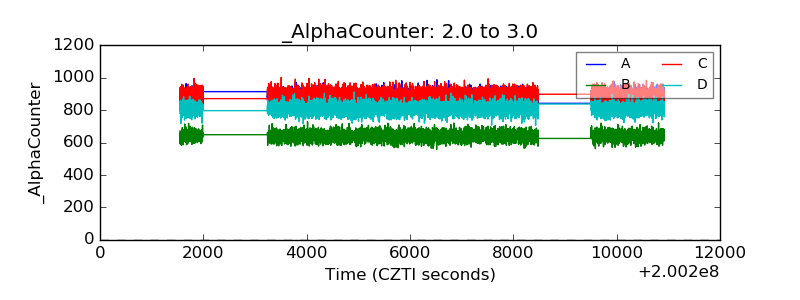 |
| _CPM_Rate | 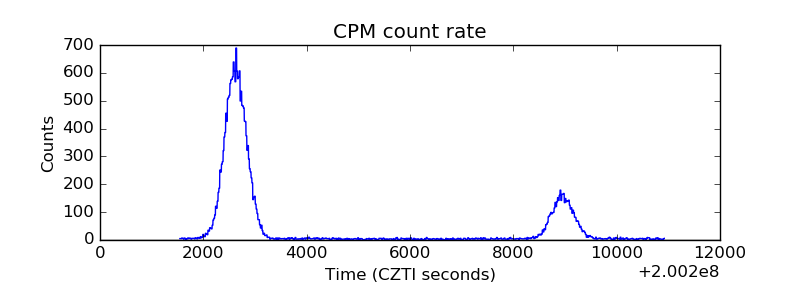 |
| CZT Counter | 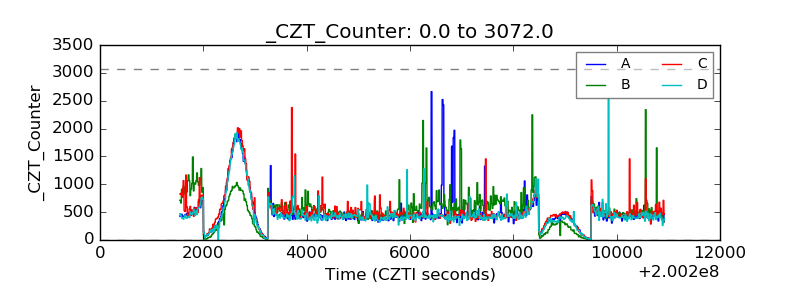 |
| +2.5 Volts monitor |  |
| +5 Volts monitor |  |
| _ROLL_ROT | 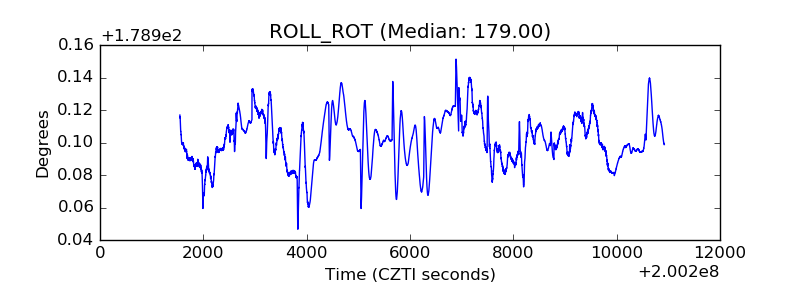 |
| _Roll_DEC | 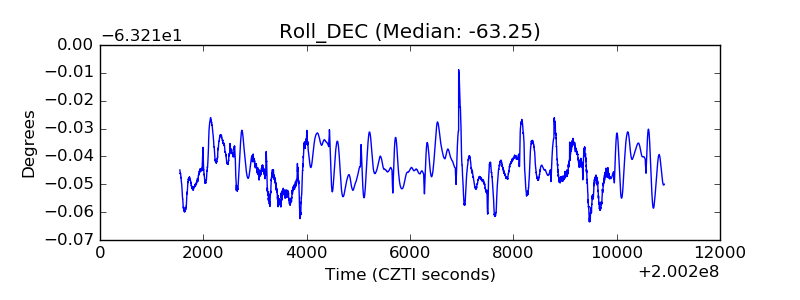 |
| _Roll_RA | 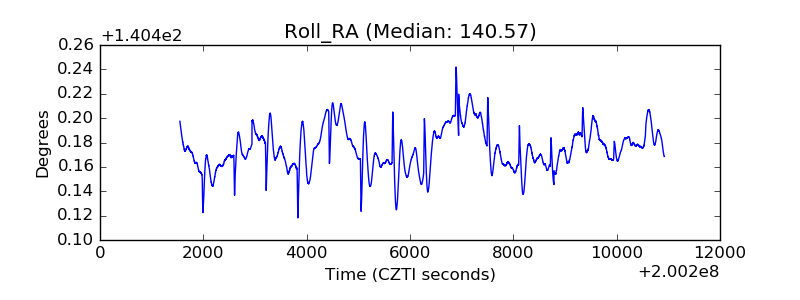 |
| Veto Counter | 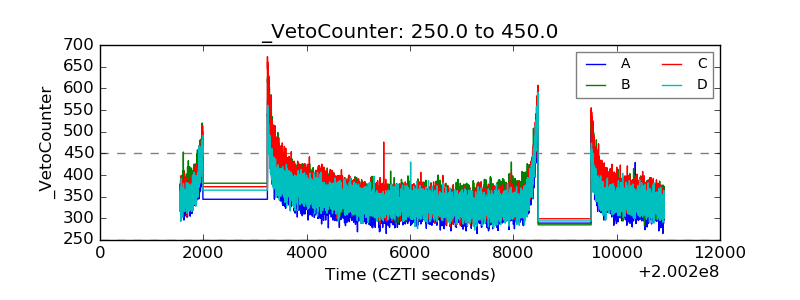 |