| Param | Original file | Final file |
|---|---|---|
| Filename | modeM0/AS1G05_002T02_9000000444_03279cztM0_level2.evt | modeM0/AS1G05_002T02_9000000444_03279cztM0_level2_quad_clean.evt |
| Size (bytes) | 1,334,439,360 | 214,836,480 |
| Size | 1.2 GB | 204.9 MB |
| Events in quadrant A | 9,505,631 | 1,306,001 |
| Events in quadrant B | 11,657,964 | 1,319,919 |
| Events in quadrant C | 8,677,611 | 1,323,959 |
| Events in quadrant D | 9,322,510 | 1,281,810 |
| Mode M0 | |||
|---|---|---|---|
| Quadrant | BADHDUFLAG | Total packets | Discarded packets |
| A | 0 | 41697 | 4 |
| B | 0 | 47050 | 3 |
| C | 0 | 39428 | 3 |
| D | 0 | 41707 | 3 |
| Mode M9 | |||
|---|---|---|---|
| Quadrant | BADHDUFLAG | Total packets | Discarded packets |
| A | 0 | 16 | 0 |
| B | 0 | 16 | 0 |
| C | 0 | 16 | 0 |
| D | 0 | 16 | 0 |
| Mode SS | |||
|---|---|---|---|
| Quadrant | BADHDUFLAG | Total packets | Discarded packets |
| A | 0 | 376 | 0 |
| B | 0 | 376 | 0 |
| C | 0 | 376 | 0 |
| D | 0 | 376 | 0 |
| Quadrant | Total seconds | Saturated seconds | Saturation percentage |
|---|---|---|---|
| A | 18496 | 542 | 2.930363% |
| B | 18496 | 178 | 0.962370% |
| C | 18496 | 172 | 0.929931% |
| D | 18496 | 386 | 2.086938% |
Noise dominated data is calculated using 1-second bins in cleaned event files. If a bin has >2000 counts, and if more than 50% of those come from <1% of pixels, then it is considered to be noise-dominated and hence unusable.
| Quadrant | # 1 sec bins | Bins with >0 counts | Bins with >2000 counts | High rate bins dominated by noise | Noise dominated (total time) | Noise dominated (detector-on time) | Marked lightcurve |
|---|---|---|---|---|---|---|---|
| A | 20081 | 18499 | 292 | 292 | 1.45% | 1.58% | 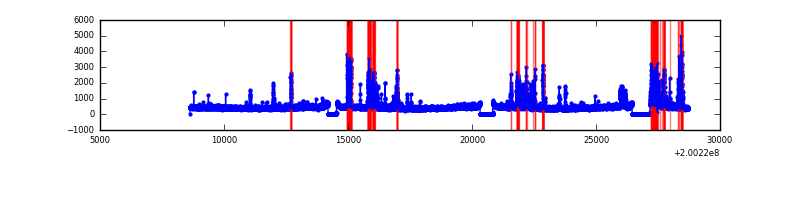 |
| B | 20081 | 18499 | 26 | 26 | 0.13% | 0.14% | 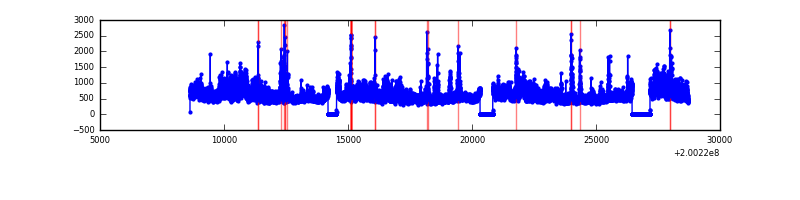 |
| C | 20081 | 18499 | 108 | 108 | 0.54% | 0.58% | 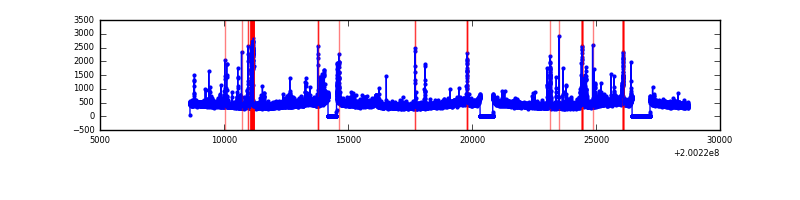 |
| D | 20081 | 18499 | 328 | 328 | 1.63% | 1.77% | 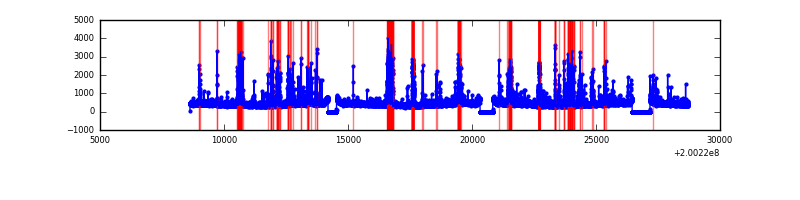 |
Top three noisy pixels from each quadrant. If the there are fewer than three noisy pixels in the level2.evt file, extra rows are filled as -1
| Pixel properties | Quadrant properties | ||||||
|---|---|---|---|---|---|---|---|
| Quadrant | DetID | PixID | Counts | Sigma | Mean | Median | Sigma |
| A | 14 | 249 | 746030 | 1765.44 | 2046 | 1997 | 421.4 |
| A | 0 | 50 | 509249 | 1203.61 | 2046 | 1997 | 421.4 |
| A | 0 | 118 | 285215 | 672.02 | 2046 | 1997 | 421.4 |
| B | 15 | 204 | 3080312 | 7599.78 | 2094 | 2036 | 405.0 |
| B | 2 | 249 | 297800 | 730.2 | 2094 | 2036 | 405.0 |
| B | 14 | 167 | 111441 | 270.1 | 2094 | 2036 | 405.0 |
| C | 14 | 223 | 353598 | 756.52 | 1997 | 2003 | 464.7 |
| C | 12 | 175 | 163243 | 346.94 | 1997 | 2003 | 464.7 |
| C | 6 | 80 | 146288 | 310.46 | 1997 | 2003 | 464.7 |
| D | 13 | 223 | 652615 | 1361.38 | 1986 | 1923 | 478.0 |
| D | 1 | 193 | 462681 | 964.0 | 1986 | 1923 | 478.0 |
| D | 13 | 239 | 226227 | 469.29 | 1986 | 1923 | 478.0 |
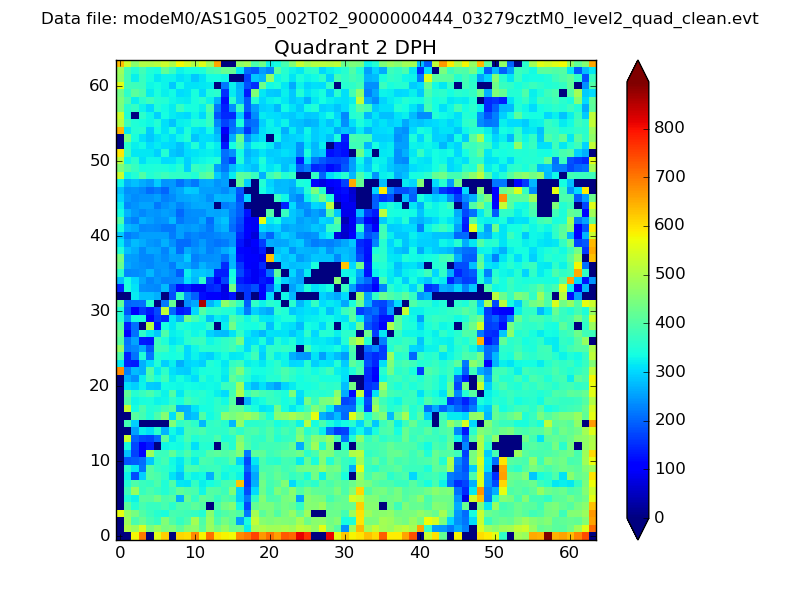
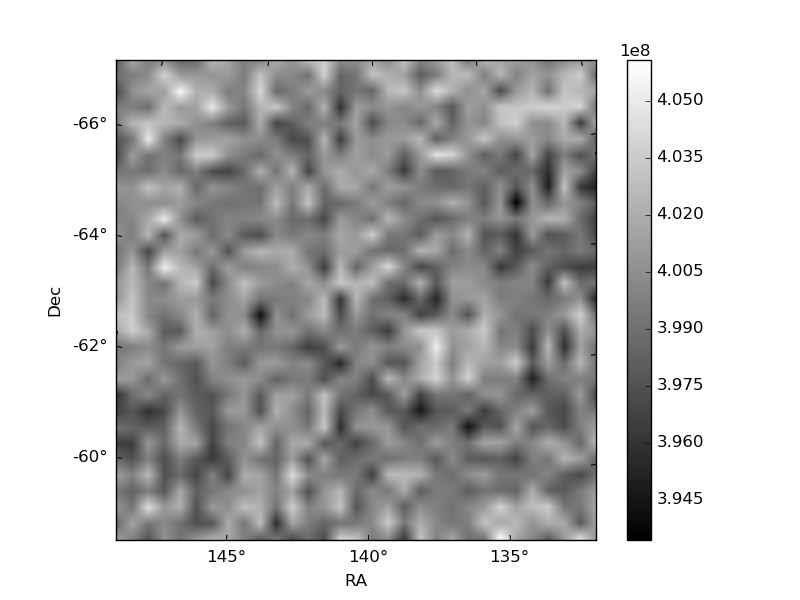
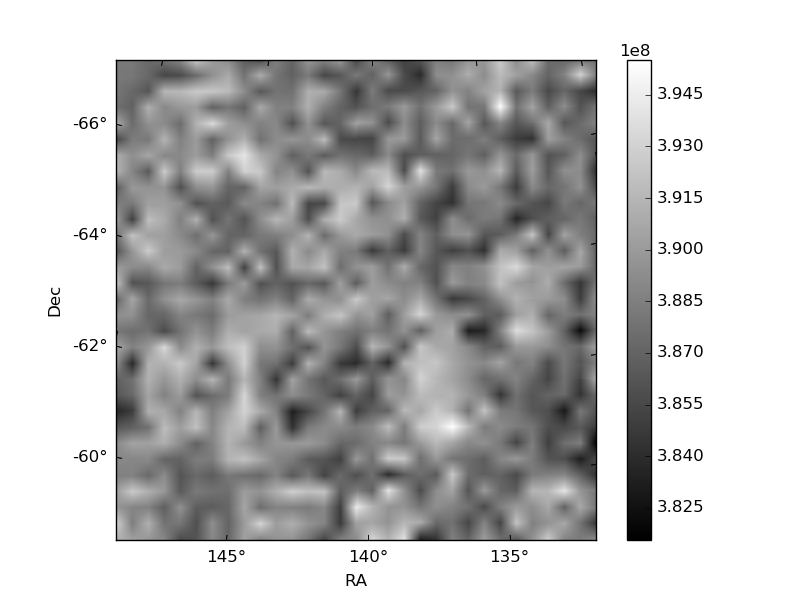
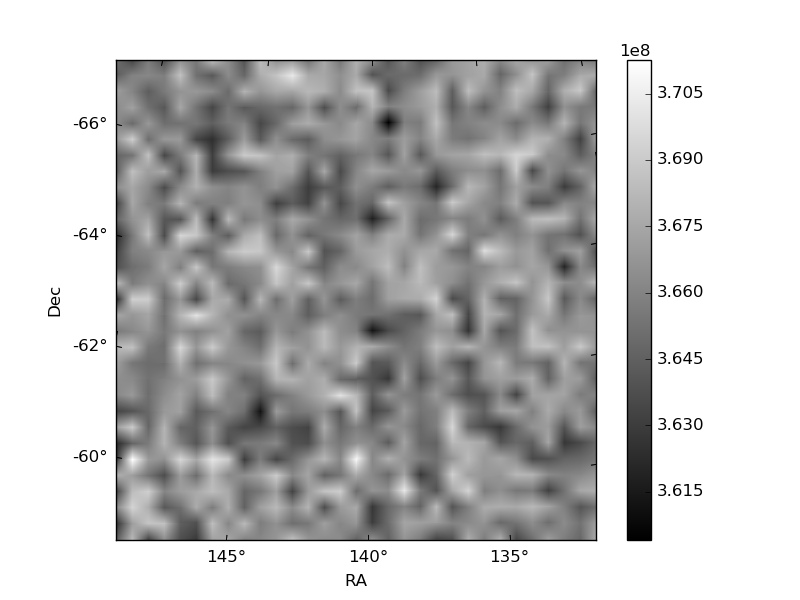
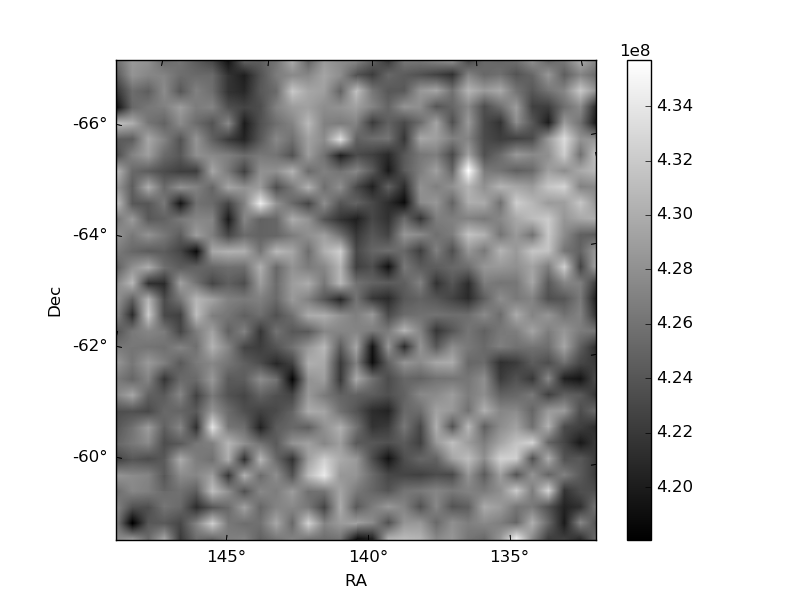
Histogram calculated using DETX and DETY for each event in the final _common_clean file
| Quadrant A | 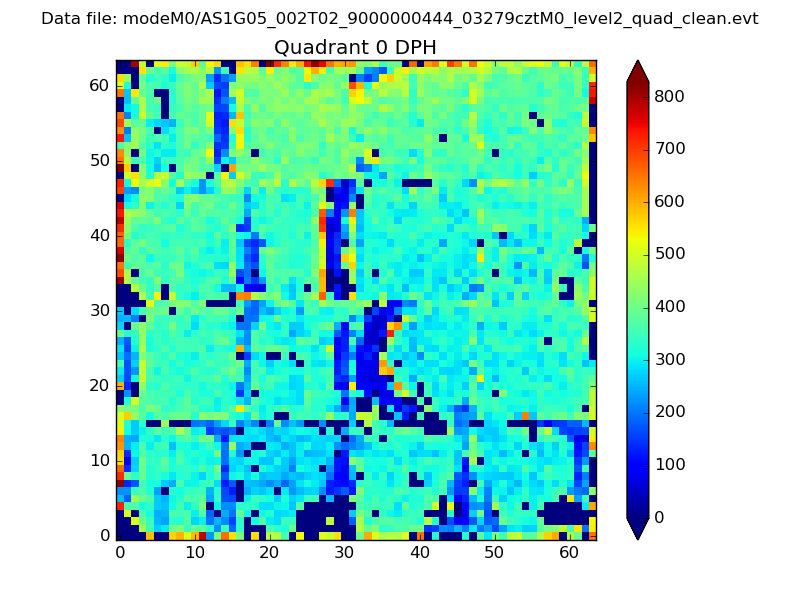 |
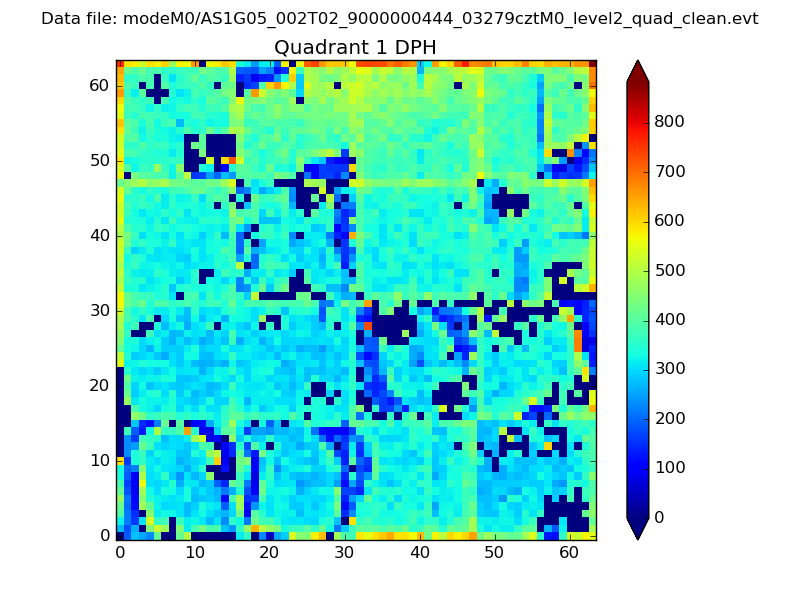 |
Quadrant B |
|---|---|---|---|
| Quadrant D | 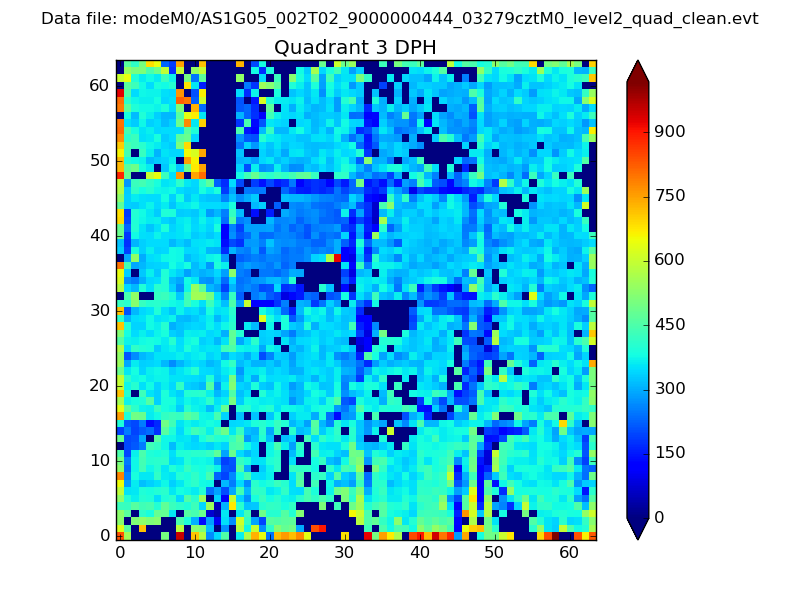 |
 |
Quadrant C |
| Plot type | Count rate plots | Images |
|---|---|---|
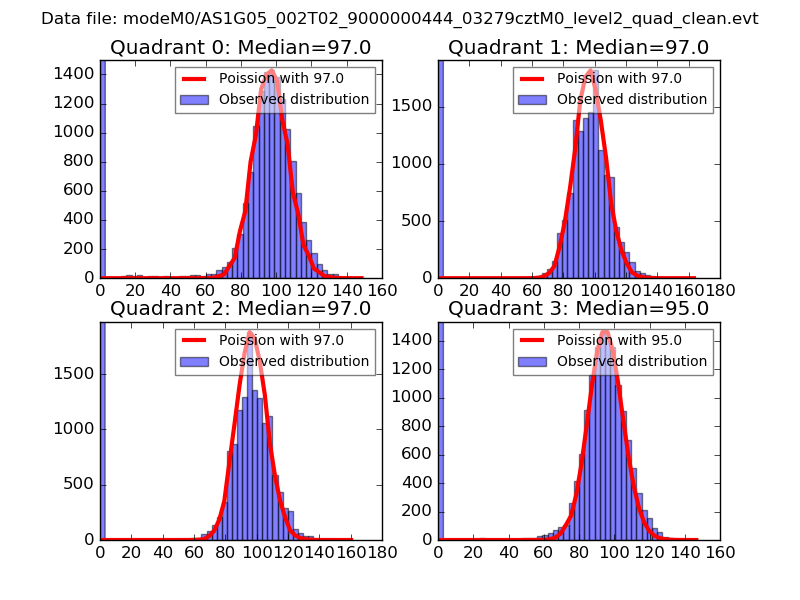
| Comparison with Poisson distribution Blue bars denote a histogram of data divided into 1 sec bins. Red curve is a Poisson curve with rate = median count rate of data. |
 |
 |
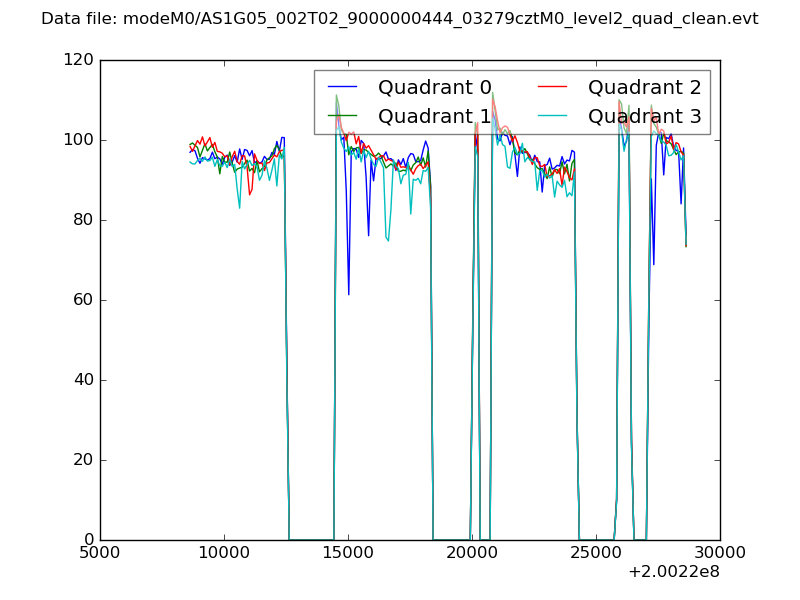
| Quadrant-wise count rates Data is divided into 100 sec bins |
 |
|
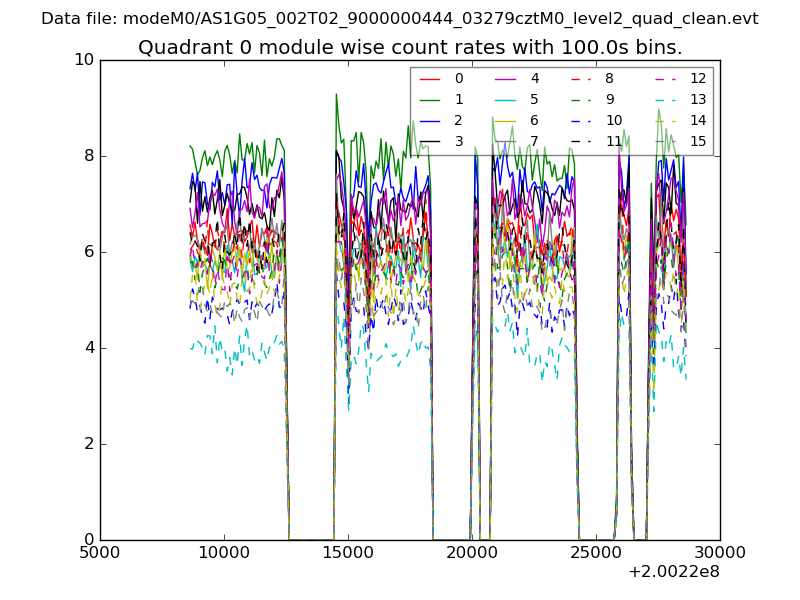
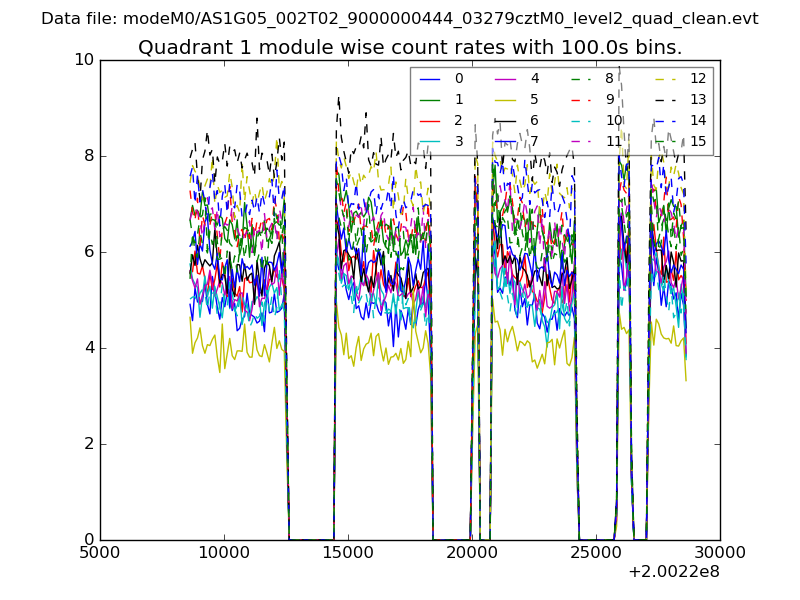
| Module-wise count rates for Quadrant A Data is divided into 100 sec bins |
 |
 |
| Module-wise count rates for Quadrant B Data is divided into 100 sec bins |
 |
 |
| Module-wise count rates for Quadrant C Data is divided into 100 sec bins |
 |
 |
| Module-wise count rates for Quadrant D Data is divided into 100 sec bins |
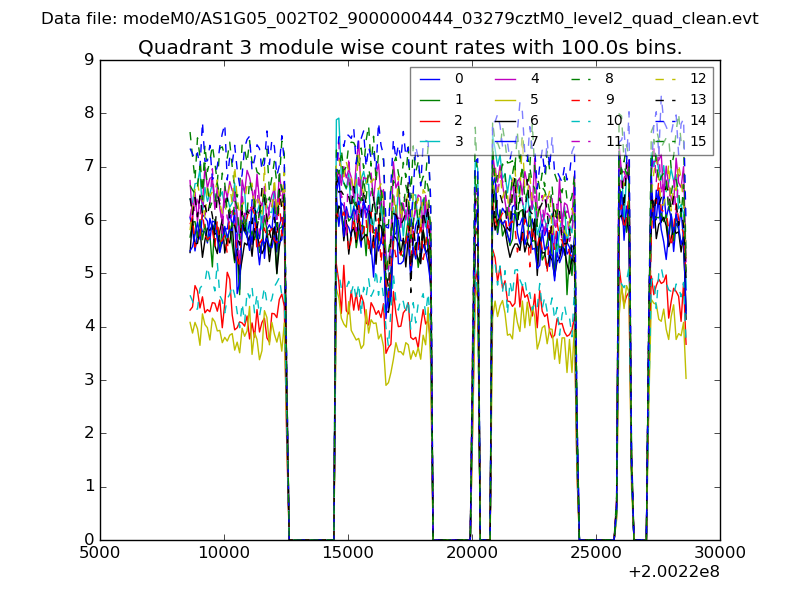 |
 |
| Parameter | Plot |
|---|---|
| CZT HV Monitor | 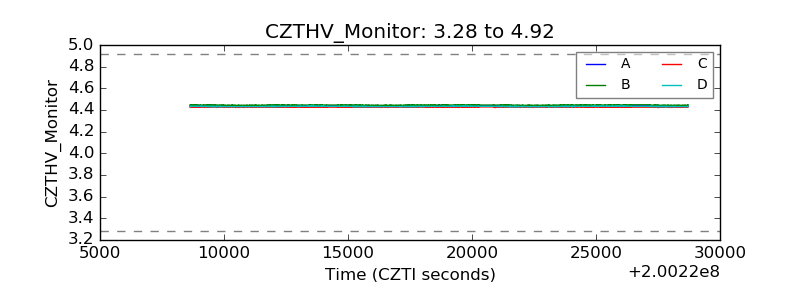 |
| D_VDD | 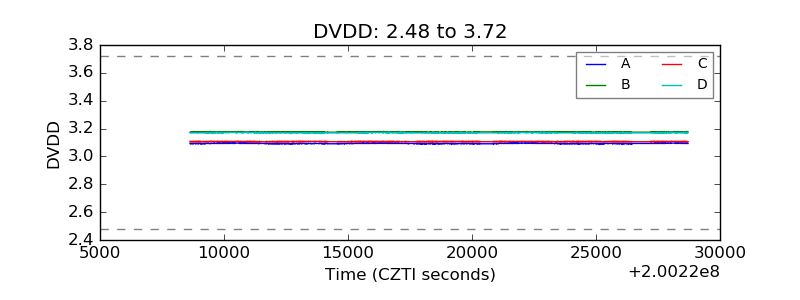 |
| Temperature 1 | 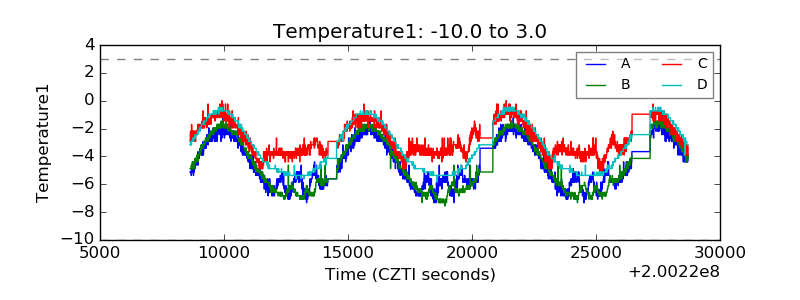 |
| Veto HV Monitor | 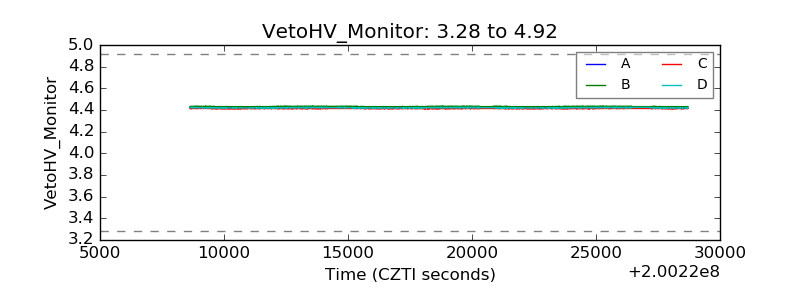 |
| Veto LLD | 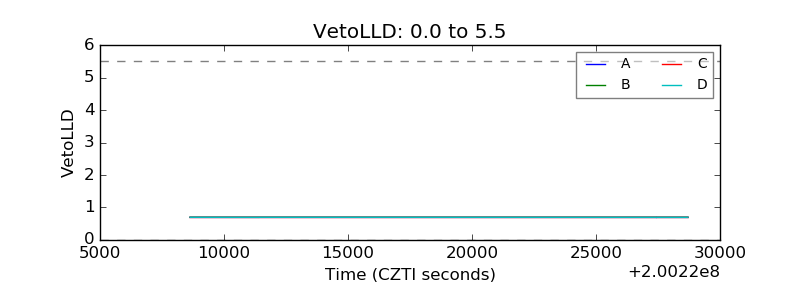 |
| Alpha Counter | 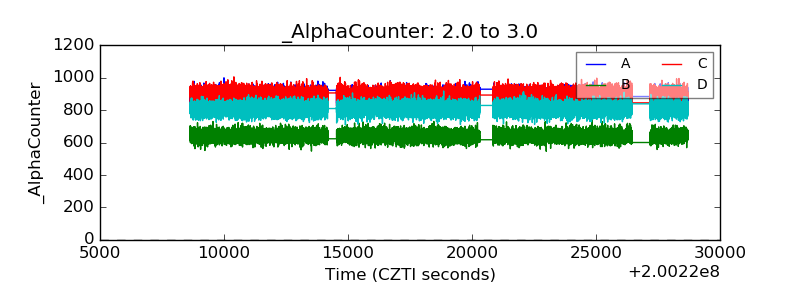 |
| _CPM_Rate | 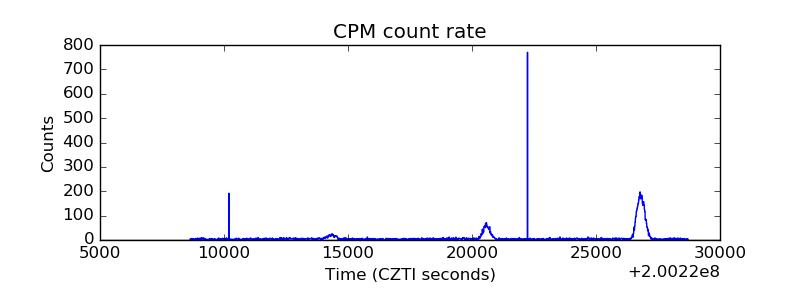 |
| CZT Counter | 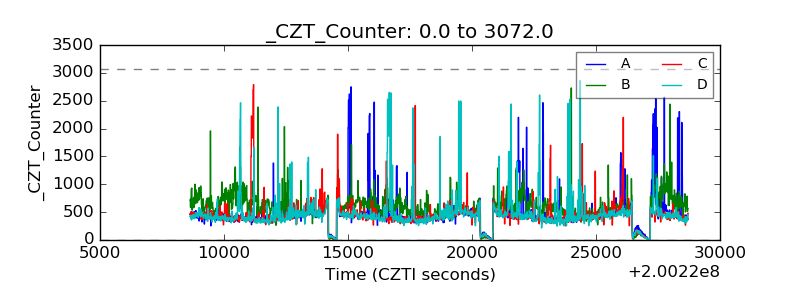 |
| +2.5 Volts monitor | 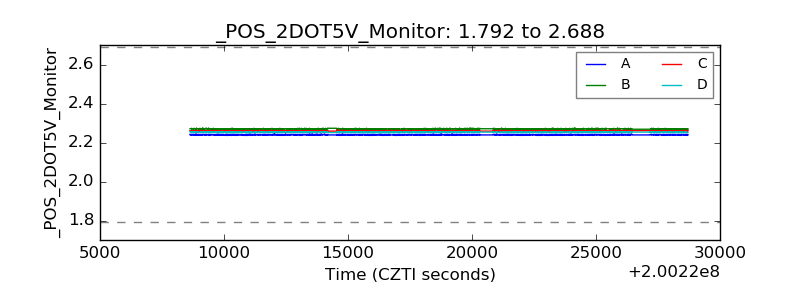 |
| +5 Volts monitor |  |
| _ROLL_ROT | 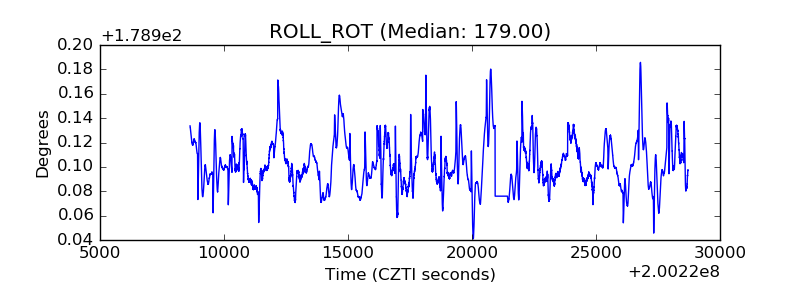 |
| _Roll_DEC | 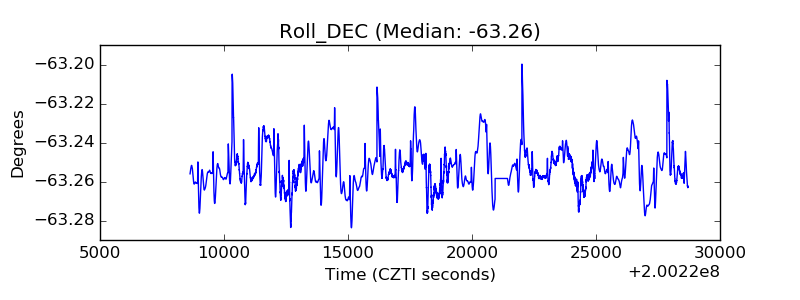 |
| _Roll_RA | 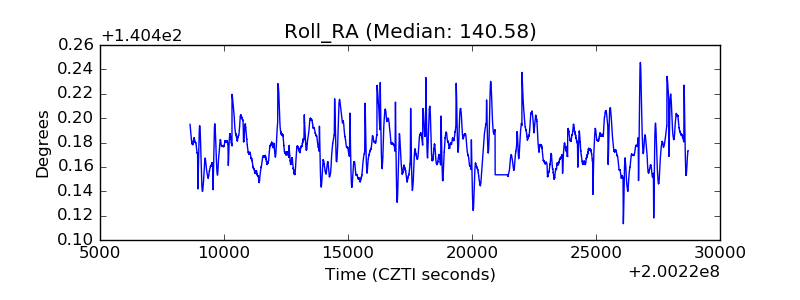 |
| Veto Counter | 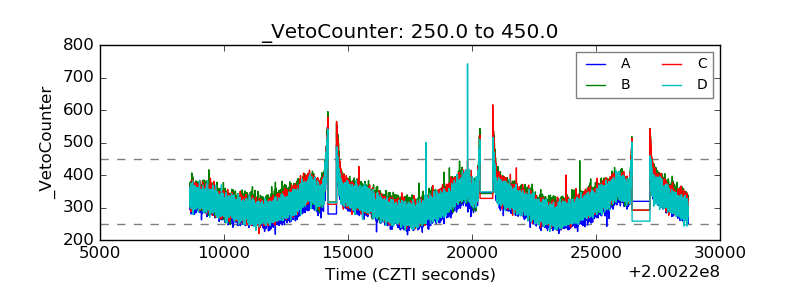 |