| Param | Original file | Final file |
|---|---|---|
| Filename | modeM0/AS1G05_002T02_9000000444_03281cztM0_level2.evt | modeM0/AS1G05_002T02_9000000444_03281cztM0_level2_quad_clean.evt |
| Size (bytes) | 2,476,100,160 | 380,822,400 |
| Size | 2.3 GB | 363.2 MB |
| Events in quadrant A | 17,481,680 | 2,304,990 |
| Events in quadrant B | 22,129,741 | 2,323,953 |
| Events in quadrant C | 16,491,186 | 2,330,024 |
| Events in quadrant D | 16,617,730 | 2,264,575 |
| Mode M0 | |||
|---|---|---|---|
| Quadrant | BADHDUFLAG | Total packets | Discarded packets |
| A | 0 | 76505 | 5 |
| B | 0 | 88605 | 5 |
| C | 0 | 73606 | 5 |
| D | 0 | 74936 | 5 |
| Mode M9 | |||
|---|---|---|---|
| Quadrant | BADHDUFLAG | Total packets | Discarded packets |
| A | 0 | 35 | 0 |
| B | 0 | 35 | 0 |
| C | 0 | 35 | 0 |
| D | 0 | 35 | 0 |
| Mode SS | |||
|---|---|---|---|
| Quadrant | BADHDUFLAG | Total packets | Discarded packets |
| A | 0 | 682 | 0 |
| B | 0 | 682 | 0 |
| C | 0 | 682 | 0 |
| D | 0 | 682 | 0 |
| Quadrant | Total seconds | Saturated seconds | Saturation percentage |
|---|---|---|---|
| A | 33626 | 1204 | 3.580563% |
| B | 33626 | 617 | 1.834890% |
| C | 33626 | 472 | 1.403676% |
| D | 33626 | 709 | 2.108487% |
Noise dominated data is calculated using 1-second bins in cleaned event files. If a bin has >2000 counts, and if more than 50% of those come from <1% of pixels, then it is considered to be noise-dominated and hence unusable.
| Quadrant | # 1 sec bins | Bins with >0 counts | Bins with >2000 counts | High rate bins dominated by noise | Noise dominated (total time) | Noise dominated (detector-on time) | Marked lightcurve |
|---|---|---|---|---|---|---|---|
| A | 37136 | 33631 | 605 | 605 | 1.63% | 1.80% | 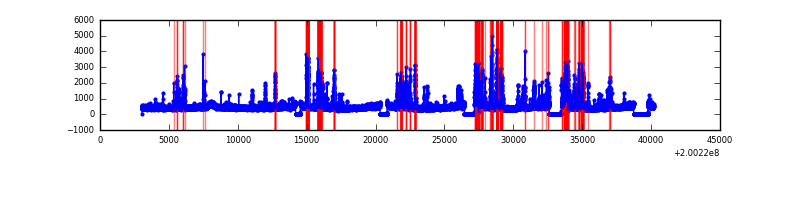 |
| B | 37136 | 33631 | 74 | 74 | 0.20% | 0.22% | 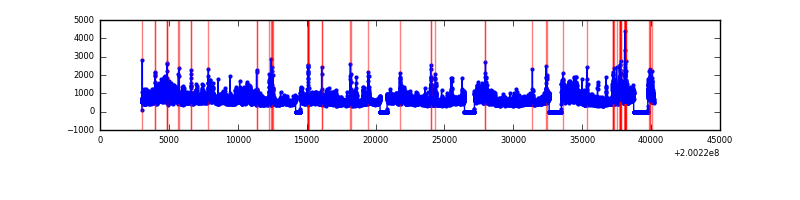 |
| C | 37136 | 33631 | 232 | 232 | 0.62% | 0.69% | 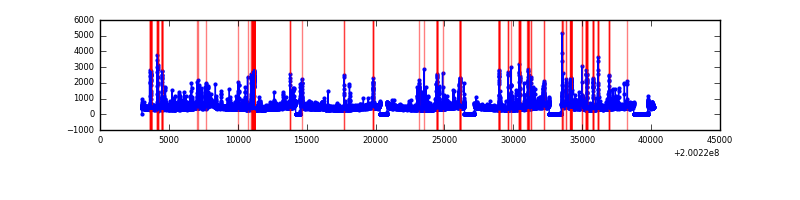 |
| D | 37136 | 33631 | 465 | 465 | 1.25% | 1.38% | 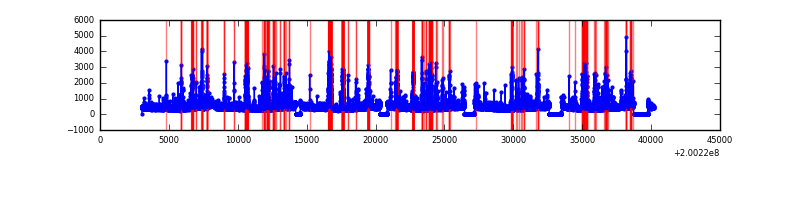 |
Top three noisy pixels from each quadrant. If the there are fewer than three noisy pixels in the level2.evt file, extra rows are filled as -1
| Pixel properties | Quadrant properties | ||||||
|---|---|---|---|---|---|---|---|
| Quadrant | DetID | PixID | Counts | Sigma | Mean | Median | Sigma |
| A | 0 | 50 | 1431145 | 1880.62 | 3714 | 3627 | 759.1 |
| A | 14 | 249 | 1011585 | 1327.89 | 3714 | 3627 | 759.1 |
| A | 0 | 118 | 594767 | 778.77 | 3714 | 3627 | 759.1 |
| B | 15 | 204 | 6278659 | 8579.81 | 3812 | 3712 | 731.4 |
| B | 2 | 249 | 722994 | 983.48 | 3812 | 3712 | 731.4 |
| B | 14 | 167 | 160934 | 214.97 | 3812 | 3712 | 731.4 |
| C | 14 | 223 | 1218972 | 1443.97 | 3639 | 3648 | 841.7 |
| C | 6 | 80 | 297741 | 349.42 | 3639 | 3648 | 841.7 |
| C | 12 | 175 | 260286 | 304.92 | 3639 | 3648 | 841.7 |
| D | 13 | 223 | 1147029 | 1311.78 | 3621 | 3503 | 871.7 |
| D | 13 | 239 | 524721 | 597.91 | 3621 | 3503 | 871.7 |
| D | 1 | 193 | 466518 | 531.14 | 3621 | 3503 | 871.7 |
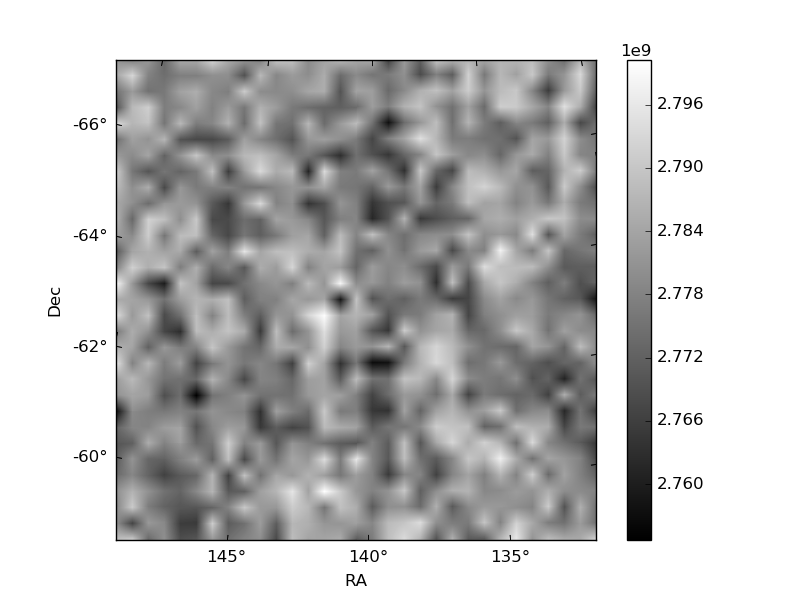
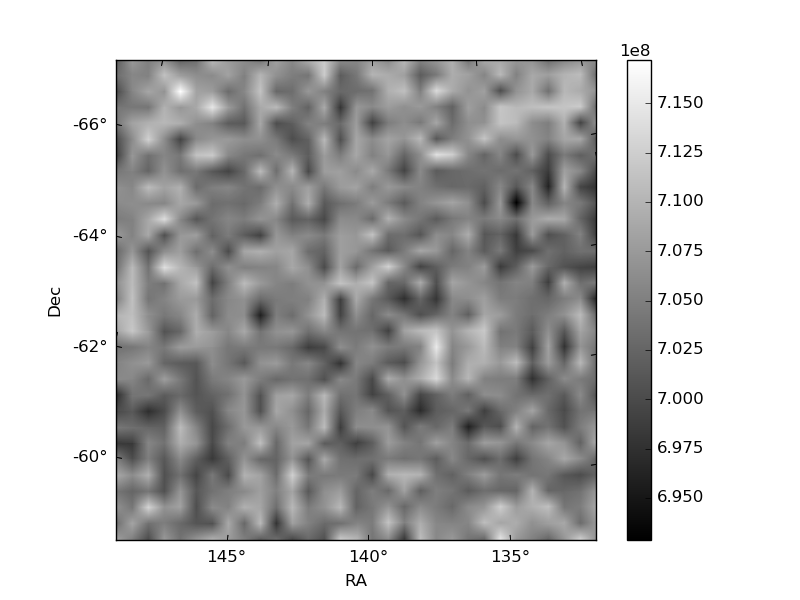
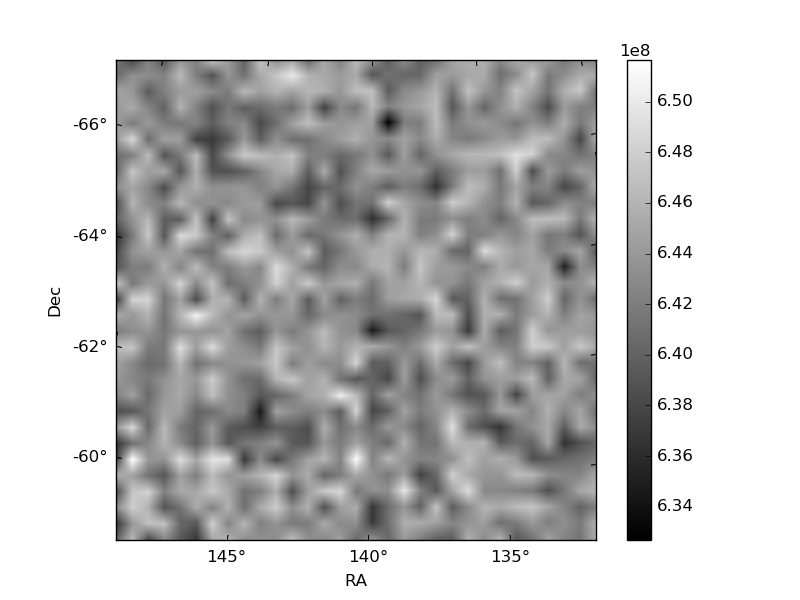
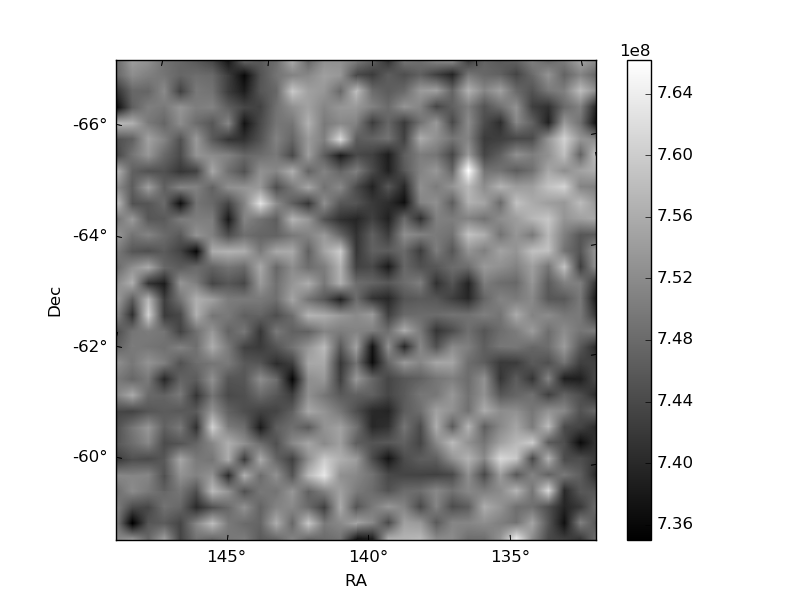
Histogram calculated using DETX and DETY for each event in the final _common_clean file
| Quadrant A | 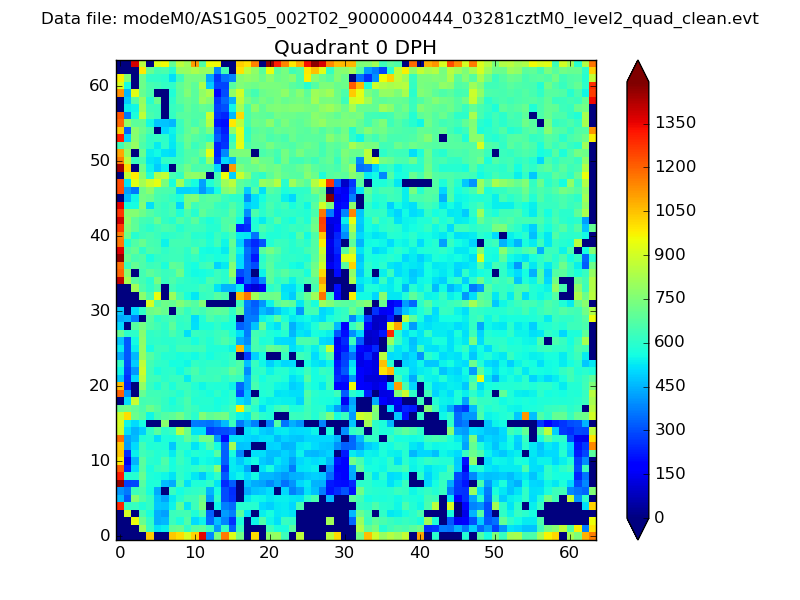 |
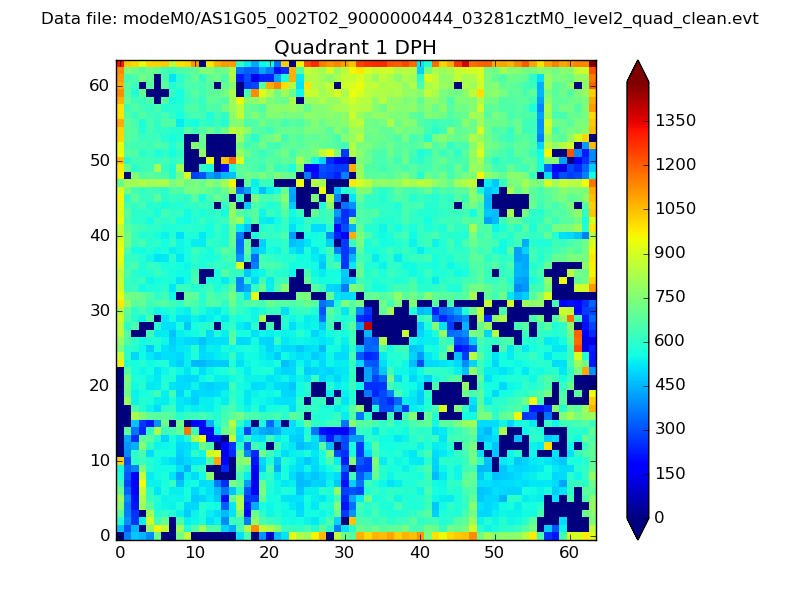 |
Quadrant B |
|---|---|---|---|
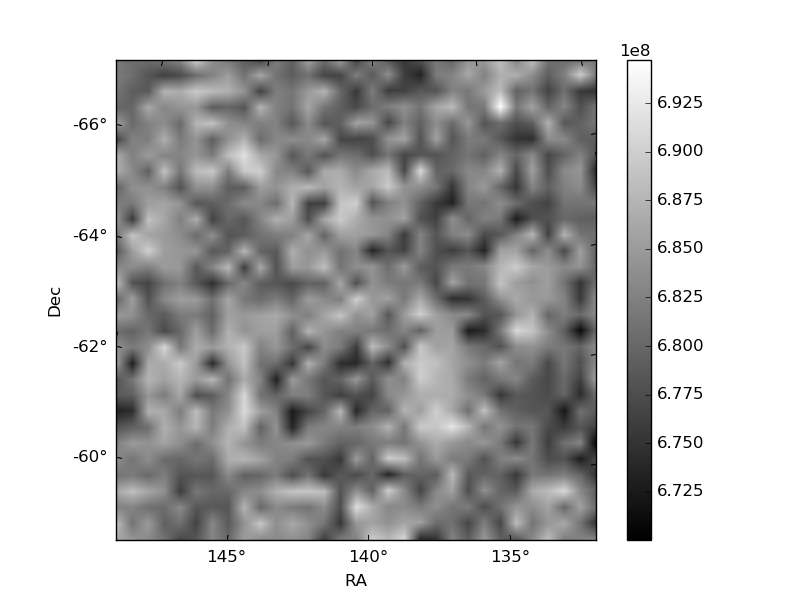
| Quadrant D | 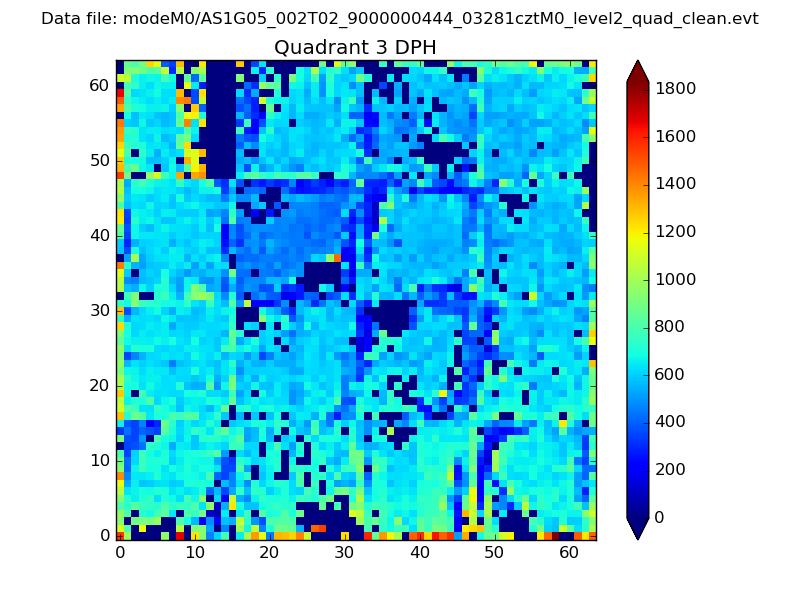 |
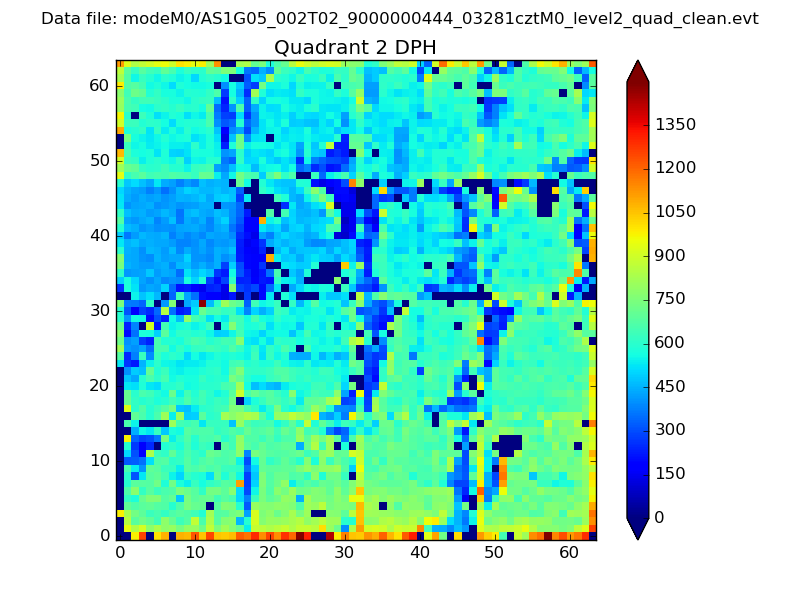 |
Quadrant C |
| Plot type | Count rate plots | Images |
|---|---|---|
| Comparison with Poisson distribution Blue bars denote a histogram of data divided into 1 sec bins. Red curve is a Poisson curve with rate = median count rate of data. |
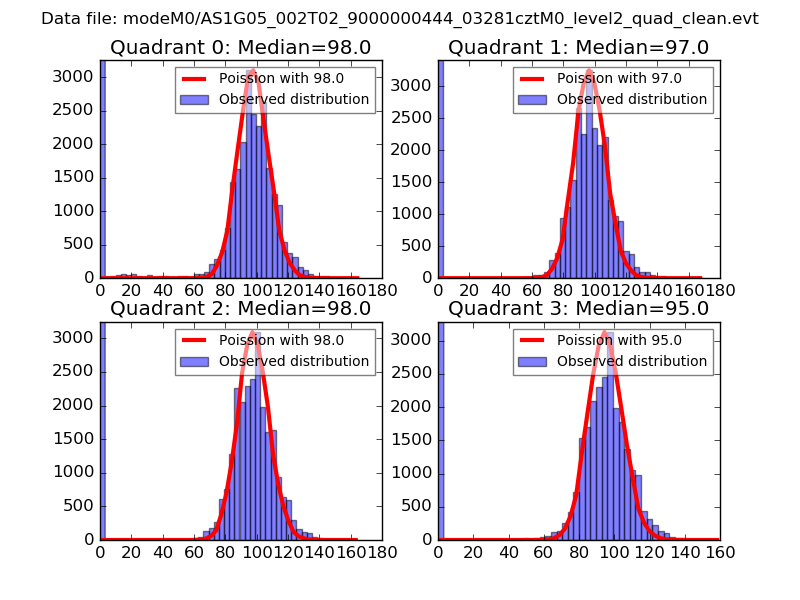 |
 |
| Quadrant-wise count rates Data is divided into 100 sec bins |
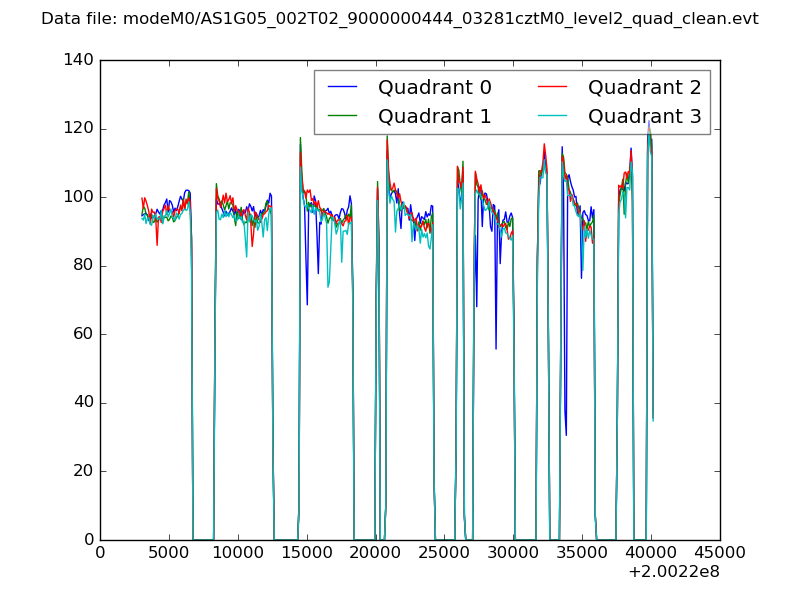 |
|
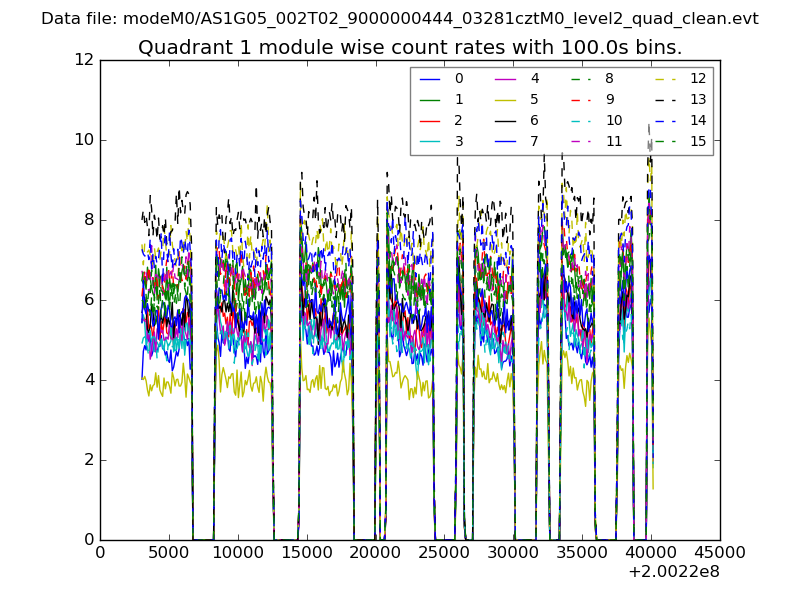
| Module-wise count rates for Quadrant A Data is divided into 100 sec bins |
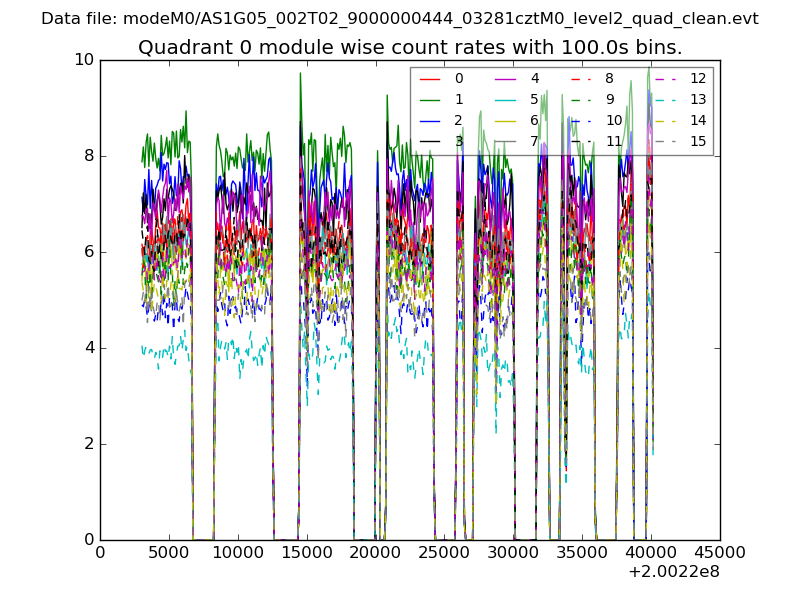 |
 |
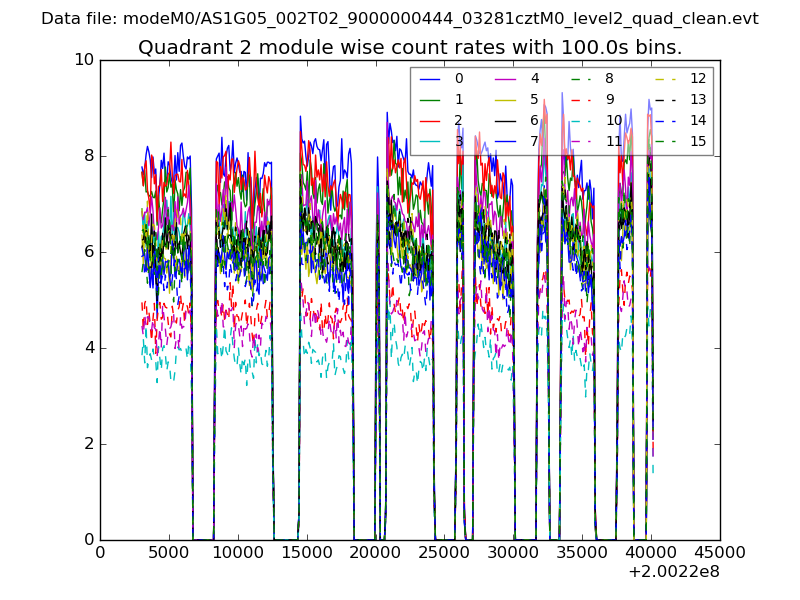
| Module-wise count rates for Quadrant B Data is divided into 100 sec bins |
 |
 |
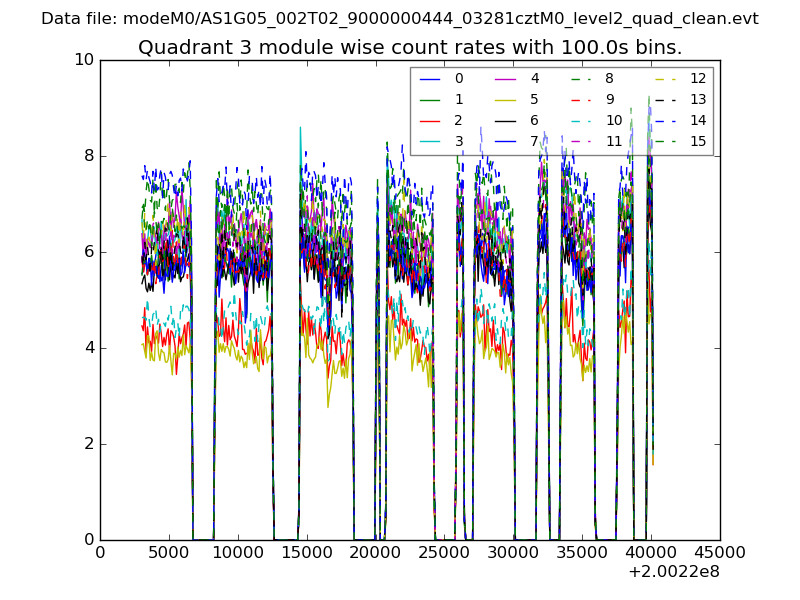
| Module-wise count rates for Quadrant C Data is divided into 100 sec bins |
 |
 |
| Module-wise count rates for Quadrant D Data is divided into 100 sec bins |
 |
 |
| Parameter | Plot |
|---|---|
| CZT HV Monitor | 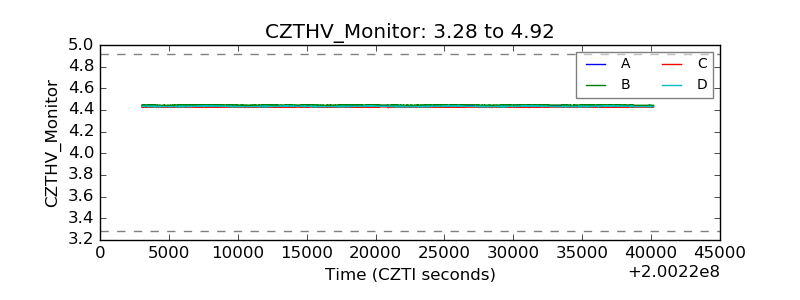 |
| D_VDD | 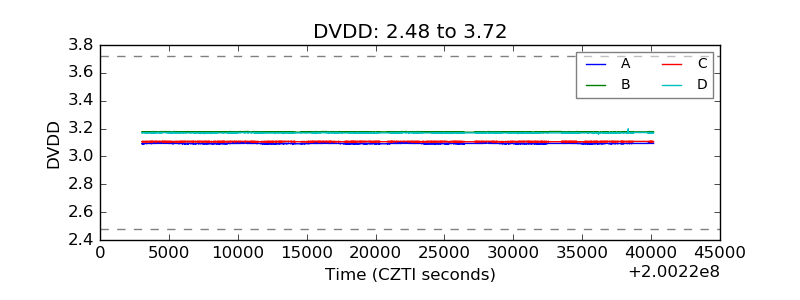 |
| Temperature 1 | 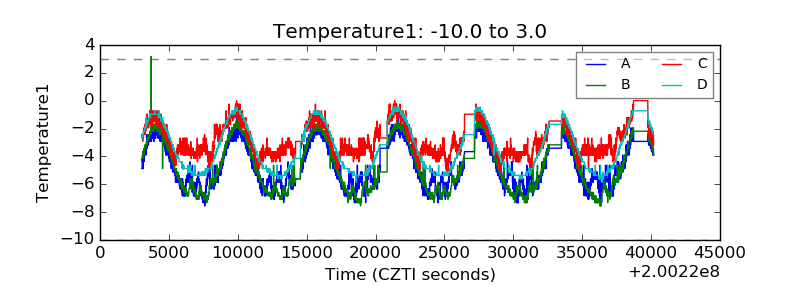 |
| Veto HV Monitor | 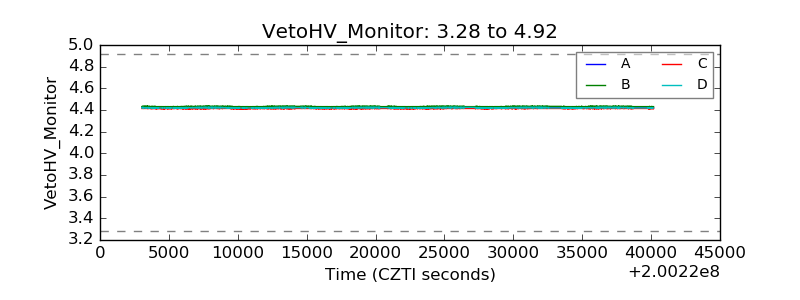 |
| Veto LLD | 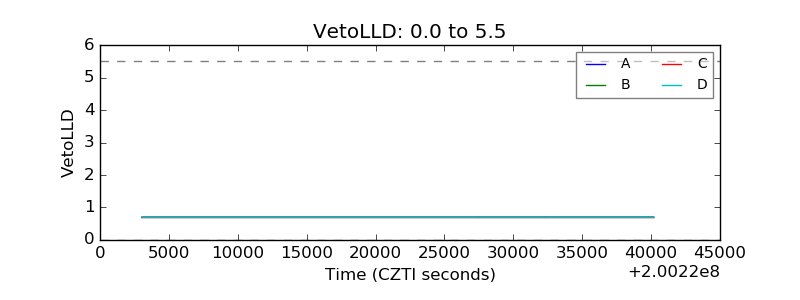 |
| Alpha Counter | 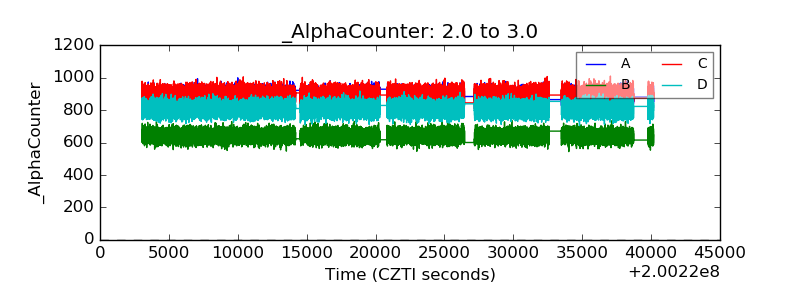 |
| _CPM_Rate | 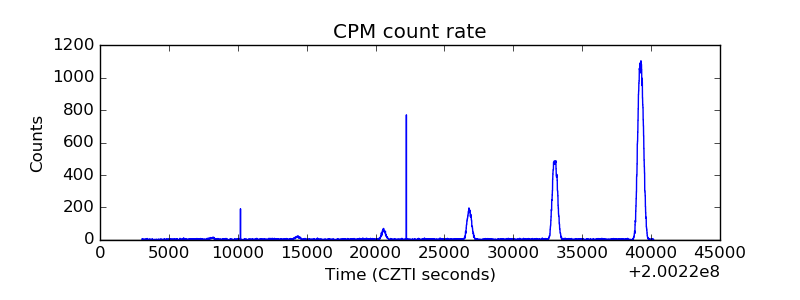 |
| CZT Counter | 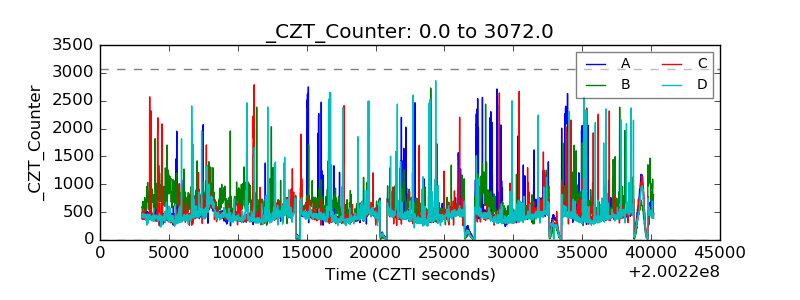 |
| +2.5 Volts monitor |  |
| +5 Volts monitor | 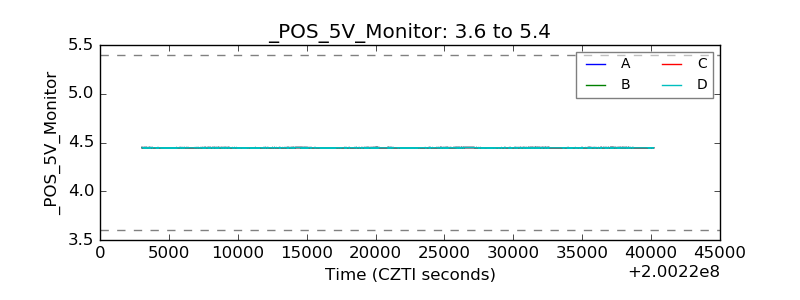 |
| _ROLL_ROT | 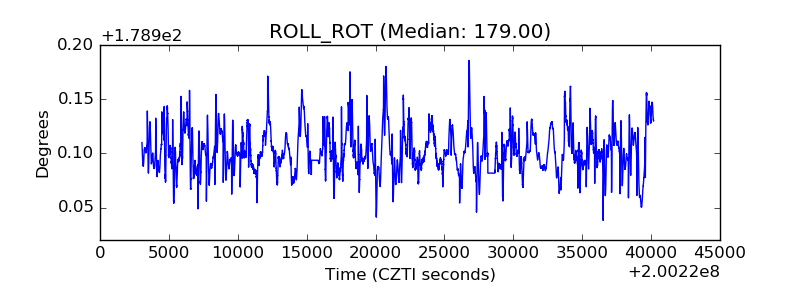 |
| _Roll_DEC | 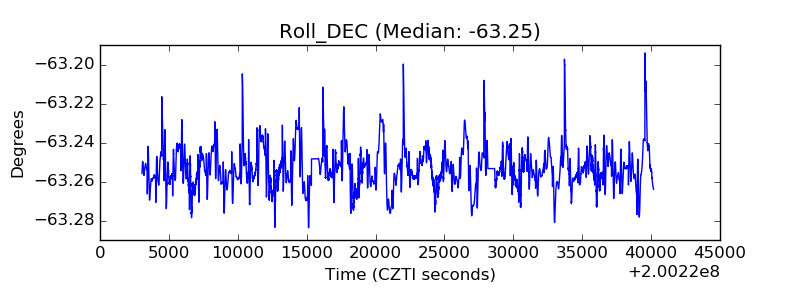 |
| _Roll_RA | 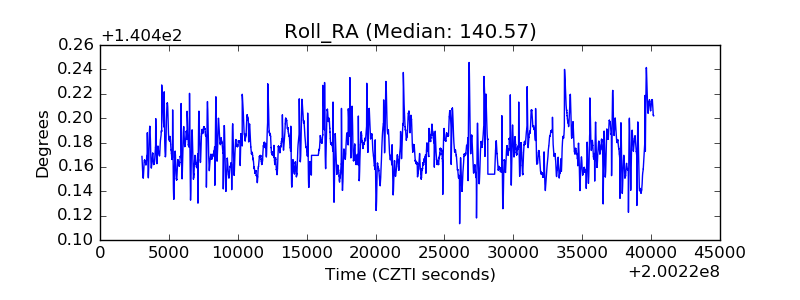 |
| Veto Counter | 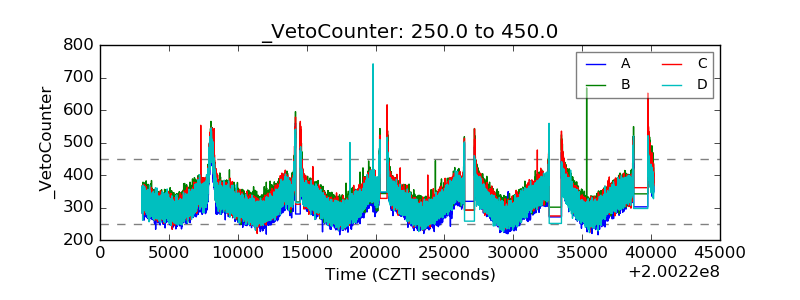 |