| Param | Original file | Final file |
|---|---|---|
| Filename | modeM0/AS1G05_228T02_9000000446cztM0_level2.fits | modeM0/AS1G05_228T02_9000000446cztM0_level2_quad_clean.evt |
| Size (bytes) | 535,317,120 | 384,851,520 |
| Size | 510.5 MB | 367.0 MB |
| Events in quadrant A | 2,173,038 | 2,401,135 |
| Events in quadrant B | 1,979,736 | 2,416,740 |
| Events in quadrant C | 4,521,483 | 2,459,299 |
| Events in quadrant D | 3,021,171 | 2,140,083 |
| Mode SS | |||
|---|---|---|---|
| Quadrant | BADHDUFLAG | Total packets | Discarded packets |
| A | 0 | 1534 | 0 |
| B | 0 | 1534 | 0 |
| C | 0 | 1534 | 0 |
| D | 0 | 1534 | 0 |
| Mode M0 | |||
|---|---|---|---|
| Quadrant | BADHDUFLAG | Total packets | Discarded packets |
| A | 0 | 156332 | 0 |
| B | 0 | 192365 | 0 |
| C | 0 | 180980 | 0 |
| D | 0 | 162774 | 0 |
| Mode M9 | |||
|---|---|---|---|
| Quadrant | BADHDUFLAG | Total packets | Discarded packets |
| A | 0 | 124 | 0 |
| B | 0 | 115 | 0 |
| C | 0 | 124 | 0 |
| D | 0 | 116 | 0 |
| Quadrant | Total seconds | Saturated seconds | Saturation percentage |
|---|---|---|---|
| A | 74433 | 1140 | 1.531579% |
| B | 74187 | 1886 | 2.542224% |
| C | 74632 | 1853 | 2.482849% |
| D | 74458 | 1208 | 1.622391% |
Noise dominated data is calculated using 1-second bins in cleaned event files. If a bin has >2000 counts, and if more than 50% of those come from <1% of pixels, then it is considered to be noise-dominated and hence unusable.
| Quadrant | # 1 sec bins | Bins with >0 counts | Bins with >2000 counts | High rate bins dominated by noise | Noise dominated (total time) | Noise dominated (detector-on time) | Marked lightcurve |
|---|---|---|---|---|---|---|---|
| A | 96883 | 23105 | 0 | 0 | 0.00% | 0.00% |  |
| B | 44173 | 37024 | 0 | 0 | 0.00% | 0.00% |  |
| C | 1045359 | 66145 | 0 | 0 | 0.00% | 0.00% |  |
| D | 1045448 | 66035 | 0 | 0 | 0.00% | 0.00% |  |
Top three noisy pixels from each quadrant. If the there are fewer than three noisy pixels in the level2.evt file, extra rows are filled as -1
| Pixel properties | Quadrant properties | ||||||
|---|---|---|---|---|---|---|---|
| Quadrant | DetID | PixID | Counts | Sigma | Mean | Median | Sigma |
| A | 0 | 29 | 1419 | 7.44 | 571 | 552 | 116.6 |
| A | 14 | 254 | 1195 | 5.52 | 571 | 552 | 116.6 |
| A | 7 | 110 | 1179 | 5.38 | 571 | 552 | 116.6 |
| B | 2 | 9 | 1747 | 11.53 | 523 | 496 | 108.5 |
| B | 12 | 226 | 1469 | 8.97 | 523 | 496 | 108.5 |
| B | 14 | 254 | 1362 | 7.98 | 523 | 496 | 108.5 |
| C | 12 | 241 | 2766 | 5.29 | 1206 | 1162 | 303.2 |
| C | 1 | 80 | 2724 | 5.15 | 1206 | 1162 | 303.2 |
| C | 7 | 226 | 2703 | 5.08 | 1206 | 1162 | 303.2 |
| D | 11 | 82 | 2528 | 7.85 | 866 | 793 | 221.1 |
| D | 1 | 3 | 2074 | 5.79 | 866 | 793 | 221.1 |
| D | 6 | 231 | 2046 | 5.67 | 866 | 793 | 221.1 |
Histogram calculated using DETX and DETY for each event in the final _common_clean file
| Quadrant A |  |
 |
Quadrant B |
|---|---|---|---|
| Quadrant D |  |
 |
Quadrant C |
| Plot type | Count rate plots | Images |
|---|---|---|
| Comparison with Poisson distribution Blue bars denote a histogram of data divided into 1 sec bins. Red curve is a Poisson curve with rate = median count rate of data. |
 |
 |
| Quadrant-wise count rates Data is divided into 100 sec bins |
 |
|
| Module-wise count rates for Quadrant A Data is divided into 100 sec bins |
 |
 |
| Module-wise count rates for Quadrant B Data is divided into 100 sec bins |
 |
 |
| Module-wise count rates for Quadrant C Data is divided into 100 sec bins |
 |
 |
| Module-wise count rates for Quadrant D Data is divided into 100 sec bins |
 |
 |
| Parameter | Plot |
|---|---|
| CZT HV Monitor |  |
| D_VDD | 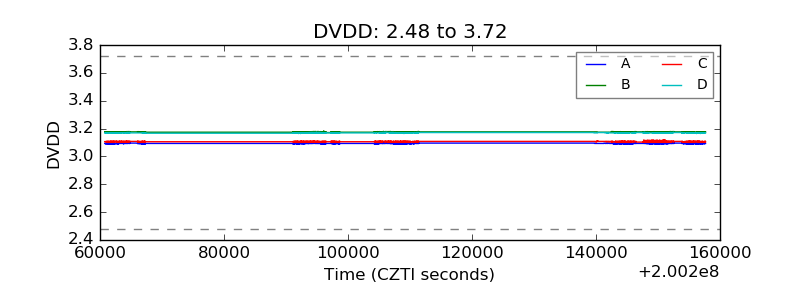 |
| Temperature 1 |  |
| Veto HV Monitor |  |
| Veto LLD |  |
| Alpha Counter |  |
| _CPM_Rate |  |
| CZT Counter |  |
| +2.5 Volts monitor |  |
| +5 Volts monitor |  |
| _ROLL_ROT |  |
| _Roll_DEC |  |
| _Roll_RA |  |
| Veto Counter |  |