| Param | Original file | Final file |
|---|---|---|
| Filename | modeM0/AS1G05_228T02_9000000446_03281cztM0_level2.evt | modeM0/AS1G05_228T02_9000000446_03281cztM0_level2_quad_clean.evt |
| Size (bytes) | 34,885,440 | 4,026,240 |
| Size | 33.3 MB | 3.8 MB |
| Events in quadrant A | 182,792 | 24,228 |
| Events in quadrant B | 188,723 | 24,960 |
| Events in quadrant C | 212,887 | 23,161 |
| Events in quadrant D | 447,398 | 18,995 |
| Mode SS | |||
|---|---|---|---|
| Quadrant | BADHDUFLAG | Total packets | Discarded packets |
| A | 0 | 6 | 0 |
| B | 0 | 6 | 0 |
| C | 0 | 6 | 0 |
| D | 0 | 6 | 0 |
| Mode M0 | |||
|---|---|---|---|
| Quadrant | BADHDUFLAG | Total packets | Discarded packets |
| A | 0 | 773 | 1 |
| B | 0 | 762 | 0 |
| C | 0 | 850 | 0 |
| D | 0 | 1551 | 0 |
| Quadrant | Total seconds | Saturated seconds | Saturation percentage |
|---|---|---|---|
| A | 312 | 17 | 5.448718% |
| B | 312 | 0 | 0.000000% |
| C | 312 | 14 | 4.487179% |
| D | 312 | 113 | 36.217949% |
Noise dominated data is calculated using 1-second bins in cleaned event files. If a bin has >2000 counts, and if more than 50% of those come from <1% of pixels, then it is considered to be noise-dominated and hence unusable.
| Quadrant | # 1 sec bins | Bins with >0 counts | Bins with >2000 counts | High rate bins dominated by noise | Noise dominated (total time) | Noise dominated (detector-on time) | Marked lightcurve |
|---|---|---|---|---|---|---|---|
| A | 312 | 312 | 13 | 13 | 4.17% | 4.17% | 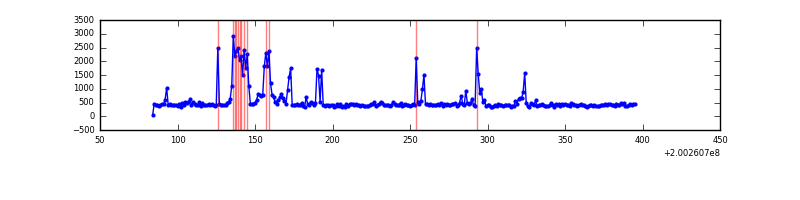 |
| B | 312 | 312 | 0 | 0 | 0.00% | 0.00% | 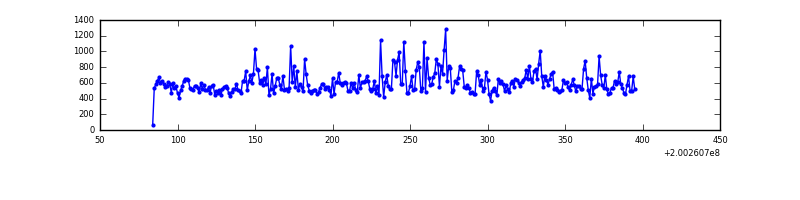 |
| C | 312 | 312 | 13 | 13 | 4.17% | 4.17% | 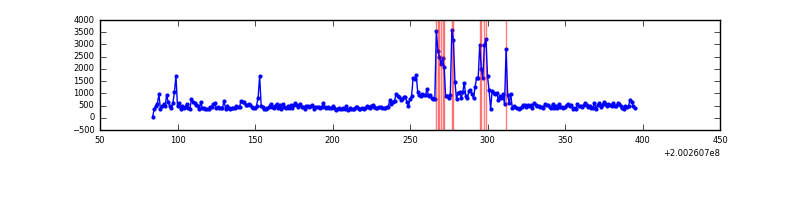 |
| D | 312 | 312 | 105 | 105 | 33.65% | 33.65% | 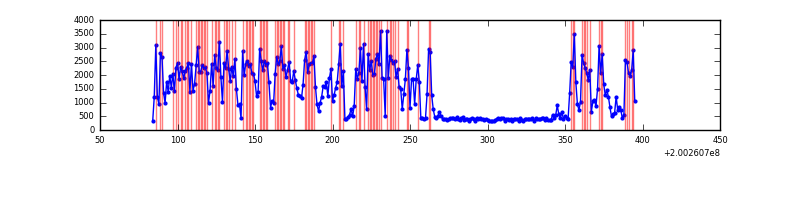 |
Top three noisy pixels from each quadrant. If the there are fewer than three noisy pixels in the level2.evt file, extra rows are filled as -1
| Pixel properties | Quadrant properties | ||||||
|---|---|---|---|---|---|---|---|
| Quadrant | DetID | PixID | Counts | Sigma | Mean | Median | Sigma |
| A | 0 | 50 | 51802 | 5859.88 | 32 | 31 | 8.8 |
| A | 0 | 118 | 5179 | 582.69 | 32 | 31 | 8.8 |
| A | 0 | 226 | 799 | 86.93 | 32 | 31 | 8.8 |
| B | 15 | 204 | 56810 | 6365.96 | 33 | 33 | 8.9 |
| B | 14 | 167 | 1173 | 127.82 | 33 | 33 | 8.9 |
| B | 12 | 111 | 404 | 41.6 | 33 | 33 | 8.9 |
| C | 1 | 192 | 80156 | 8824.17 | 30 | 30 | 9.1 |
| C | 6 | 80 | 11467 | 1259.54 | 30 | 30 | 9.1 |
| C | 14 | 223 | 1260 | 135.46 | 30 | 30 | 9.1 |
| D | 13 | 223 | 341068 | 41410.54 | 26 | 25 | 8.2 |
| D | 5 | 233 | 2003 | 240.18 | 26 | 25 | 8.2 |
| D | 2 | 118 | 1529 | 182.62 | 26 | 25 | 8.2 |
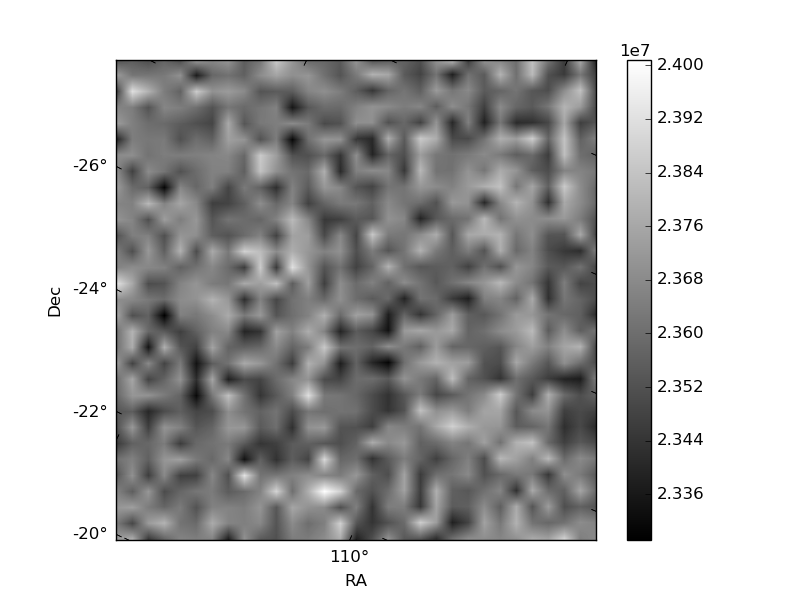
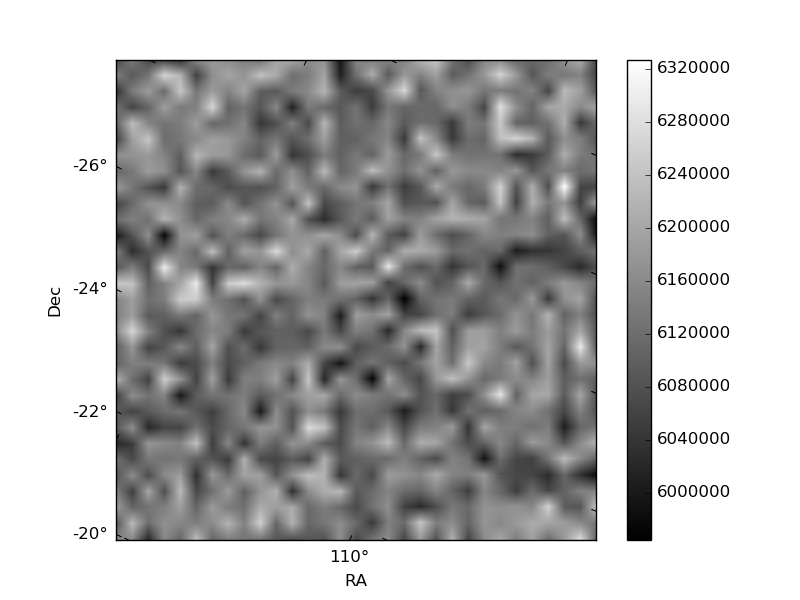
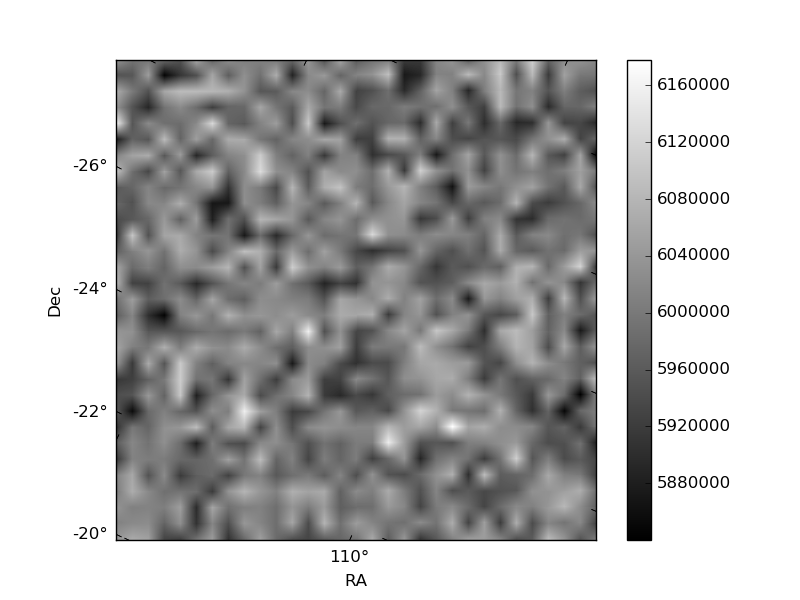
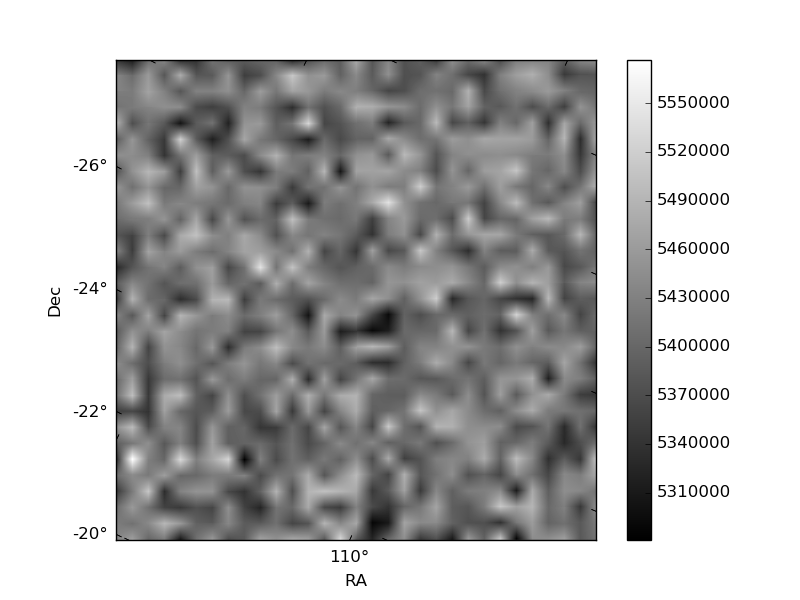
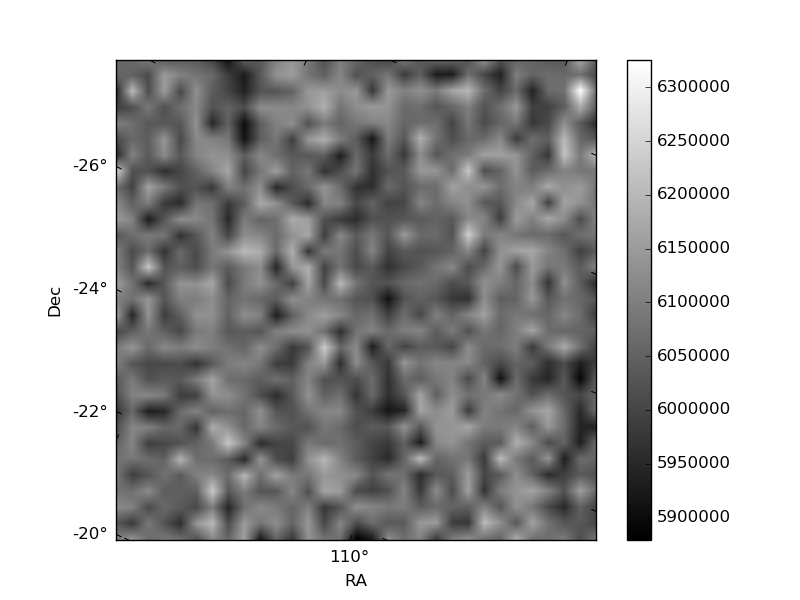
Histogram calculated using DETX and DETY for each event in the final _common_clean file
| Quadrant A | 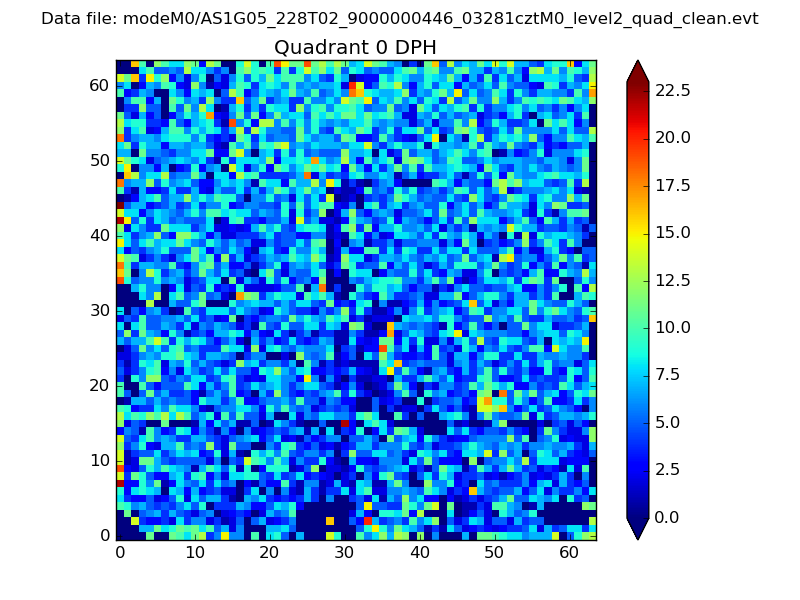 |
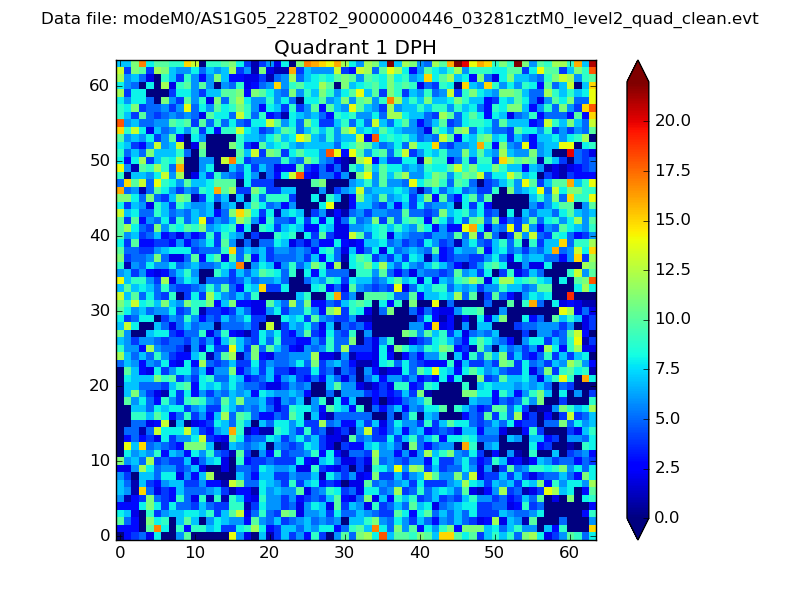 |
Quadrant B |
|---|---|---|---|
| Quadrant D | 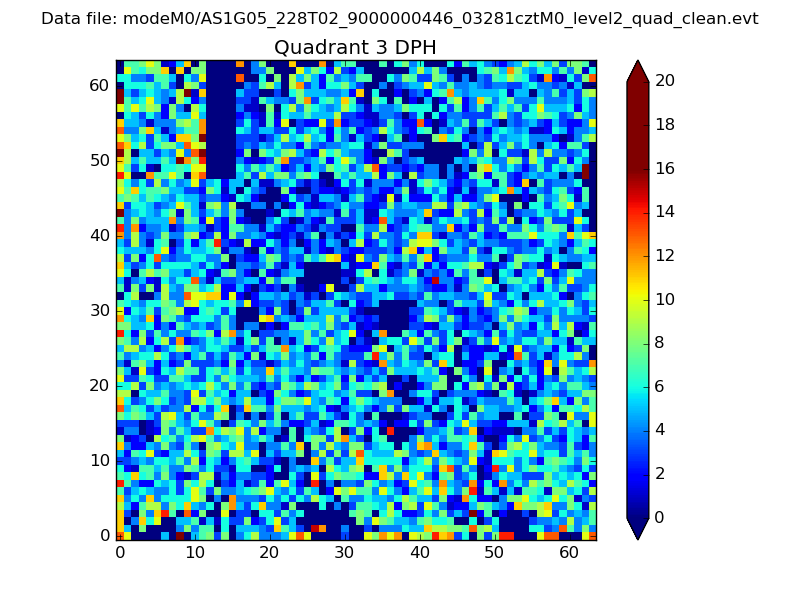 |
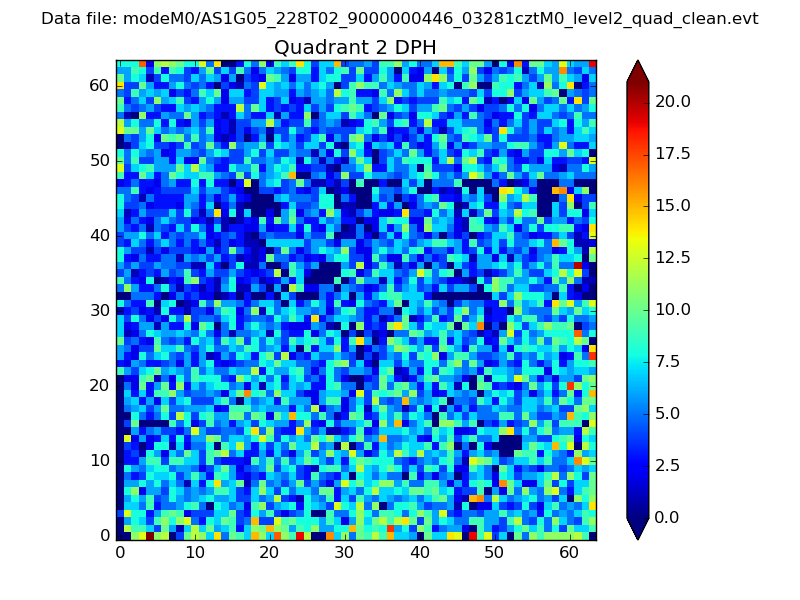 |
Quadrant C |
| Plot type | Count rate plots | Images |
|---|---|---|
| Comparison with Poisson distribution Blue bars denote a histogram of data divided into 1 sec bins. Red curve is a Poisson curve with rate = median count rate of data. |
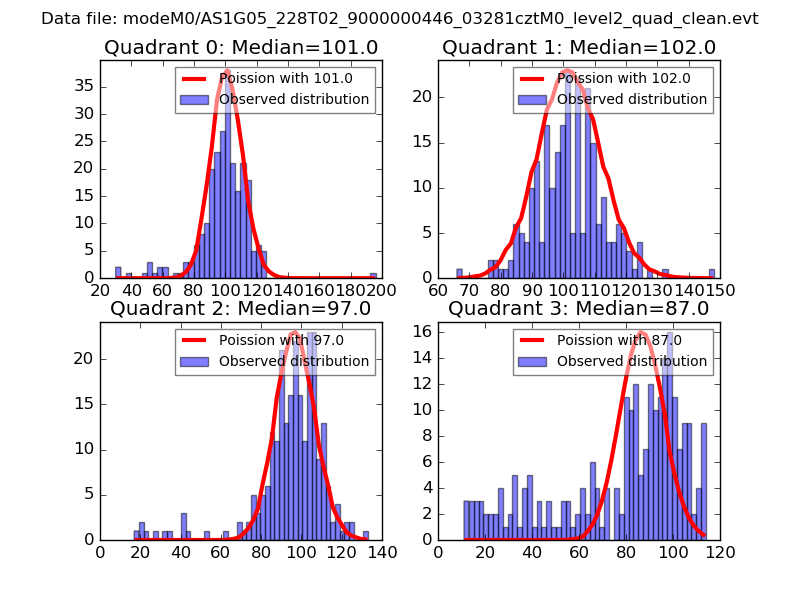 |
 |
| Quadrant-wise count rates Data is divided into 100 sec bins |
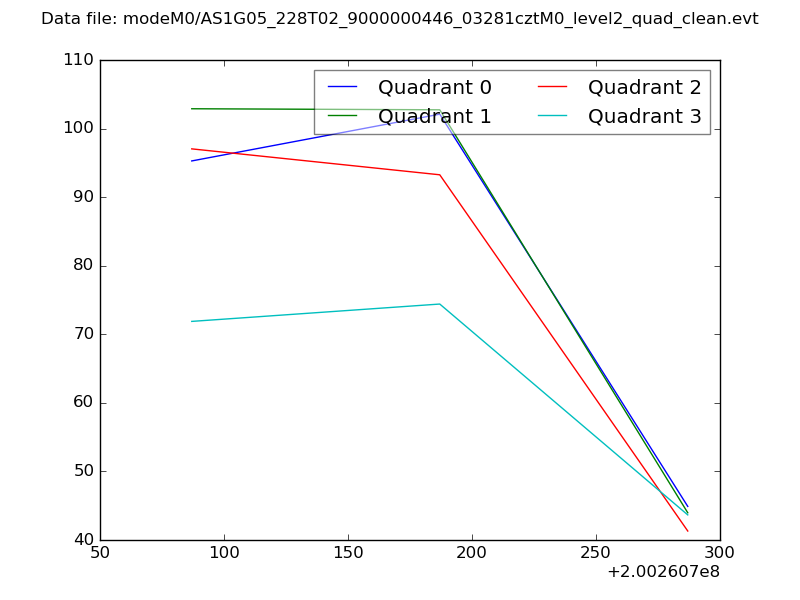 |
|
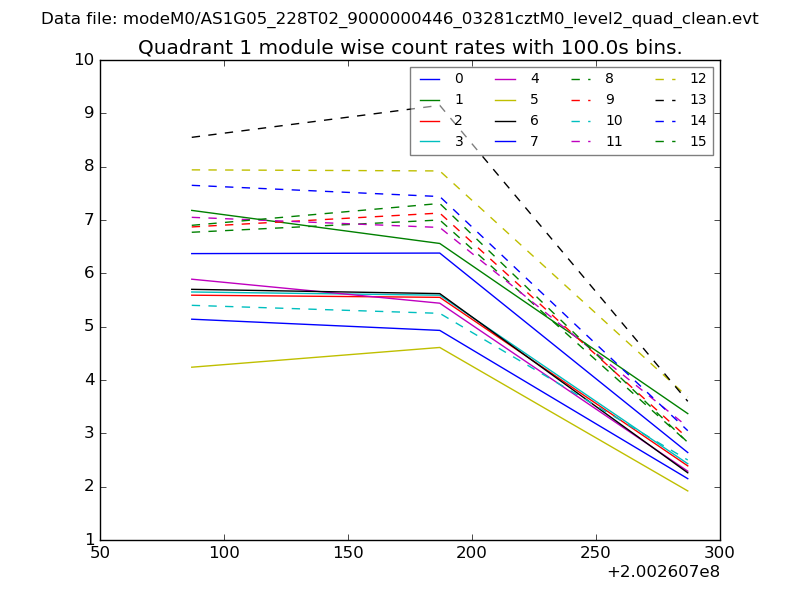
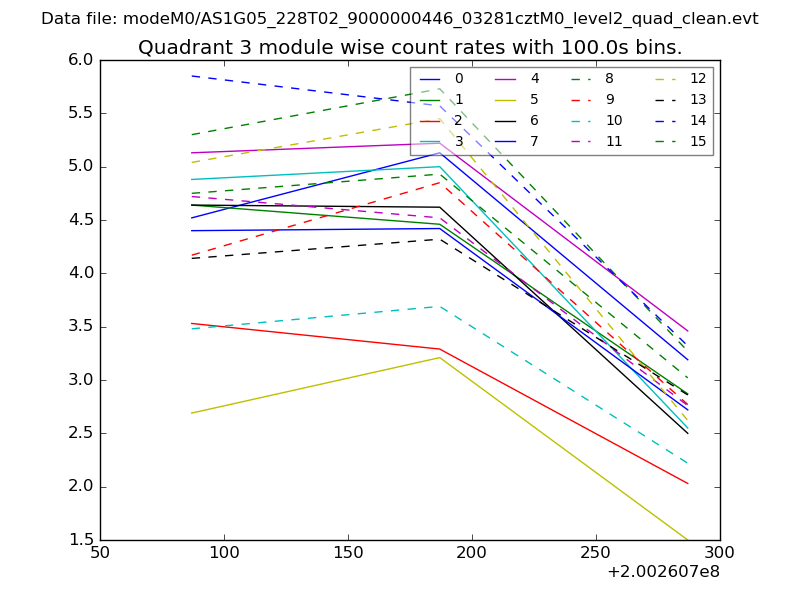
| Module-wise count rates for Quadrant A Data is divided into 100 sec bins |
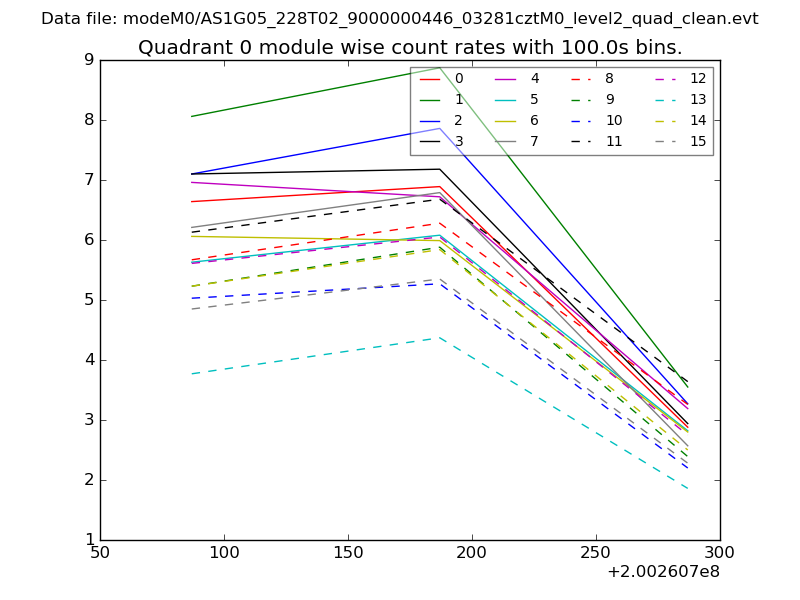 |
 |
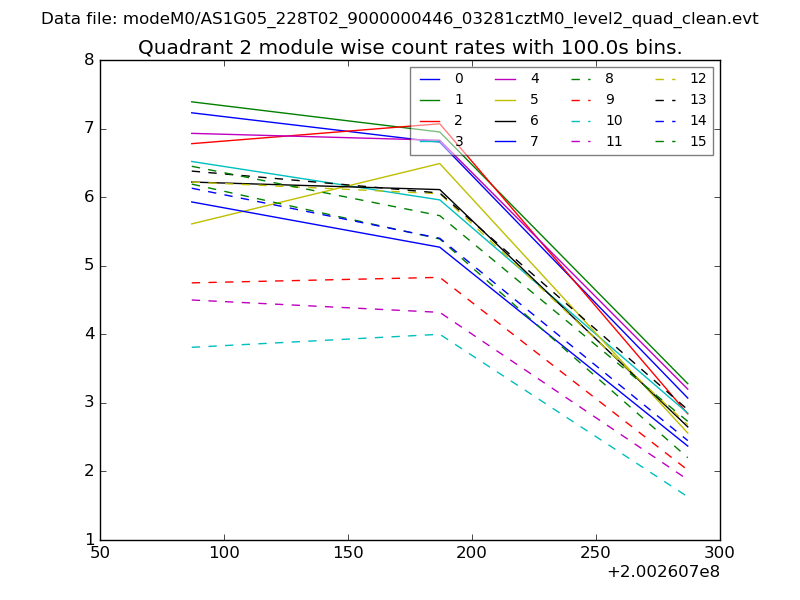
| Module-wise count rates for Quadrant B Data is divided into 100 sec bins |
 |
 |
| Module-wise count rates for Quadrant C Data is divided into 100 sec bins |
 |
 |
| Module-wise count rates for Quadrant D Data is divided into 100 sec bins |
 |
 |
| Parameter | Plot |
|---|---|
| CZT HV Monitor | 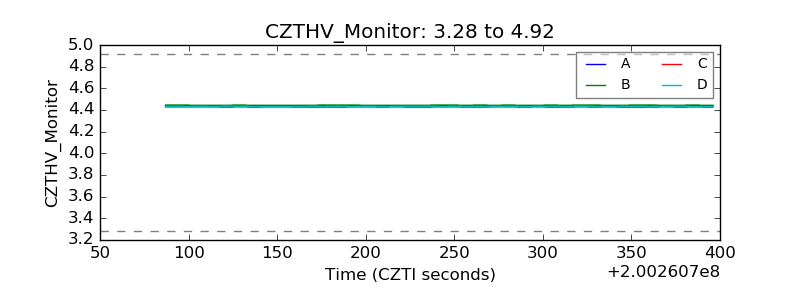 |
| D_VDD | 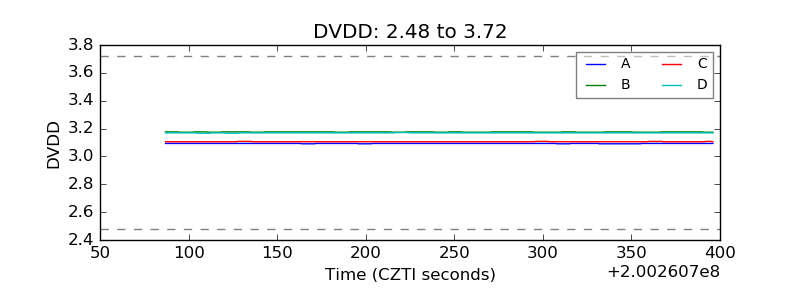 |
| Temperature 1 | 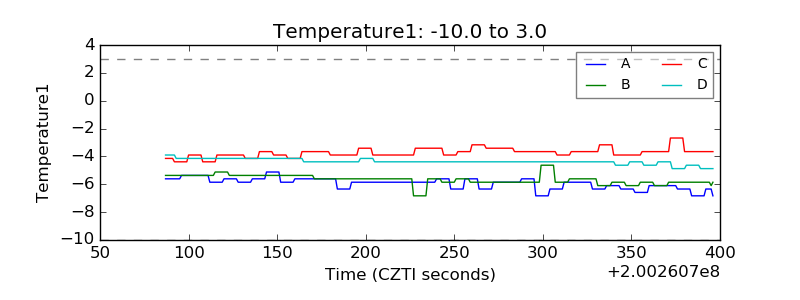 |
| Veto HV Monitor | 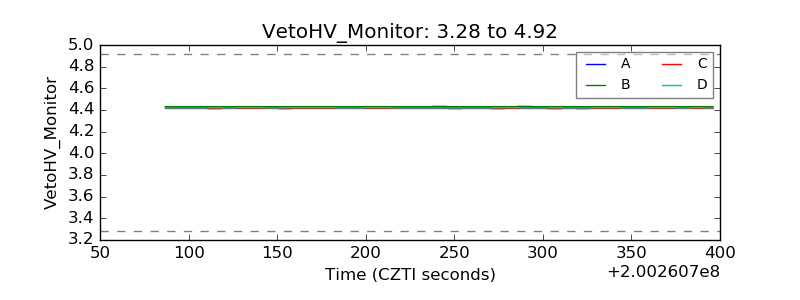 |
| Veto LLD | 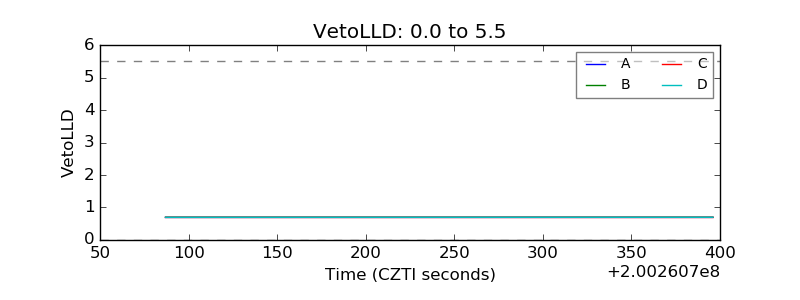 |
| Alpha Counter | 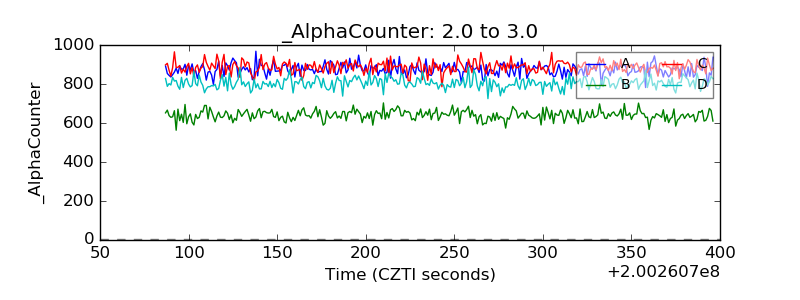 |
| _CPM_Rate | 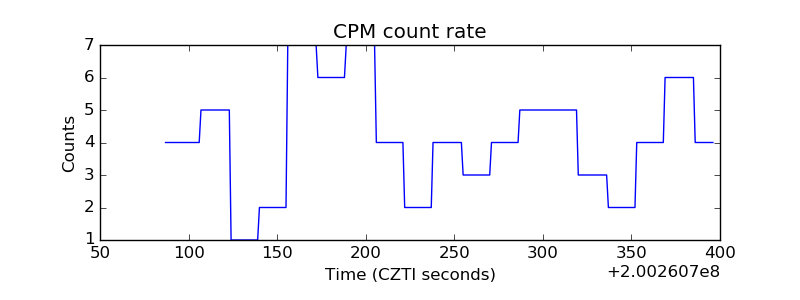 |
| CZT Counter | 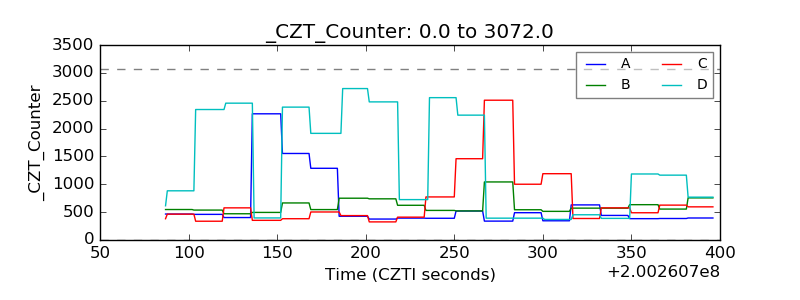 |
| +2.5 Volts monitor |  |
| +5 Volts monitor | 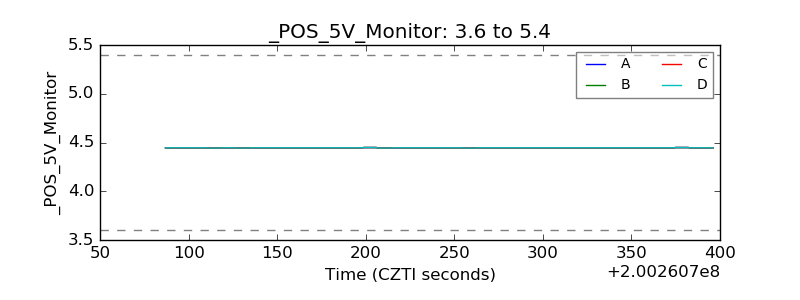 |
| _ROLL_ROT | 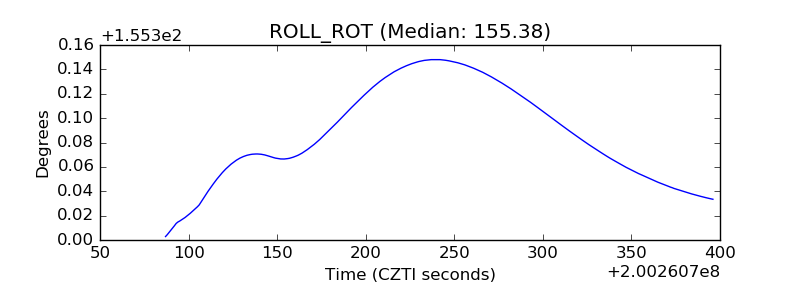 |
| _Roll_DEC | 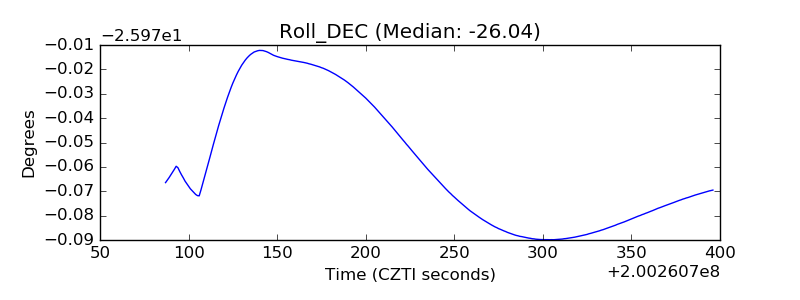 |
| _Roll_RA | 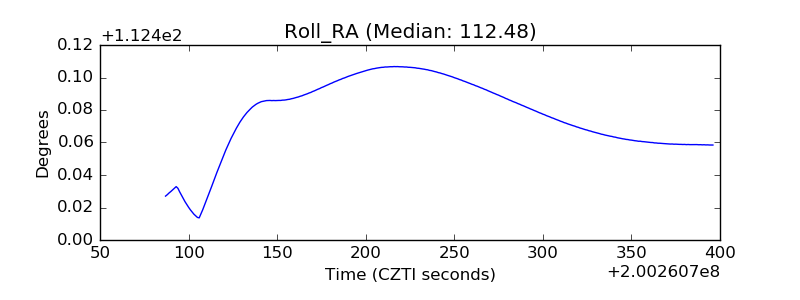 |
| Veto Counter | 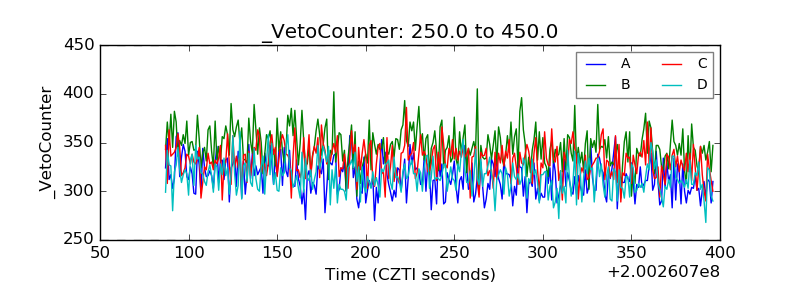 |