| Param | Original file | Final file |
|---|---|---|
| Filename | modeM0/AS1G05_228T02_9000000446_03283cztM0_level2.evt | modeM0/AS1G05_228T02_9000000446_03283cztM0_level2_quad_clean.evt |
| Size (bytes) | 447,186,240 | 58,515,840 |
| Size | 426.5 MB | 55.8 MB |
| Events in quadrant A | 2,789,926 | 351,593 |
| Events in quadrant B | 4,088,685 | 350,803 |
| Events in quadrant C | 3,025,325 | 350,546 |
| Events in quadrant D | 3,268,205 | 336,368 |
| Mode SS | |||
|---|---|---|---|
| Quadrant | BADHDUFLAG | Total packets | Discarded packets |
| A | 0 | 110 | 0 |
| B | 0 | 110 | 0 |
| C | 0 | 110 | 0 |
| D | 0 | 110 | 0 |
| Mode M0 | |||
|---|---|---|---|
| Quadrant | BADHDUFLAG | Total packets | Discarded packets |
| A | 0 | 12074 | 0 |
| B | 0 | 15985 | 0 |
| C | 0 | 12629 | 0 |
| D | 0 | 13685 | 0 |
| Mode M9 | |||
|---|---|---|---|
| Quadrant | BADHDUFLAG | Total packets | Discarded packets |
| A | 0 | 12 | 0 |
| B | 0 | 12 | 0 |
| C | 0 | 12 | 0 |
| D | 0 | 12 | 0 |
| Quadrant | Total seconds | Saturated seconds | Saturation percentage |
|---|---|---|---|
| A | 5465 | 113 | 2.067704% |
| B | 5465 | 158 | 2.891125% |
| C | 5465 | 69 | 1.262580% |
| D | 5465 | 189 | 3.458371% |
Noise dominated data is calculated using 1-second bins in cleaned event files. If a bin has >2000 counts, and if more than 50% of those come from <1% of pixels, then it is considered to be noise-dominated and hence unusable.
| Quadrant | # 1 sec bins | Bins with >0 counts | Bins with >2000 counts | High rate bins dominated by noise | Noise dominated (total time) | Noise dominated (detector-on time) | Marked lightcurve |
|---|---|---|---|---|---|---|---|
| A | 6600 | 5466 | 65 | 65 | 0.98% | 1.19% | 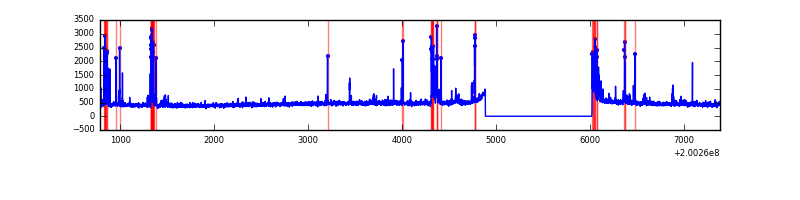 |
| B | 6600 | 5466 | 88 | 88 | 1.33% | 1.61% | 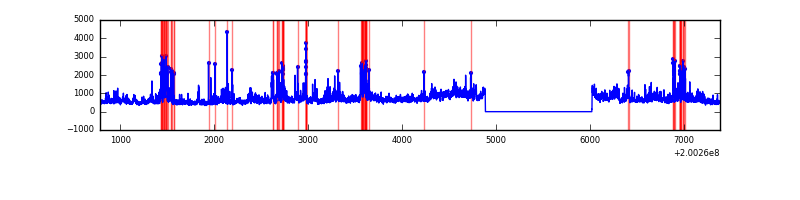 |
| C | 6600 | 5466 | 53 | 53 | 0.80% | 0.97% | 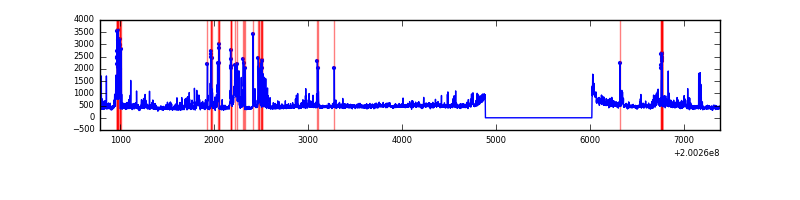 |
| D | 6600 | 5466 | 177 | 177 | 2.68% | 3.24% | 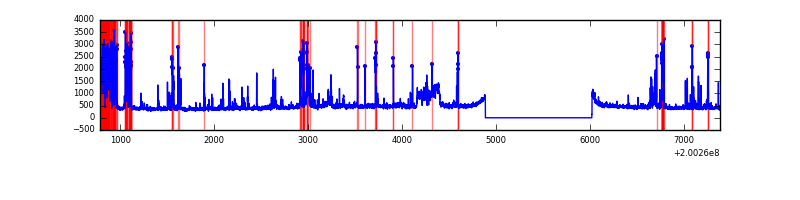 |
Top three noisy pixels from each quadrant. If the there are fewer than three noisy pixels in the level2.evt file, extra rows are filled as -1
| Pixel properties | Quadrant properties | ||||||
|---|---|---|---|---|---|---|---|
| Quadrant | DetID | PixID | Counts | Sigma | Mean | Median | Sigma |
| A | 0 | 50 | 262748 | 2007.99 | 631 | 618 | 130.5 |
| A | 0 | 118 | 62459 | 473.72 | 631 | 618 | 130.5 |
| A | 0 | 31 | 14740 | 108.18 | 631 | 618 | 130.5 |
| B | 15 | 204 | 1090128 | 8631.14 | 640 | 625 | 126.2 |
| B | 2 | 249 | 482208 | 3815.14 | 640 | 625 | 126.2 |
| B | 5 | 200 | 22296 | 171.68 | 640 | 625 | 126.2 |
| C | 1 | 192 | 353894 | 2472.19 | 609 | 612 | 142.9 |
| C | 14 | 223 | 132798 | 925.01 | 609 | 612 | 142.9 |
| C | 12 | 4 | 92705 | 644.45 | 609 | 612 | 142.9 |
| D | 13 | 223 | 735323 | 5013.36 | 601 | 582 | 146.6 |
| D | 7 | 39 | 150408 | 1022.31 | 601 | 582 | 146.6 |
| D | 5 | 233 | 46679 | 314.53 | 601 | 582 | 146.6 |
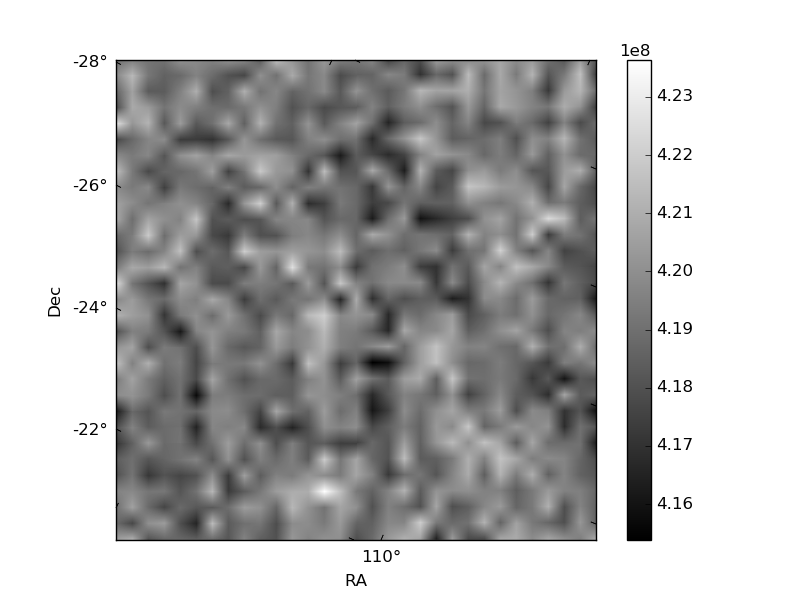
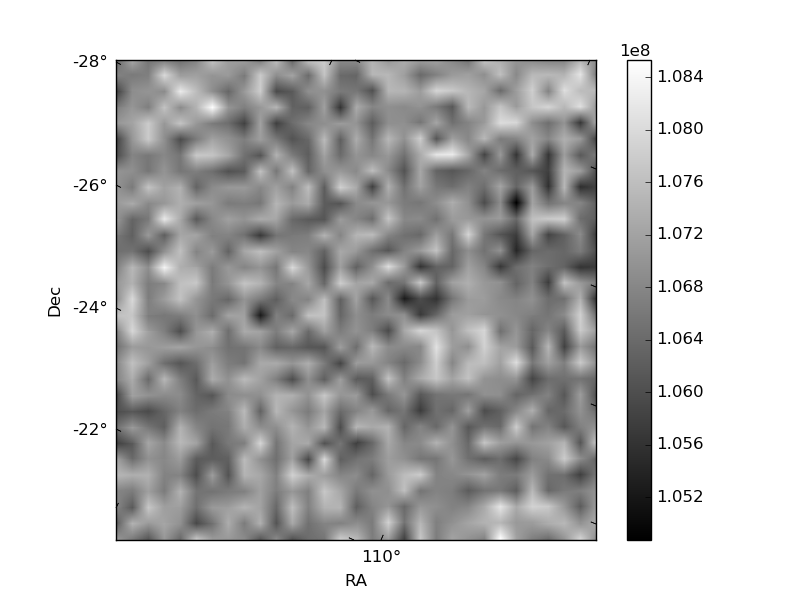
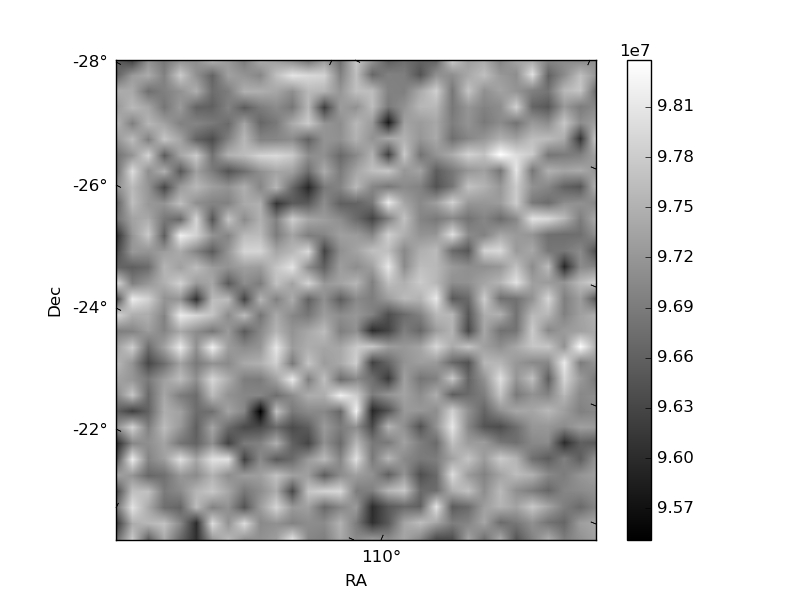
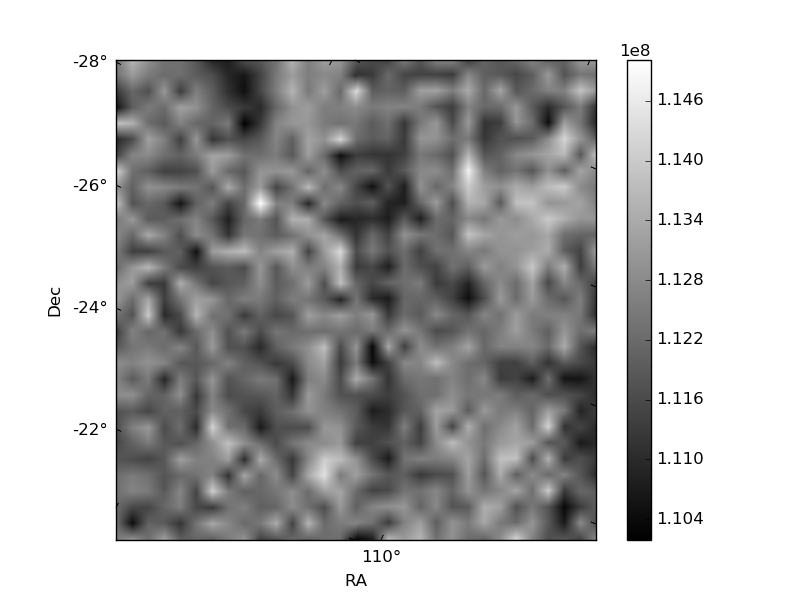
Histogram calculated using DETX and DETY for each event in the final _common_clean file
| Quadrant A | 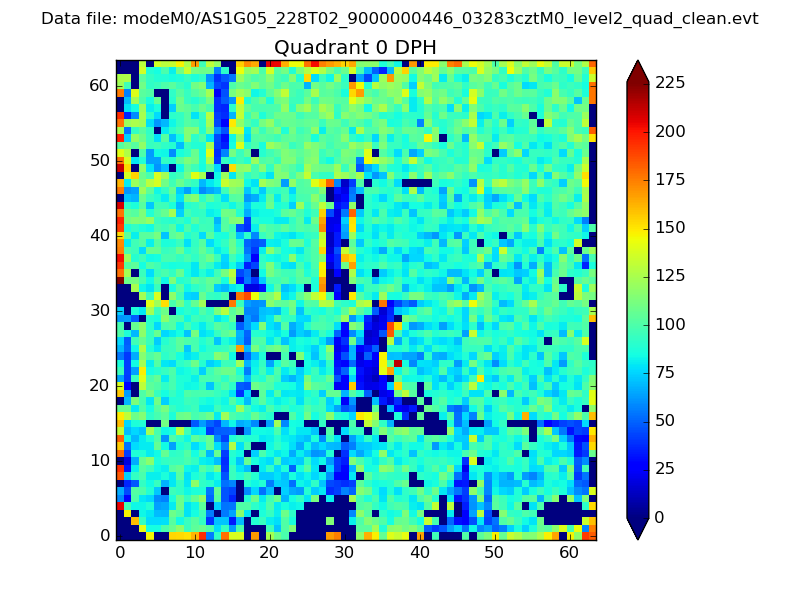 |
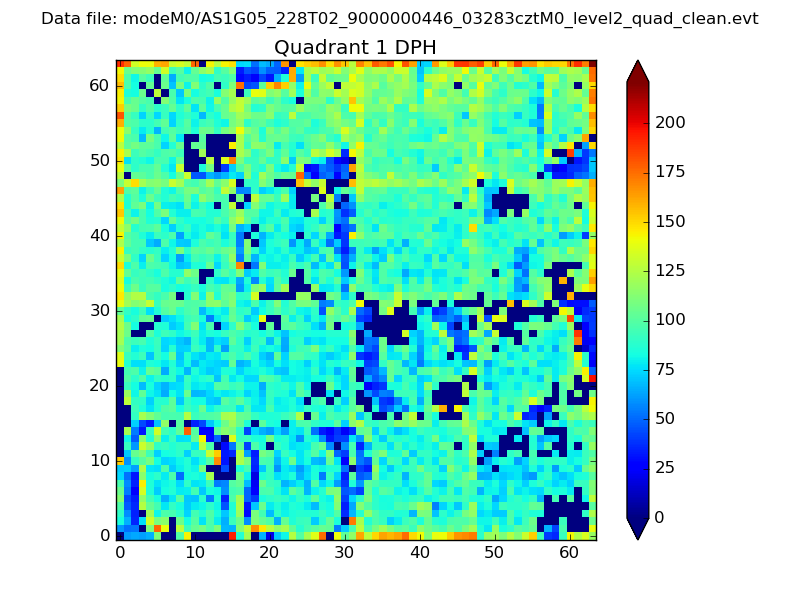 |
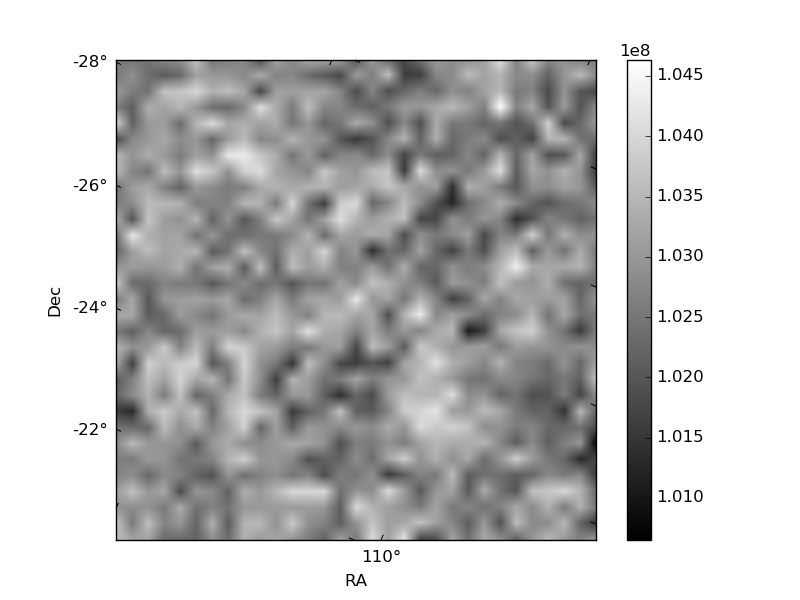
Quadrant B |
|---|---|---|---|
| Quadrant D | 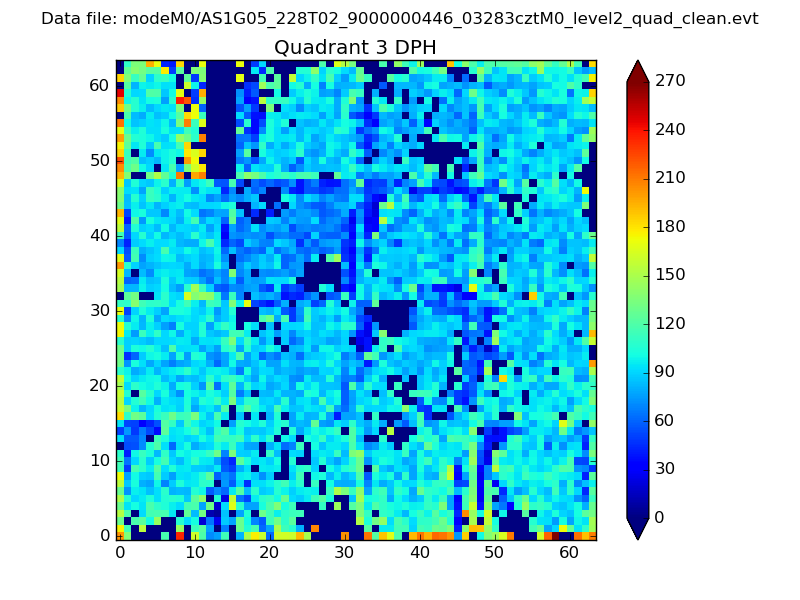 |
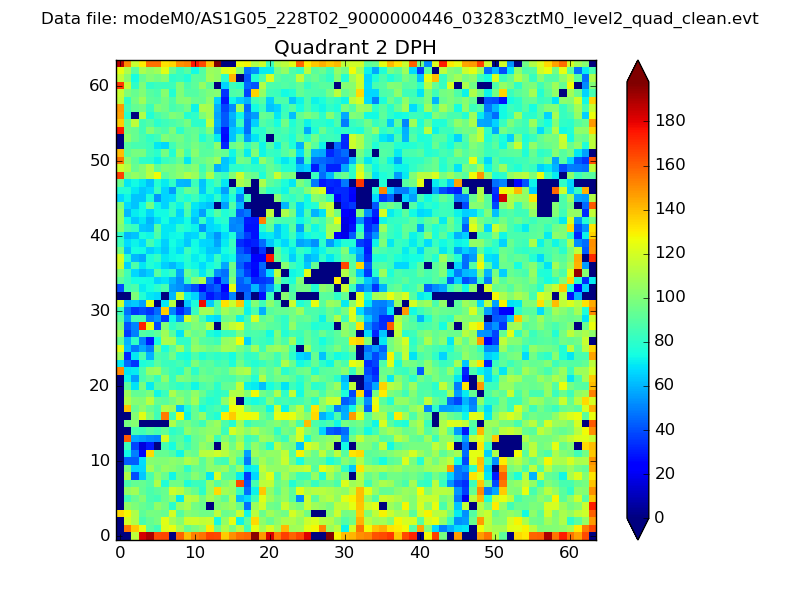 |
Quadrant C |
| Plot type | Count rate plots | Images |
|---|---|---|
| Comparison with Poisson distribution Blue bars denote a histogram of data divided into 1 sec bins. Red curve is a Poisson curve with rate = median count rate of data. |
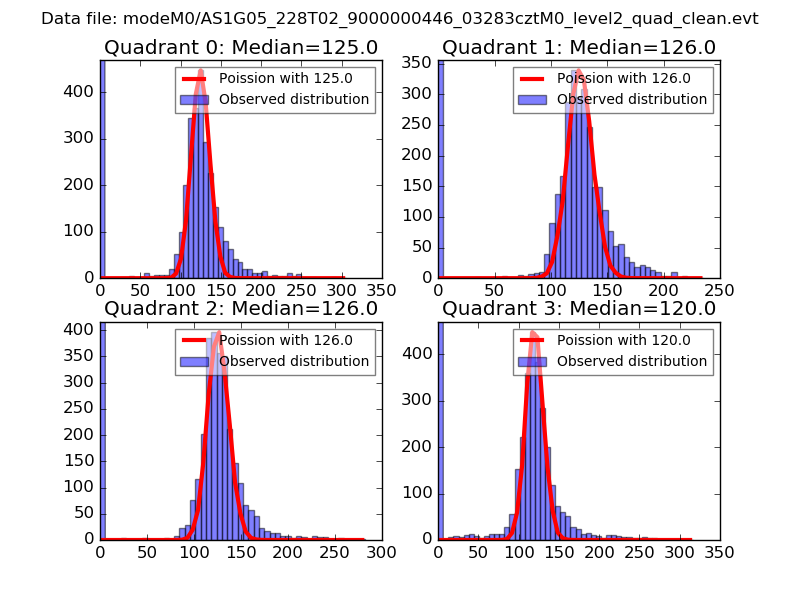 |
 |
| Quadrant-wise count rates Data is divided into 100 sec bins |
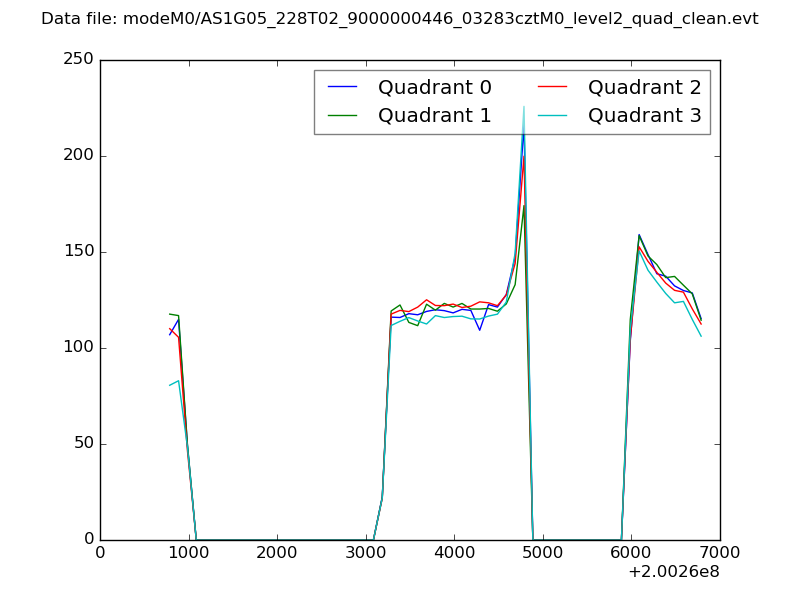 |
|
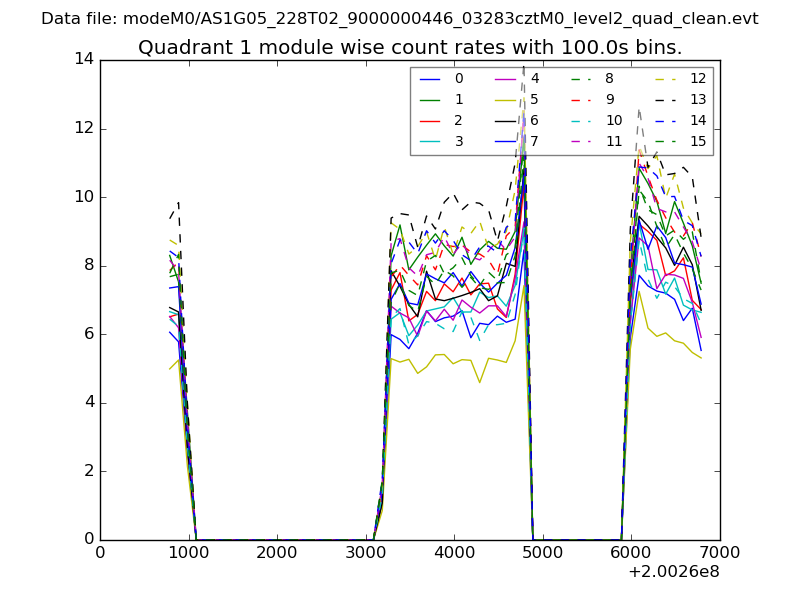
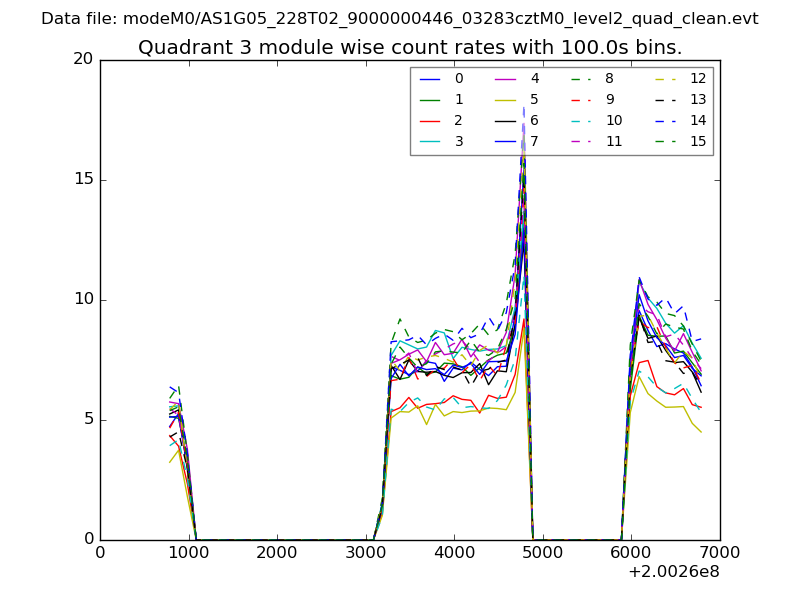
| Module-wise count rates for Quadrant A Data is divided into 100 sec bins |
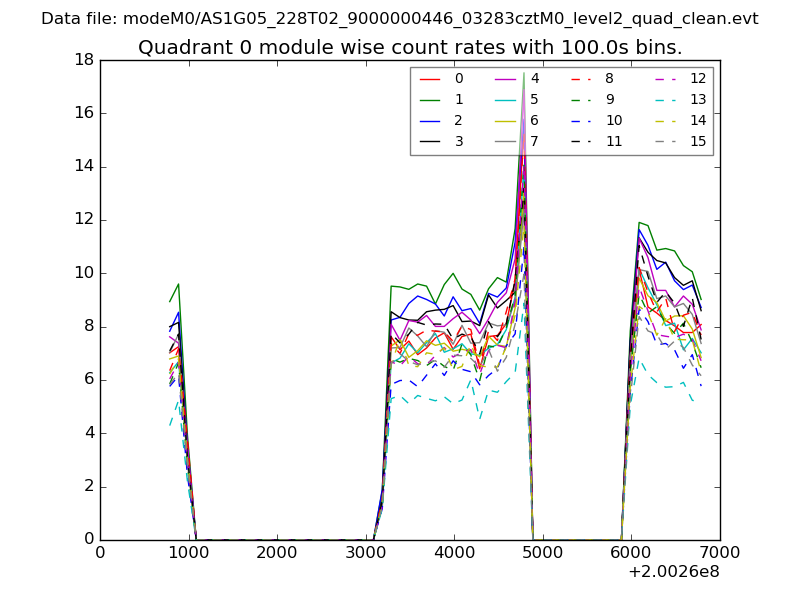 |
 |
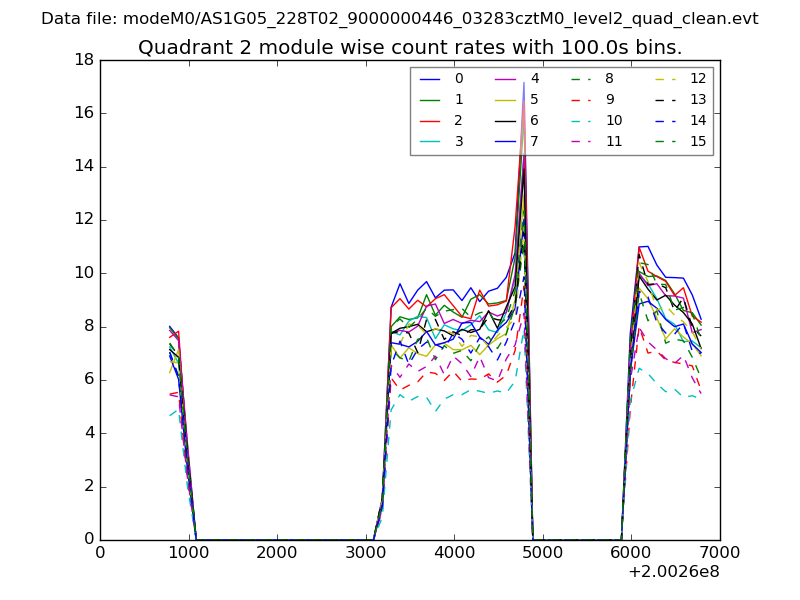
| Module-wise count rates for Quadrant B Data is divided into 100 sec bins |
 |
 |
| Module-wise count rates for Quadrant C Data is divided into 100 sec bins |
 |
 |
| Module-wise count rates for Quadrant D Data is divided into 100 sec bins |
 |
 |
| Parameter | Plot |
|---|---|
| CZT HV Monitor | 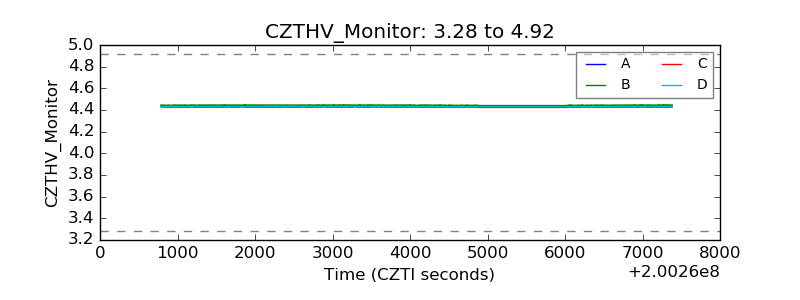 |
| D_VDD | 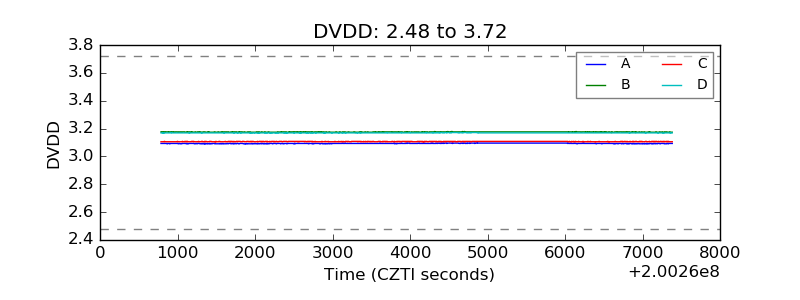 |
| Temperature 1 | 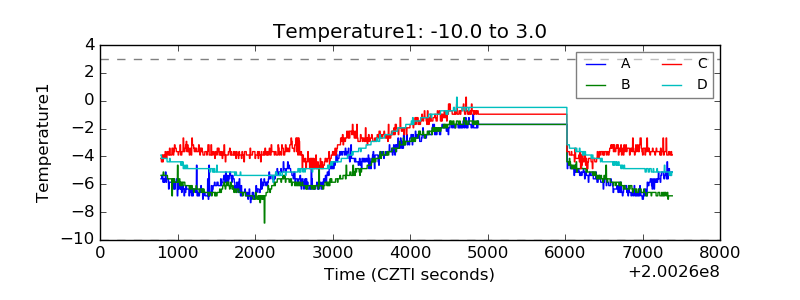 |
| Veto HV Monitor | 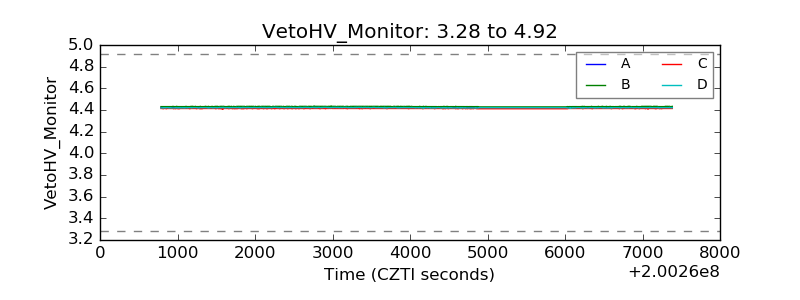 |
| Veto LLD | 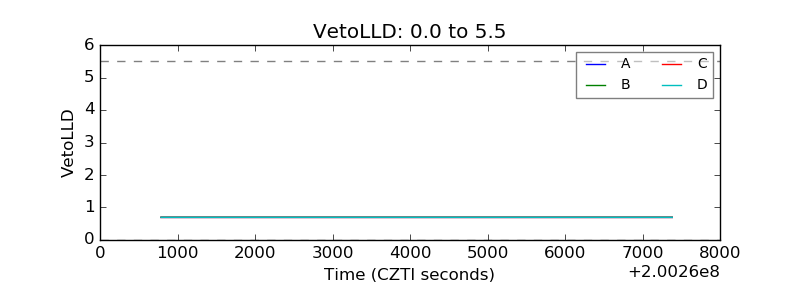 |
| Alpha Counter | 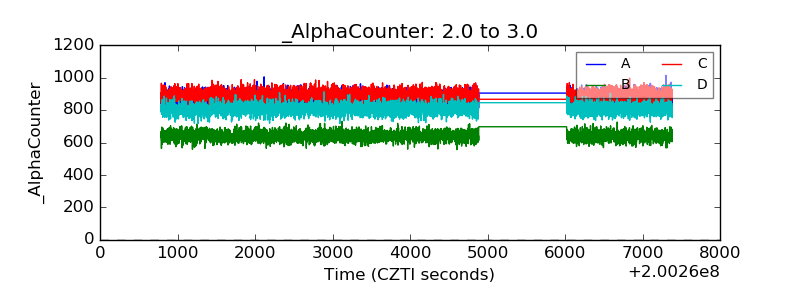 |
| _CPM_Rate | 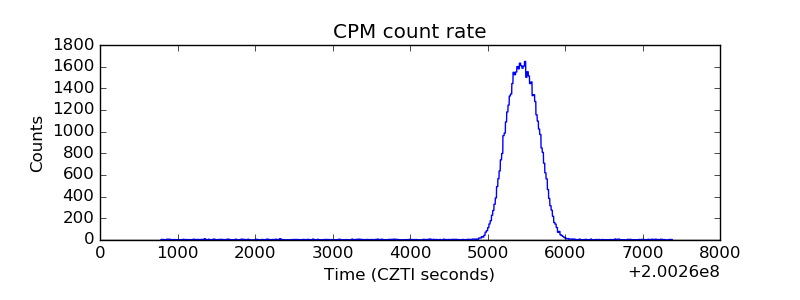 |
| CZT Counter | 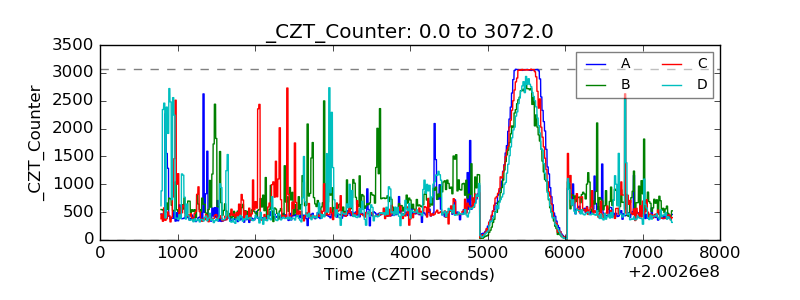 |
| +2.5 Volts monitor |  |
| +5 Volts monitor |  |
| _ROLL_ROT | 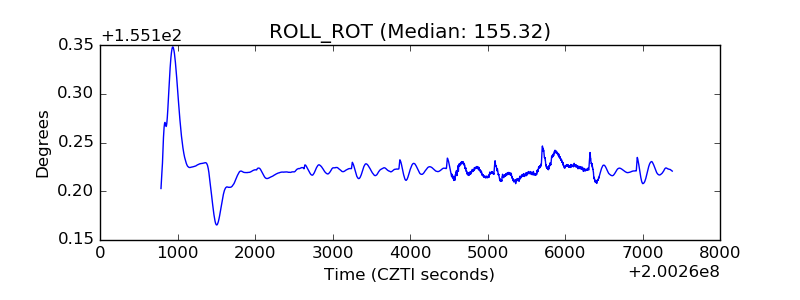 |
| _Roll_DEC | 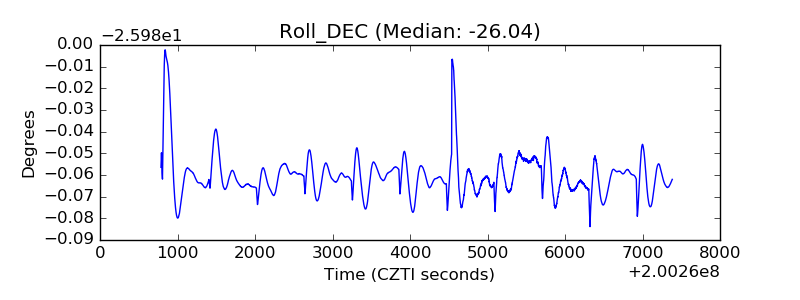 |
| _Roll_RA | 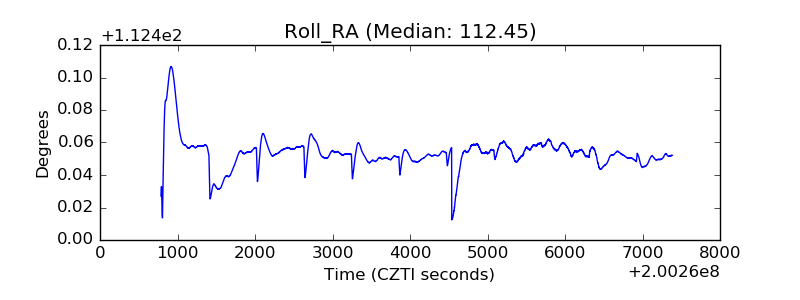 |
| Veto Counter | 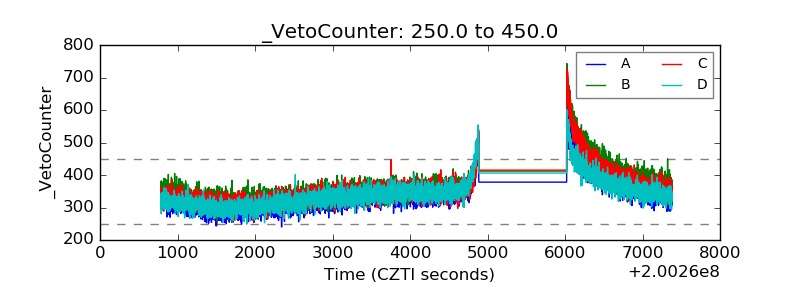 |