| Param | Original file | Final file |
|---|---|---|
| Filename | modeM0/AS1G05_228T02_9000000446_03284cztM0_level2.evt | modeM0/AS1G05_228T02_9000000446_03284cztM0_level2_quad_clean.evt |
| Size (bytes) | 511,666,560 | 68,748,480 |
| Size | 488.0 MB | 65.6 MB |
| Events in quadrant A | 3,355,021 | 415,106 |
| Events in quadrant B | 4,791,751 | 402,343 |
| Events in quadrant C | 3,457,504 | 405,330 |
| Events in quadrant D | 3,446,401 | 401,066 |
| Mode SS | |||
|---|---|---|---|
| Quadrant | BADHDUFLAG | Total packets | Discarded packets |
| A | 0 | 132 | 0 |
| B | 0 | 132 | 0 |
| C | 0 | 132 | 0 |
| D | 0 | 132 | 0 |
| Mode M0 | |||
|---|---|---|---|
| Quadrant | BADHDUFLAG | Total packets | Discarded packets |
| A | 0 | 14235 | 3 |
| B | 0 | 18692 | 2 |
| C | 0 | 14645 | 2 |
| D | 0 | 14779 | 2 |
| Mode M9 | |||
|---|---|---|---|
| Quadrant | BADHDUFLAG | Total packets | Discarded packets |
| A | 0 | 25 | 0 |
| B | 0 | 25 | 0 |
| C | 0 | 25 | 0 |
| D | 0 | 25 | 0 |
| Quadrant | Total seconds | Saturated seconds | Saturation percentage |
|---|---|---|---|
| A | 6572 | 84 | 1.278150% |
| B | 6572 | 323 | 4.914790% |
| C | 6572 | 74 | 1.125989% |
| D | 6572 | 73 | 1.110773% |
Noise dominated data is calculated using 1-second bins in cleaned event files. If a bin has >2000 counts, and if more than 50% of those come from <1% of pixels, then it is considered to be noise-dominated and hence unusable.
| Quadrant | # 1 sec bins | Bins with >0 counts | Bins with >2000 counts | High rate bins dominated by noise | Noise dominated (total time) | Noise dominated (detector-on time) | Marked lightcurve |
|---|---|---|---|---|---|---|---|
| A | 8967 | 6574 | 40 | 40 | 0.45% | 0.61% | 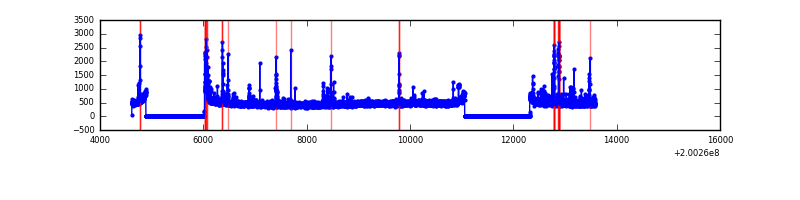 |
| B | 8967 | 6574 | 203 | 203 | 2.26% | 3.09% | 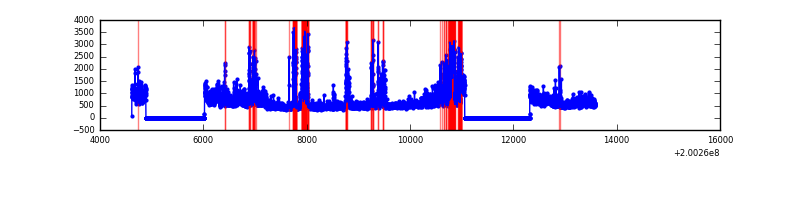 |
| C | 8967 | 6574 | 36 | 36 | 0.40% | 0.55% |  |
| D | 8967 | 6574 | 58 | 58 | 0.65% | 0.88% | 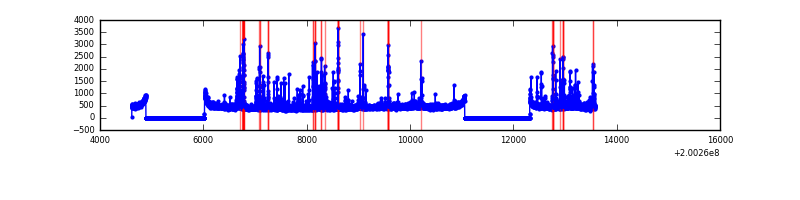 |
Top three noisy pixels from each quadrant. If the there are fewer than three noisy pixels in the level2.evt file, extra rows are filled as -1
| Pixel properties | Quadrant properties | ||||||
|---|---|---|---|---|---|---|---|
| Quadrant | DetID | PixID | Counts | Sigma | Mean | Median | Sigma |
| A | 0 | 50 | 145803 | 895.02 | 793 | 777 | 162.0 |
| A | 0 | 118 | 62871 | 383.21 | 793 | 777 | 162.0 |
| A | 14 | 249 | 58589 | 356.78 | 793 | 777 | 162.0 |
| B | 15 | 204 | 759847 | 4956.63 | 797 | 780 | 153.1 |
| B | 2 | 249 | 506848 | 3304.57 | 797 | 780 | 153.1 |
| B | 14 | 167 | 385760 | 2513.88 | 797 | 780 | 153.1 |
| C | 14 | 223 | 310621 | 1743.09 | 763 | 767 | 177.8 |
| C | 6 | 80 | 60287 | 334.83 | 763 | 767 | 177.8 |
| C | 1 | 16 | 59069 | 327.98 | 763 | 767 | 177.8 |
| D | 13 | 223 | 285116 | 1568.51 | 757 | 736 | 181.3 |
| D | 13 | 239 | 162296 | 891.09 | 757 | 736 | 181.3 |
| D | 5 | 233 | 90447 | 494.8 | 757 | 736 | 181.3 |
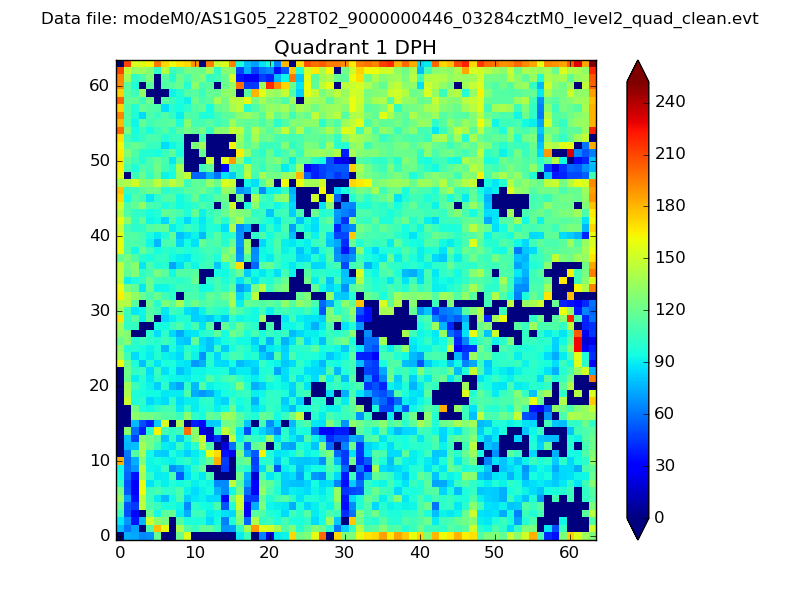
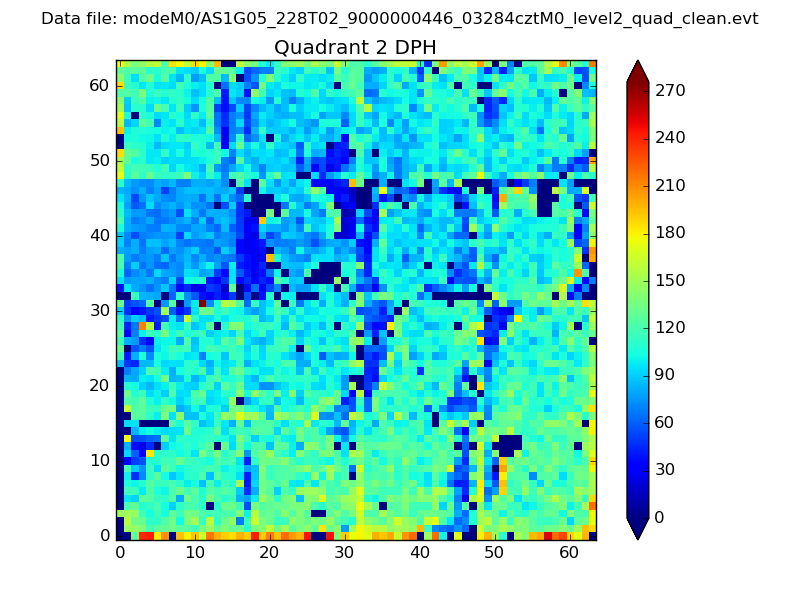
Histogram calculated using DETX and DETY for each event in the final _common_clean file
| Quadrant A | 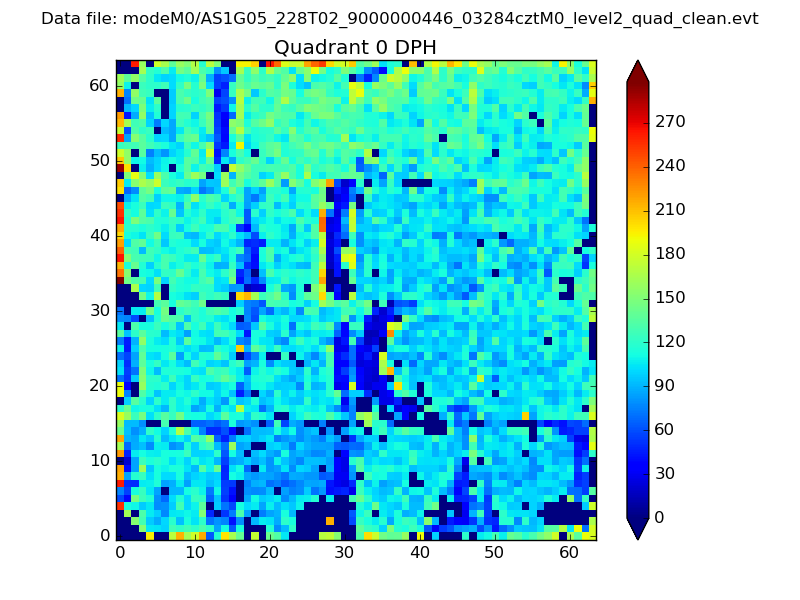 |
 |
Quadrant B |
|---|---|---|---|
| Quadrant D | 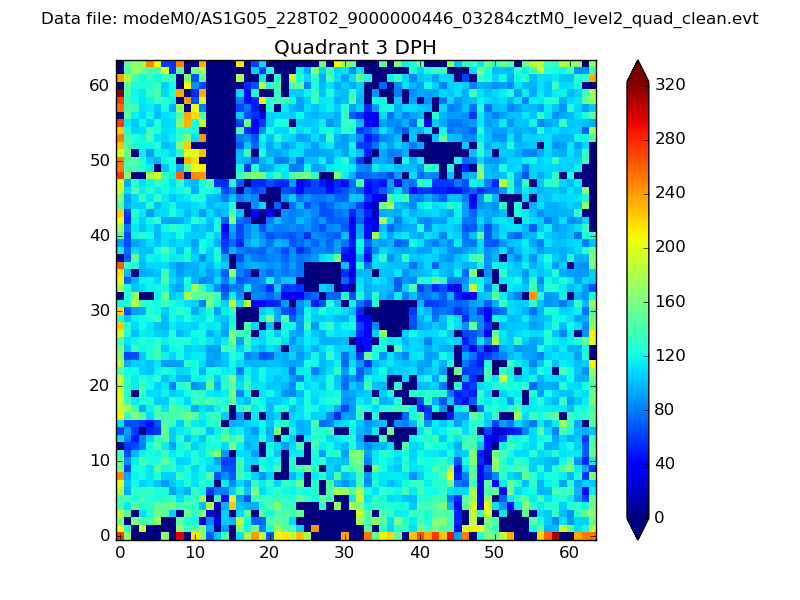 |
 |
Quadrant C |
| Plot type | Count rate plots | Images |
|---|---|---|
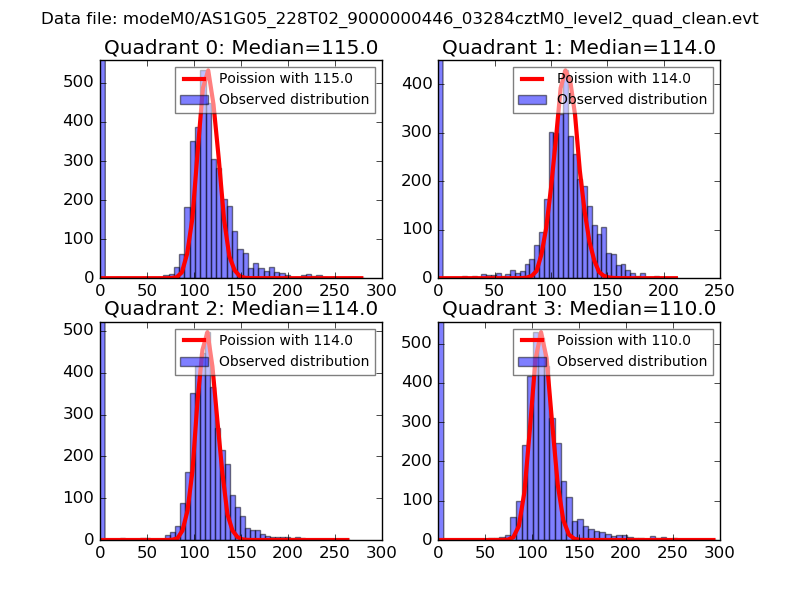
| Comparison with Poisson distribution Blue bars denote a histogram of data divided into 1 sec bins. Red curve is a Poisson curve with rate = median count rate of data. |
 |
 |
| Quadrant-wise count rates Data is divided into 100 sec bins |
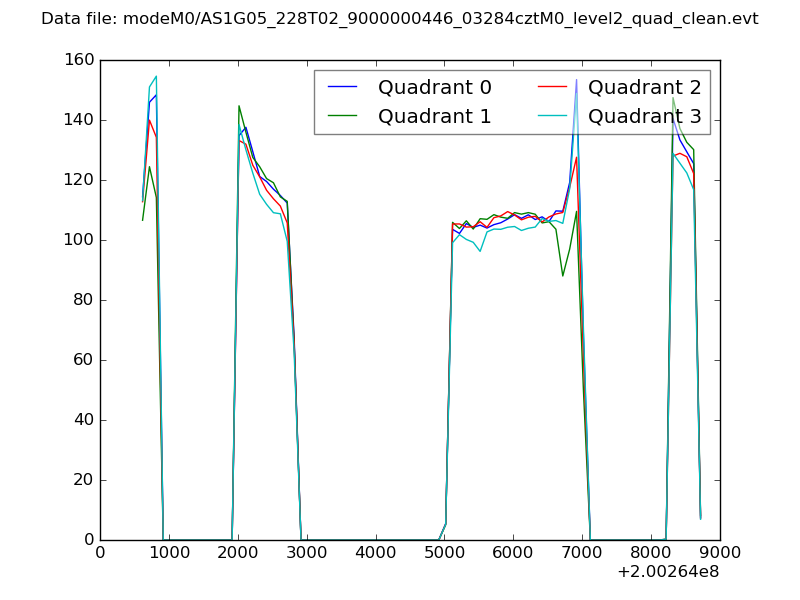 |
|
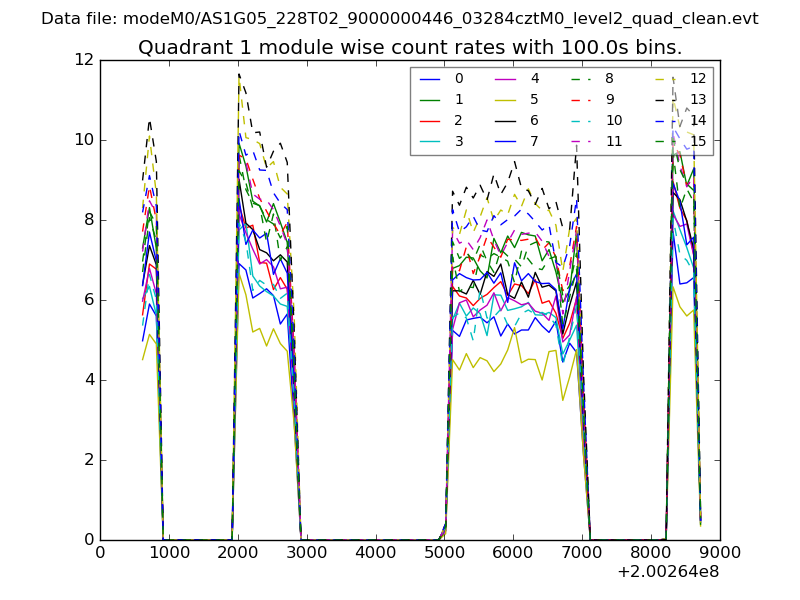
| Module-wise count rates for Quadrant A Data is divided into 100 sec bins |
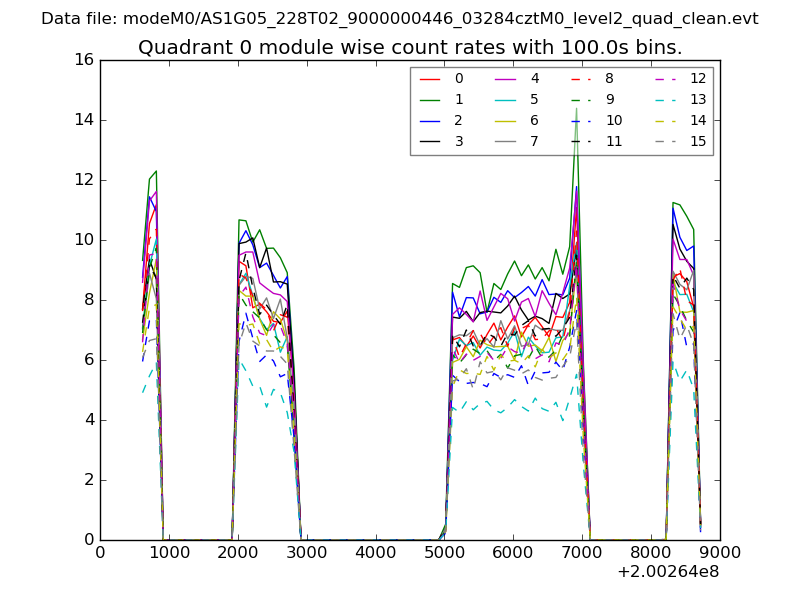 |
 |
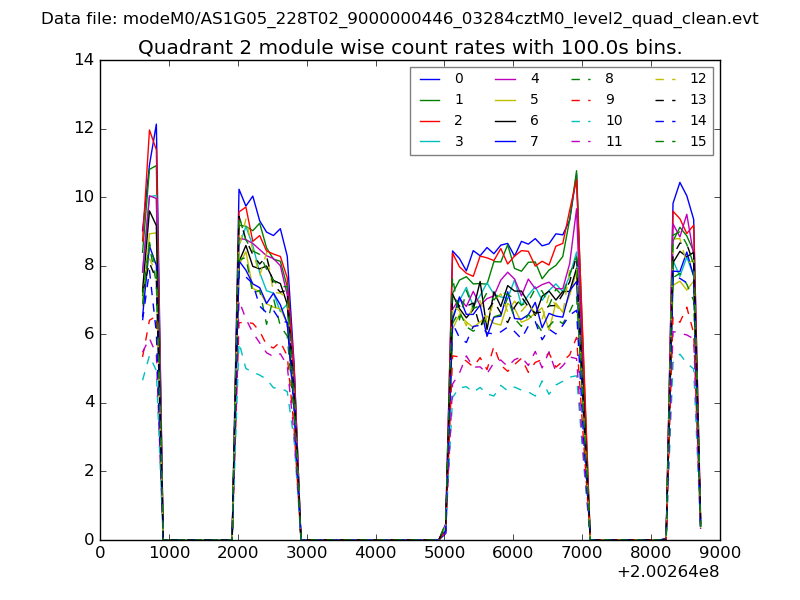
| Module-wise count rates for Quadrant B Data is divided into 100 sec bins |
 |
 |
| Module-wise count rates for Quadrant C Data is divided into 100 sec bins |
 |
 |
| Module-wise count rates for Quadrant D Data is divided into 100 sec bins |
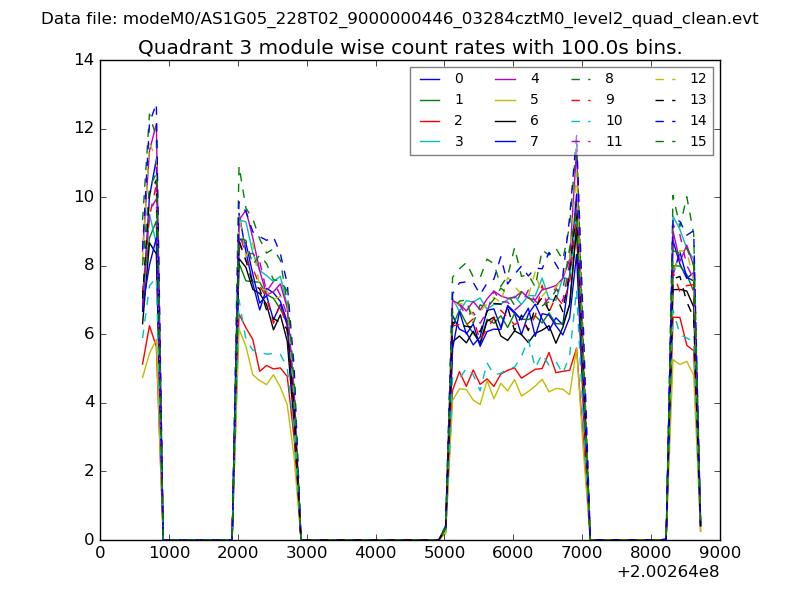 |
 |
| Parameter | Plot |
|---|---|
| CZT HV Monitor | 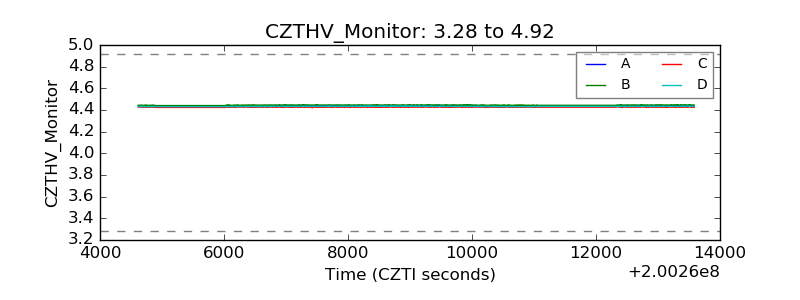 |
| D_VDD | 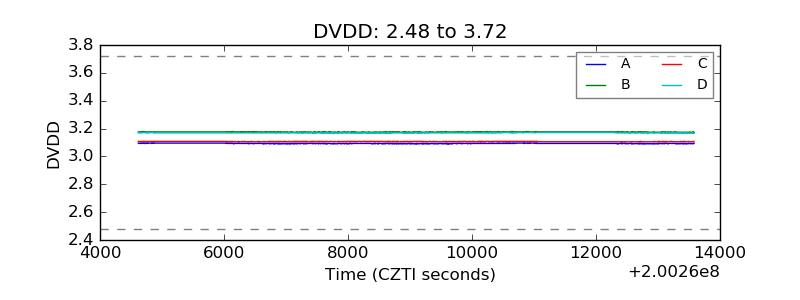 |
| Temperature 1 | 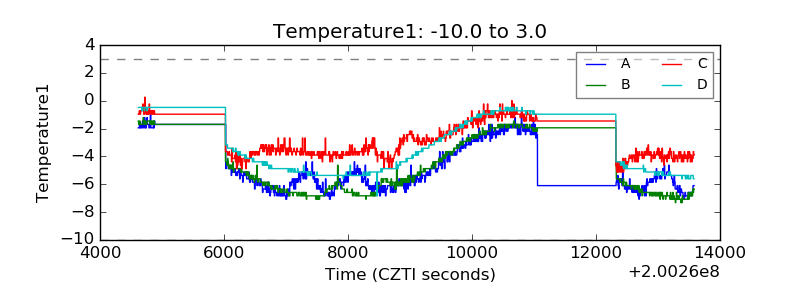 |
| Veto HV Monitor | 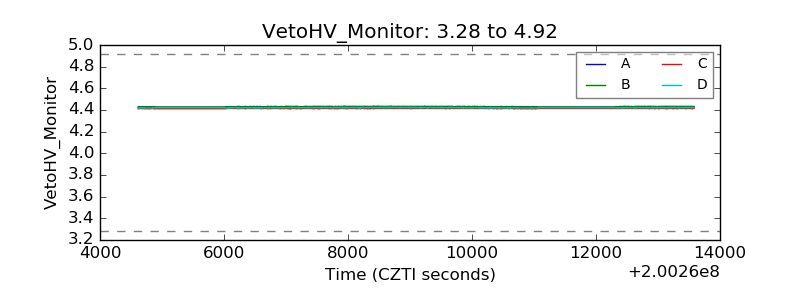 |
| Veto LLD | 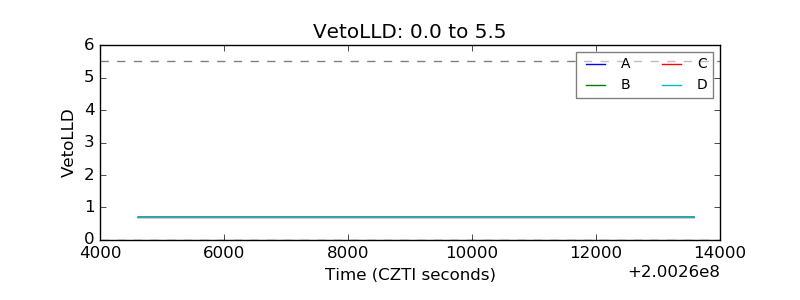 |
| Alpha Counter | 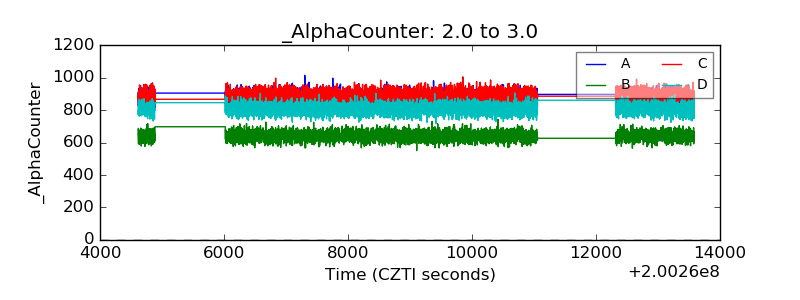 |
| _CPM_Rate | 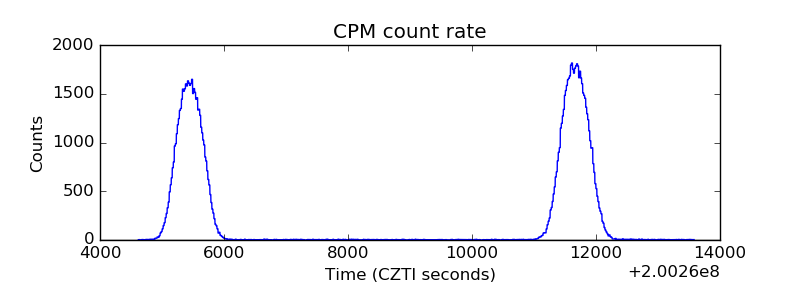 |
| CZT Counter | 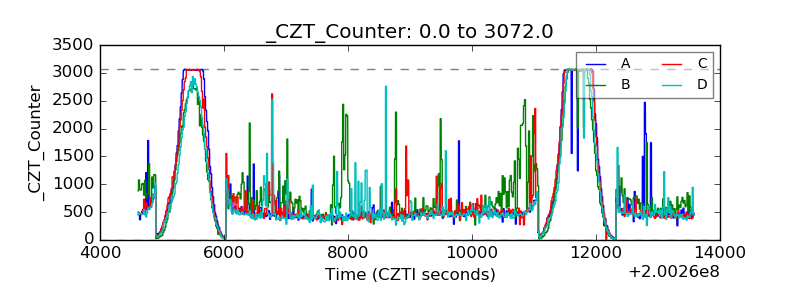 |
| +2.5 Volts monitor |  |
| +5 Volts monitor |  |
| _ROLL_ROT | 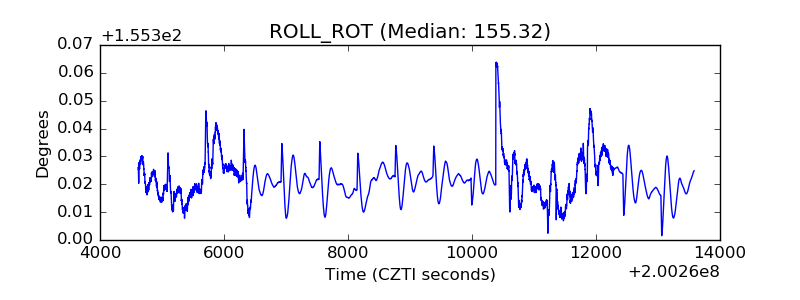 |
| _Roll_DEC | 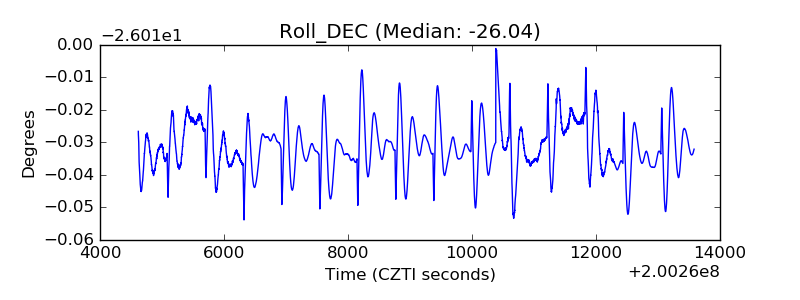 |
| _Roll_RA | 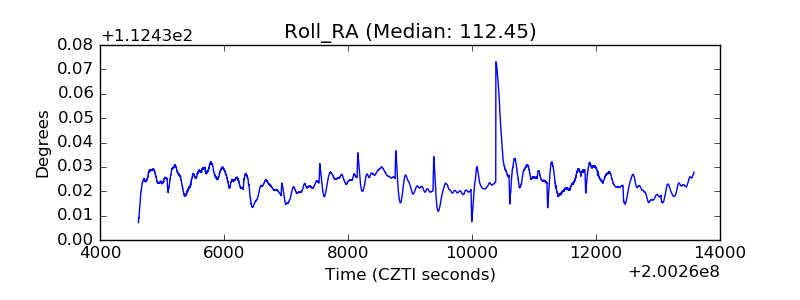 |
| Veto Counter | 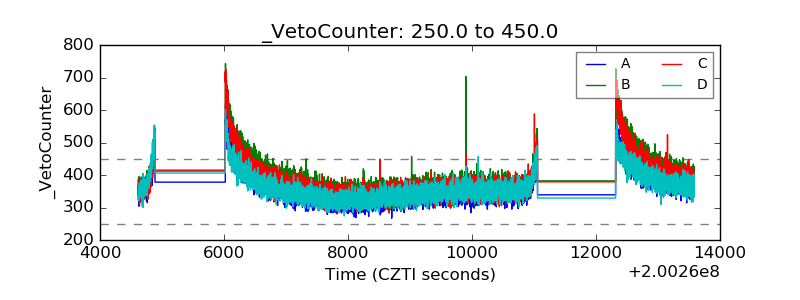 |