| Param | Original file | Final file |
|---|---|---|
| Filename | modeM0/AS1G05_228T02_9000000446_03285cztM0_level2.evt | modeM0/AS1G05_228T02_9000000446_03285cztM0_level2_quad_clean.evt |
| Size (bytes) | 533,937,600 | 55,379,520 |
| Size | 509.2 MB | 52.8 MB |
| Events in quadrant A | 3,263,362 | 313,575 |
| Events in quadrant B | 4,576,588 | 315,387 |
| Events in quadrant C | 4,599,771 | 308,812 |
| Events in quadrant D | 3,307,235 | 302,451 |
| Mode SS | |||
|---|---|---|---|
| Quadrant | BADHDUFLAG | Total packets | Discarded packets |
| A | 0 | 126 | 0 |
| B | 0 | 126 | 0 |
| C | 0 | 126 | 0 |
| D | 0 | 126 | 0 |
| Mode M0 | |||
|---|---|---|---|
| Quadrant | BADHDUFLAG | Total packets | Discarded packets |
| A | 0 | 13675 | 3 |
| B | 0 | 17752 | 2 |
| C | 0 | 17928 | 2 |
| D | 0 | 14108 | 2 |
| Mode M9 | |||
|---|---|---|---|
| Quadrant | BADHDUFLAG | Total packets | Discarded packets |
| A | 0 | 18 | 0 |
| B | 0 | 18 | 0 |
| C | 0 | 18 | 0 |
| D | 0 | 19 | 0 |
| Quadrant | Total seconds | Saturated seconds | Saturation percentage |
|---|---|---|---|
| A | 6254 | 87 | 1.391110% |
| B | 6254 | 290 | 4.637032% |
| C | 6254 | 198 | 3.165974% |
| D | 6254 | 95 | 1.519028% |
Noise dominated data is calculated using 1-second bins in cleaned event files. If a bin has >2000 counts, and if more than 50% of those come from <1% of pixels, then it is considered to be noise-dominated and hence unusable.
| Quadrant | # 1 sec bins | Bins with >0 counts | Bins with >2000 counts | High rate bins dominated by noise | Noise dominated (total time) | Noise dominated (detector-on time) | Marked lightcurve |
|---|---|---|---|---|---|---|---|
| A | 7499 | 6255 | 36 | 36 | 0.48% | 0.58% | 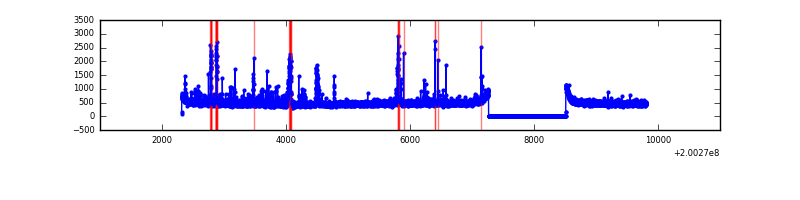 |
| B | 7499 | 6255 | 145 | 145 | 1.93% | 2.32% | 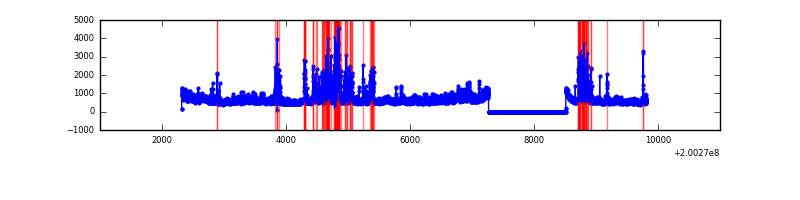 |
| C | 7499 | 6255 | 137 | 137 | 1.83% | 2.19% | 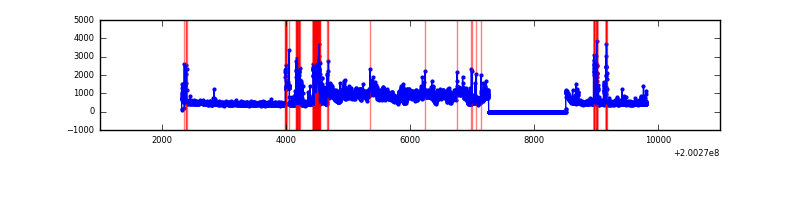 |
| D | 7499 | 6255 | 70 | 70 | 0.93% | 1.12% | 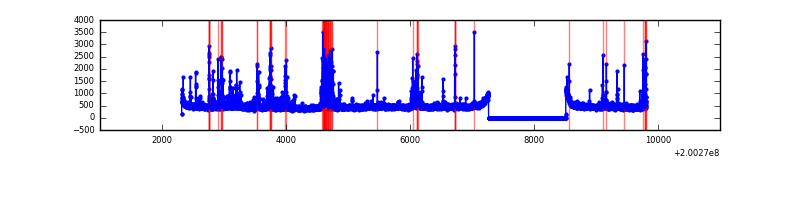 |
Top three noisy pixels from each quadrant. If the there are fewer than three noisy pixels in the level2.evt file, extra rows are filled as -1
| Pixel properties | Quadrant properties | ||||||
|---|---|---|---|---|---|---|---|
| Quadrant | DetID | PixID | Counts | Sigma | Mean | Median | Sigma |
| A | 0 | 50 | 143275 | 920.14 | 766 | 750 | 154.9 |
| A | 14 | 249 | 66672 | 425.59 | 766 | 750 | 154.9 |
| A | 0 | 118 | 50317 | 320.0 | 766 | 750 | 154.9 |
| B | 2 | 249 | 836666 | 5639.64 | 770 | 752 | 148.2 |
| B | 15 | 204 | 701546 | 4728.03 | 770 | 752 | 148.2 |
| B | 5 | 200 | 20569 | 133.7 | 770 | 752 | 148.2 |
| C | 14 | 223 | 1641583 | 9575.2 | 736 | 739 | 171.4 |
| C | 6 | 80 | 49084 | 282.12 | 736 | 739 | 171.4 |
| C | 1 | 192 | 19017 | 106.66 | 736 | 739 | 171.4 |
| D | 13 | 239 | 246682 | 1391.33 | 731 | 709 | 176.8 |
| D | 13 | 223 | 196160 | 1105.56 | 731 | 709 | 176.8 |
| D | 5 | 233 | 47874 | 266.79 | 731 | 709 | 176.8 |
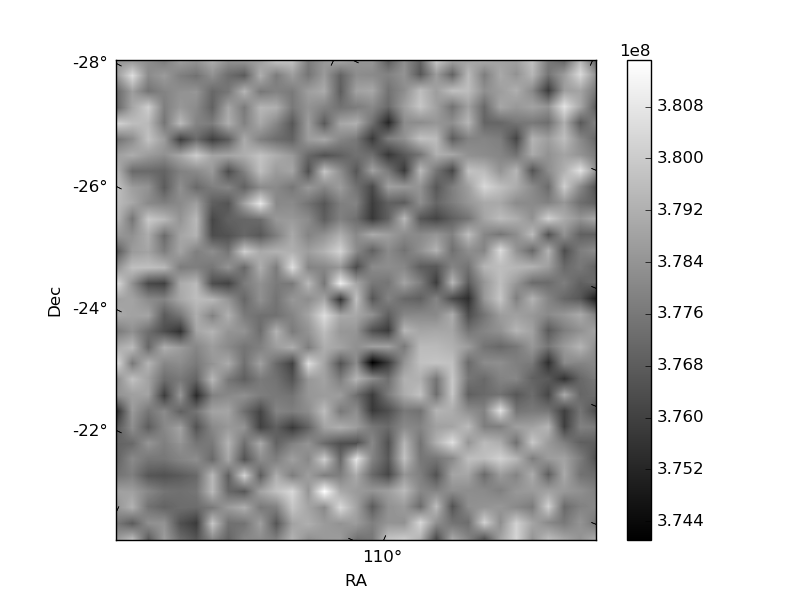
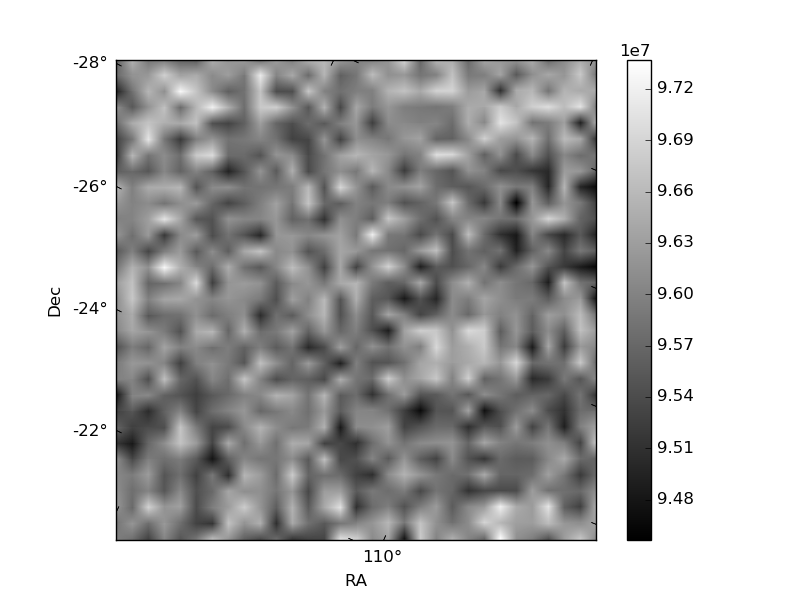
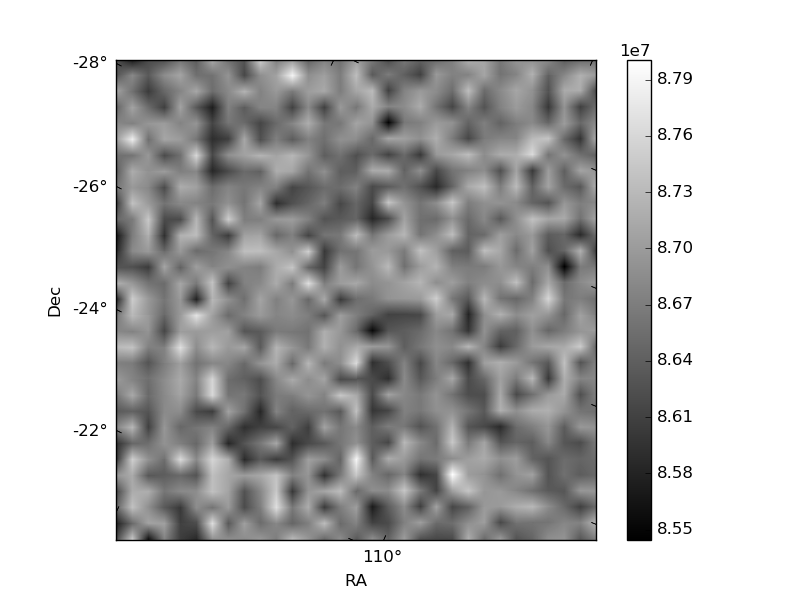
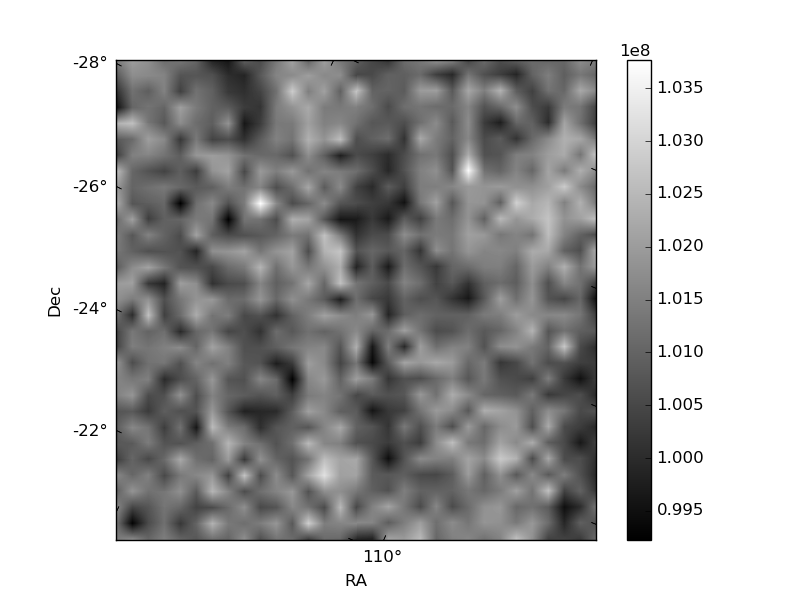
Histogram calculated using DETX and DETY for each event in the final _common_clean file
| Quadrant A | 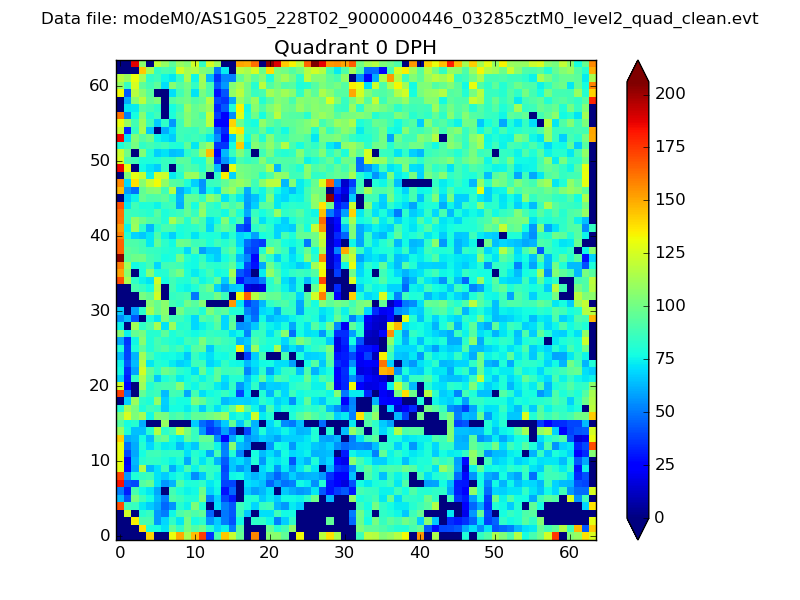 |
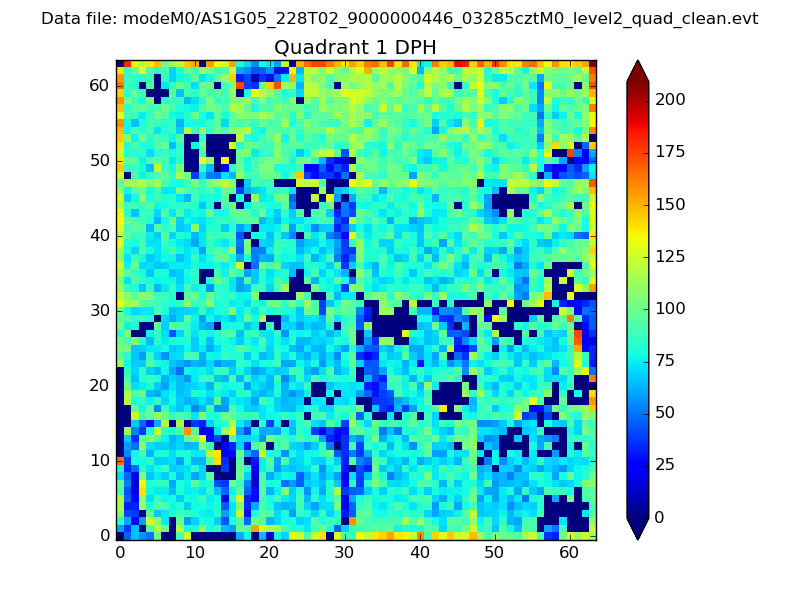 |
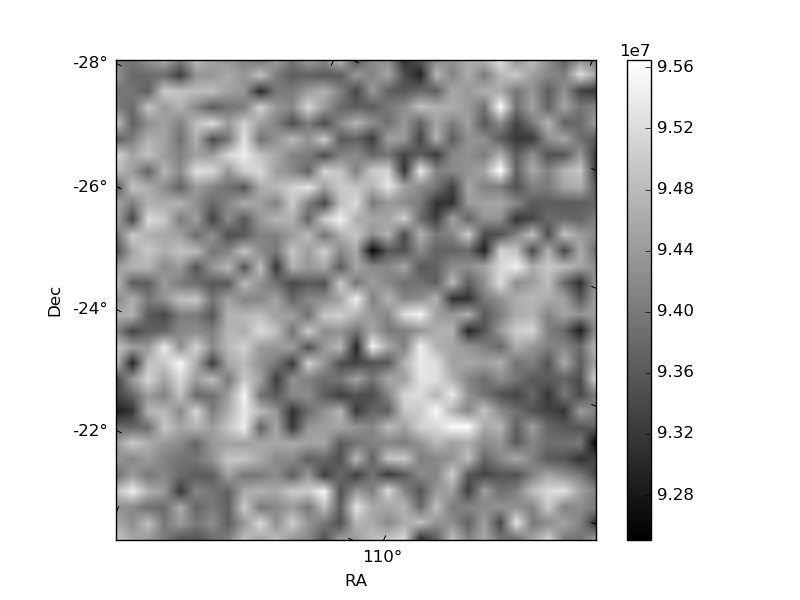
Quadrant B |
|---|---|---|---|
| Quadrant D | 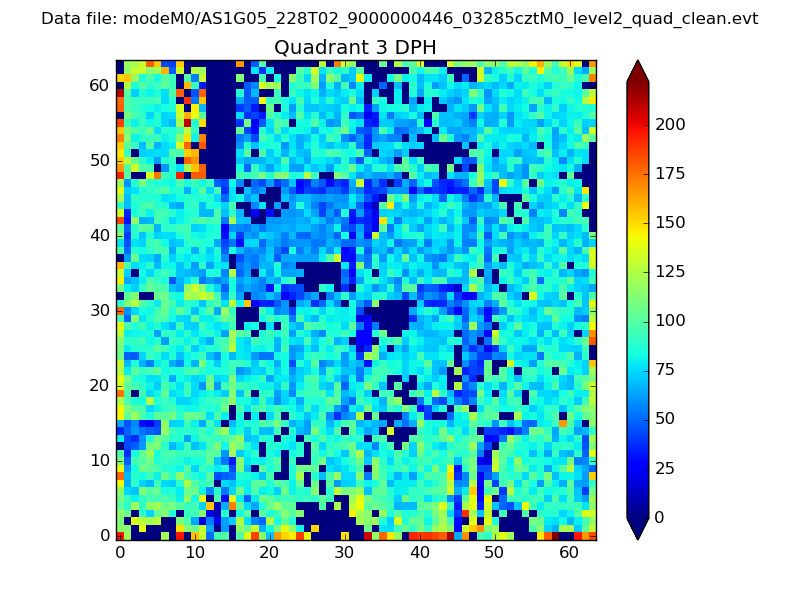 |
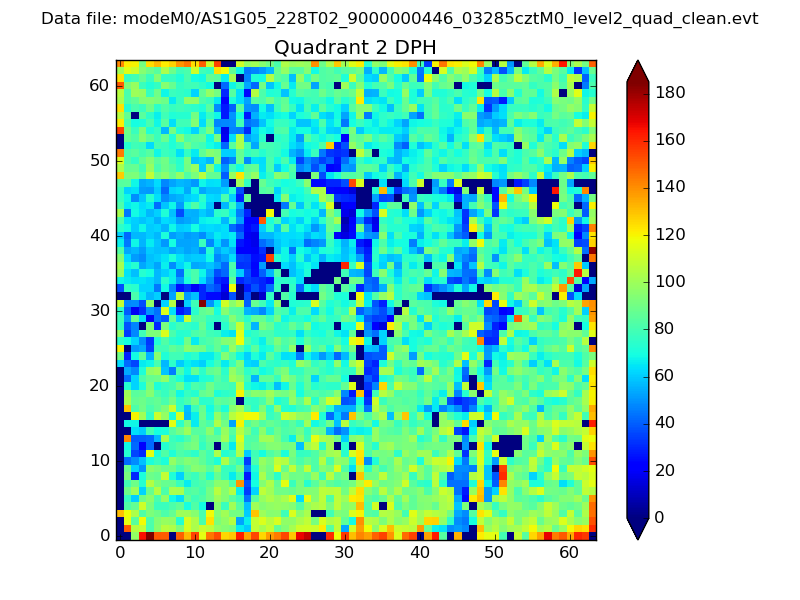 |
Quadrant C |
| Plot type | Count rate plots | Images |
|---|---|---|
| Comparison with Poisson distribution Blue bars denote a histogram of data divided into 1 sec bins. Red curve is a Poisson curve with rate = median count rate of data. |
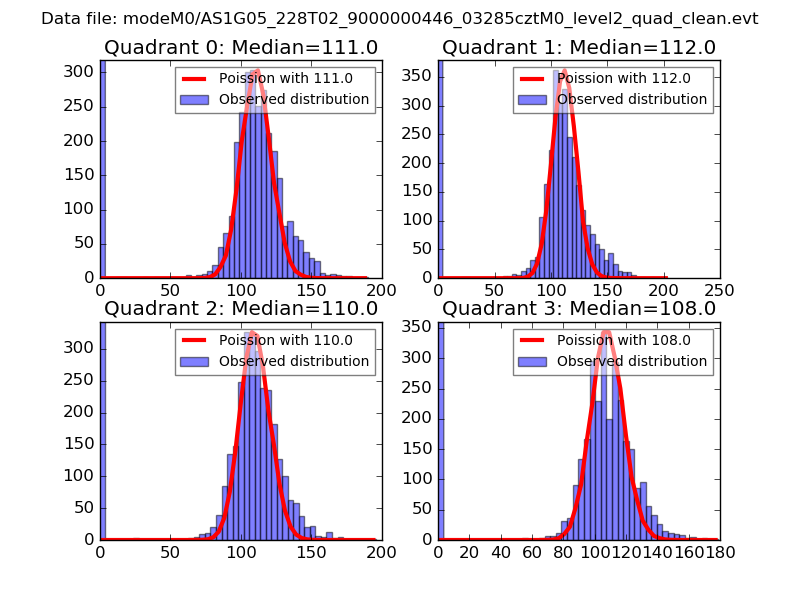 |
 |
| Quadrant-wise count rates Data is divided into 100 sec bins |
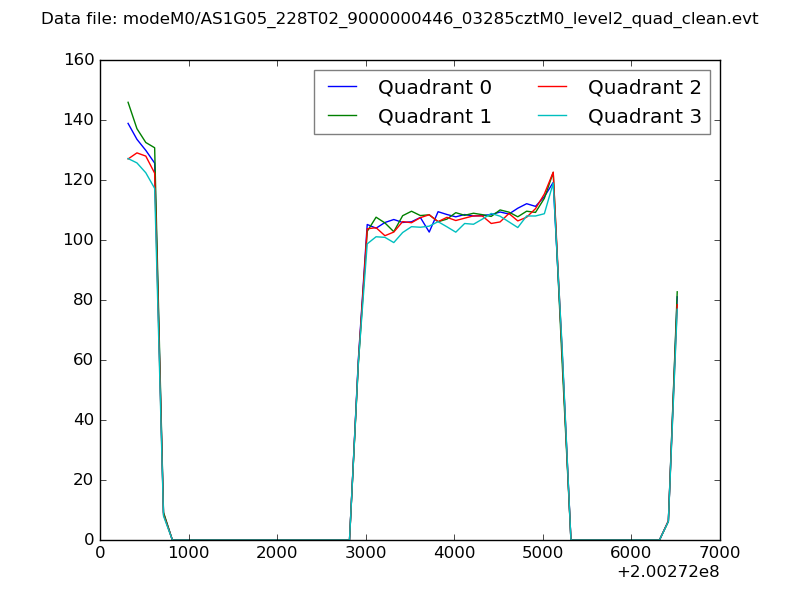 |
|
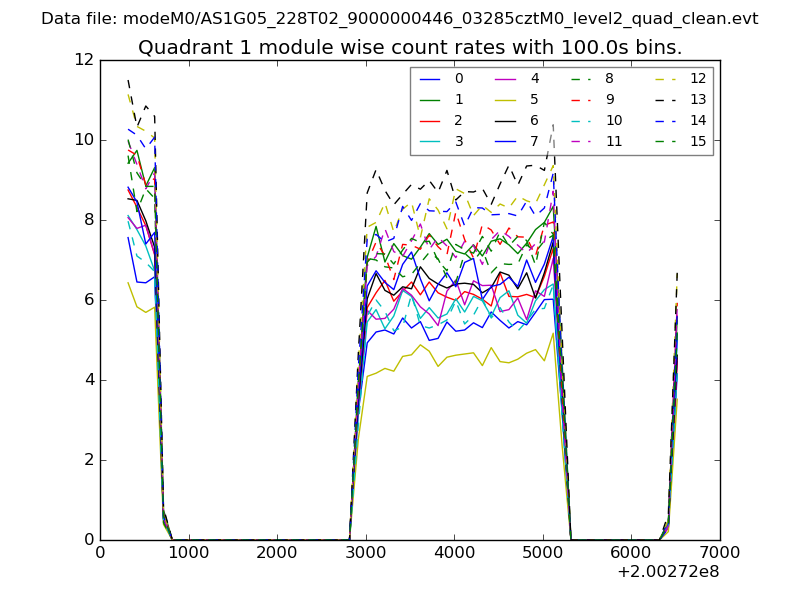
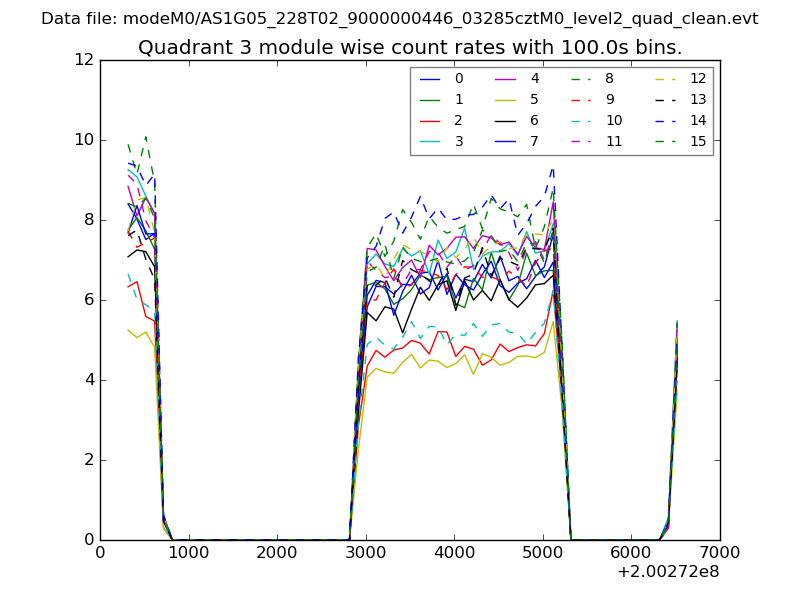
| Module-wise count rates for Quadrant A Data is divided into 100 sec bins |
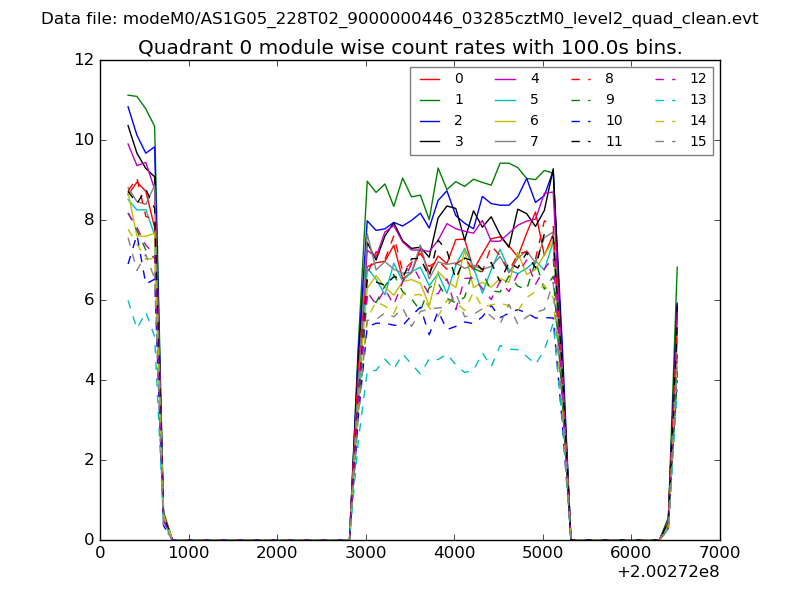 |
 |
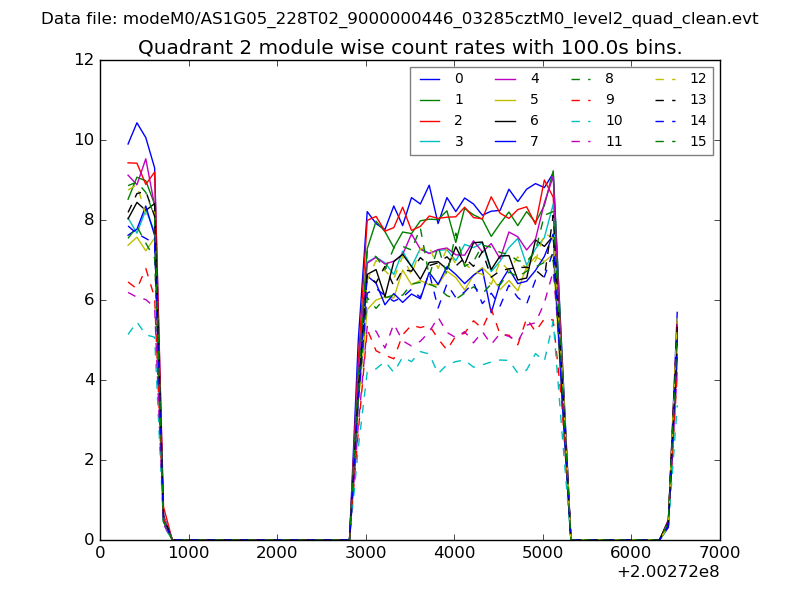
| Module-wise count rates for Quadrant B Data is divided into 100 sec bins |
 |
 |
| Module-wise count rates for Quadrant C Data is divided into 100 sec bins |
 |
 |
| Module-wise count rates for Quadrant D Data is divided into 100 sec bins |
 |
 |
| Parameter | Plot |
|---|---|
| CZT HV Monitor | 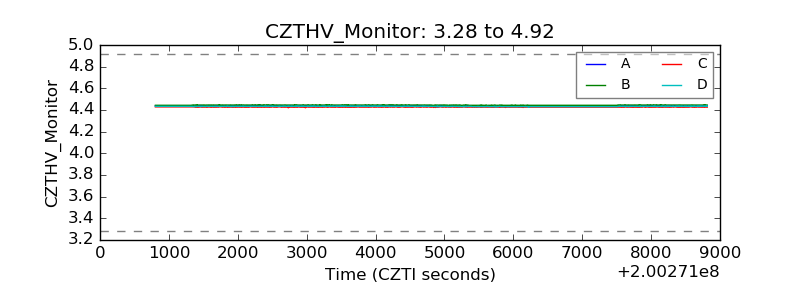 |
| D_VDD | 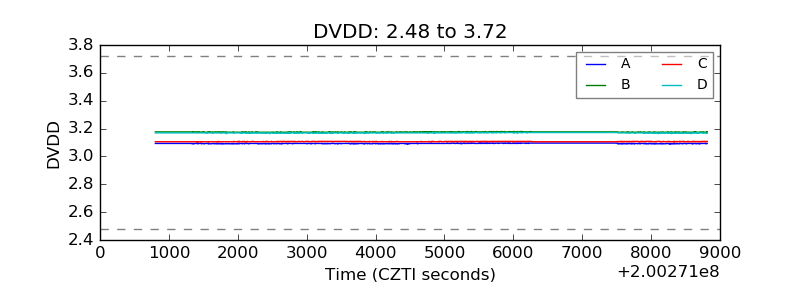 |
| Temperature 1 | 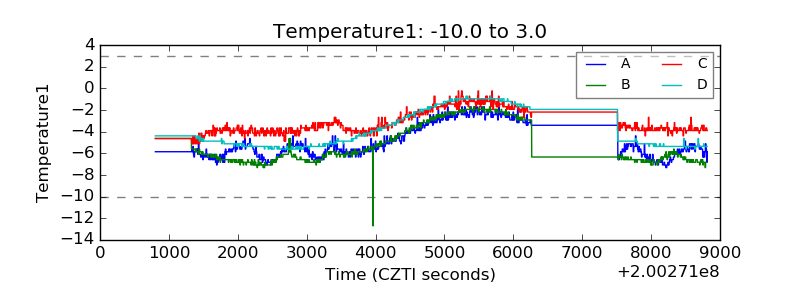 |
| Veto HV Monitor | 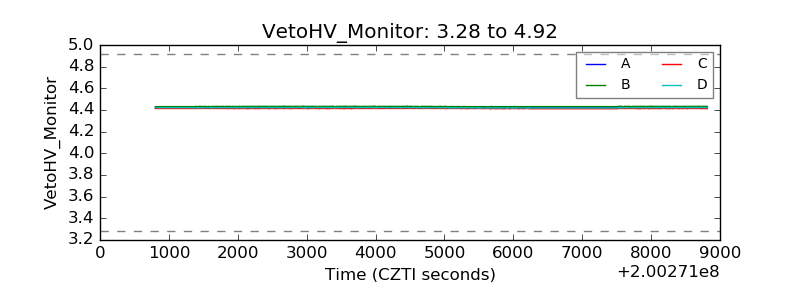 |
| Veto LLD | 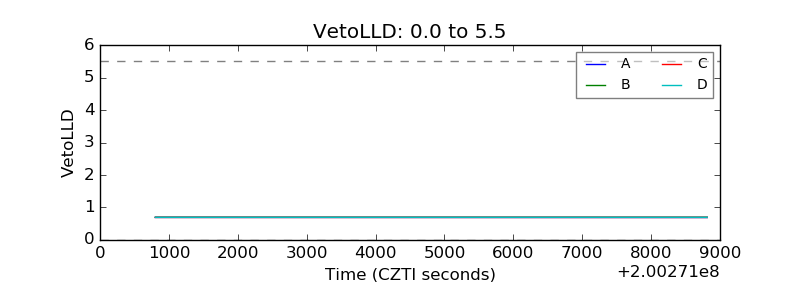 |
| Alpha Counter | 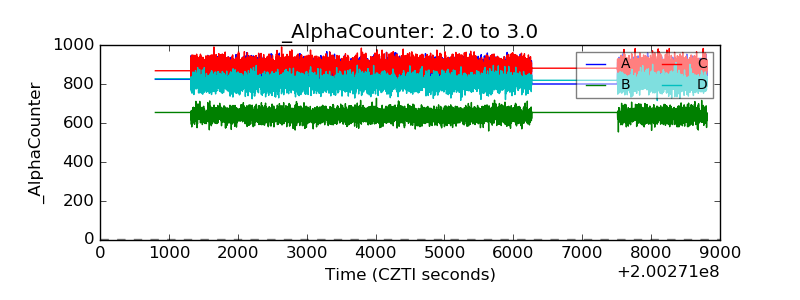 |
| _CPM_Rate | 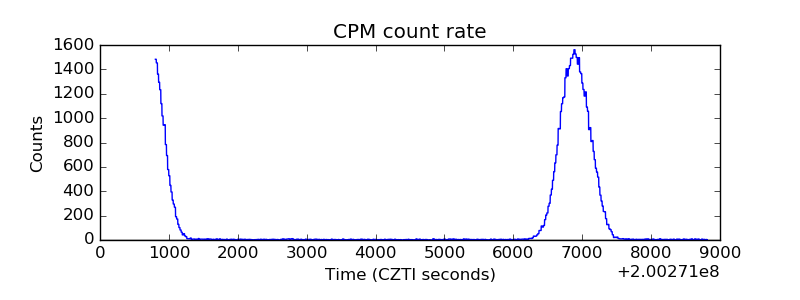 |
| CZT Counter | 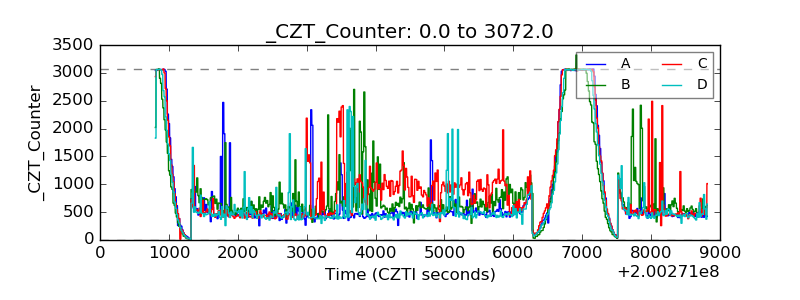 |
| +2.5 Volts monitor |  |
| +5 Volts monitor |  |
| _ROLL_ROT | 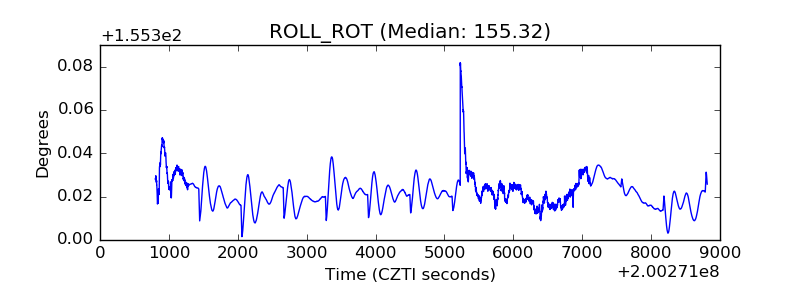 |
| _Roll_DEC | 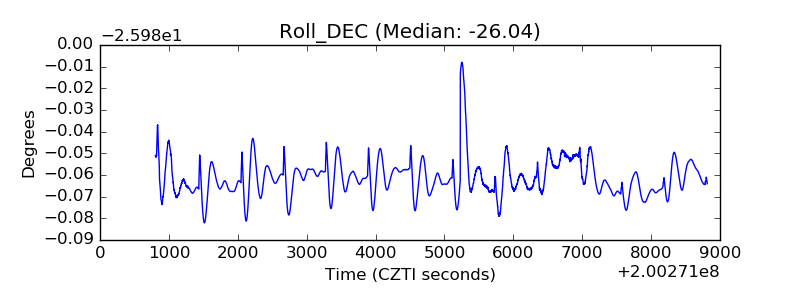 |
| _Roll_RA | 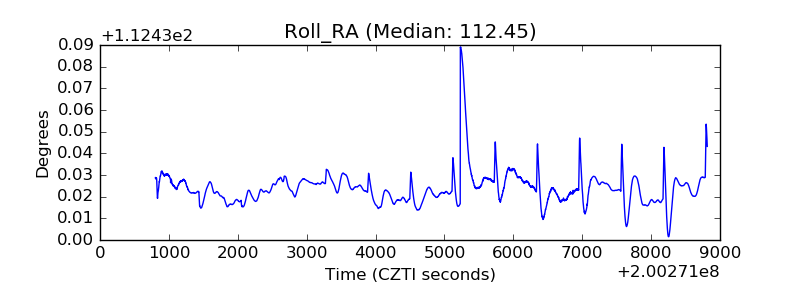 |
| Veto Counter | 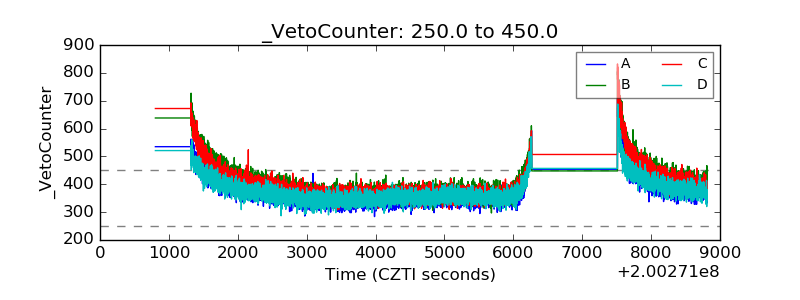 |