| Param | Original file | Final file |
|---|---|---|
| Filename | modeM0/AS1G05_228T02_9000000446_03286cztM0_level2.evt | modeM0/AS1G05_228T02_9000000446_03286cztM0_level2_quad_clean.evt |
| Size (bytes) | 481,556,160 | 55,031,040 |
| Size | 459.2 MB | 52.5 MB |
| Events in quadrant A | 3,123,614 | 304,241 |
| Events in quadrant B | 4,447,975 | 303,957 |
| Events in quadrant C | 3,394,524 | 305,573 |
| Events in quadrant D | 3,172,888 | 295,006 |
| Mode SS | |||
|---|---|---|---|
| Quadrant | BADHDUFLAG | Total packets | Discarded packets |
| A | 0 | 134 | 0 |
| B | 0 | 134 | 0 |
| C | 0 | 134 | 0 |
| D | 0 | 134 | 0 |
| Mode M0 | |||
|---|---|---|---|
| Quadrant | BADHDUFLAG | Total packets | Discarded packets |
| A | 0 | 13514 | 3 |
| B | 0 | 17446 | 2 |
| C | 0 | 14357 | 2 |
| D | 0 | 14008 | 2 |
| Mode M9 | |||
|---|---|---|---|
| Quadrant | BADHDUFLAG | Total packets | Discarded packets |
| A | 0 | 24 | 0 |
| B | 0 | 24 | 0 |
| C | 0 | 24 | 0 |
| D | 0 | 24 | 0 |
| Quadrant | Total seconds | Saturated seconds | Saturation percentage |
|---|---|---|---|
| A | 6550 | 34 | 0.519084% |
| B | 6550 | 178 | 2.717557% |
| C | 6550 | 87 | 1.328244% |
| D | 6550 | 41 | 0.625954% |
Noise dominated data is calculated using 1-second bins in cleaned event files. If a bin has >2000 counts, and if more than 50% of those come from <1% of pixels, then it is considered to be noise-dominated and hence unusable.
| Quadrant | # 1 sec bins | Bins with >0 counts | Bins with >2000 counts | High rate bins dominated by noise | Noise dominated (total time) | Noise dominated (detector-on time) | Marked lightcurve |
|---|---|---|---|---|---|---|---|
| A | 7825 | 6551 | 0 | 0 | 0.00% | 0.00% | 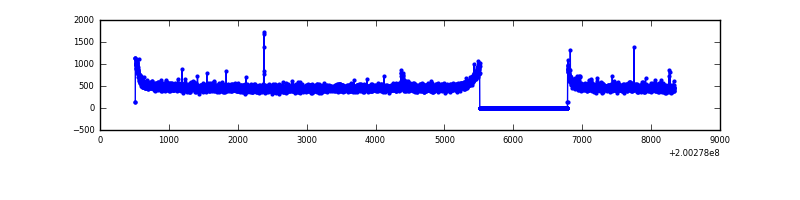 |
| B | 7825 | 6551 | 48 | 48 | 0.61% | 0.73% | 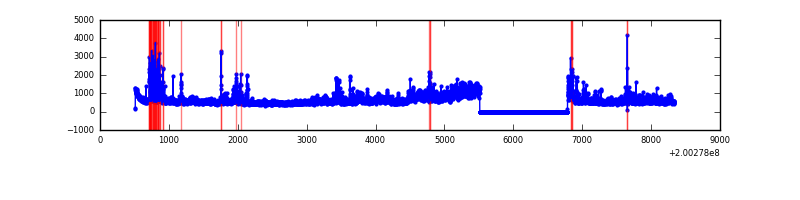 |
| C | 7825 | 6551 | 29 | 29 | 0.37% | 0.44% | 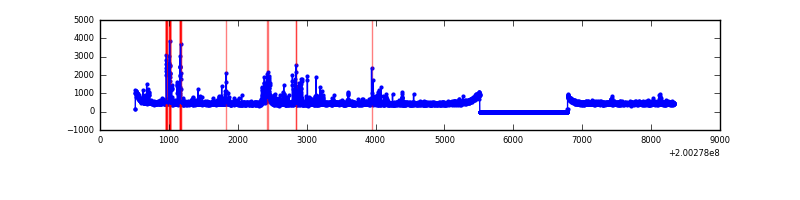 |
| D | 7825 | 6551 | 25 | 25 | 0.32% | 0.38% | 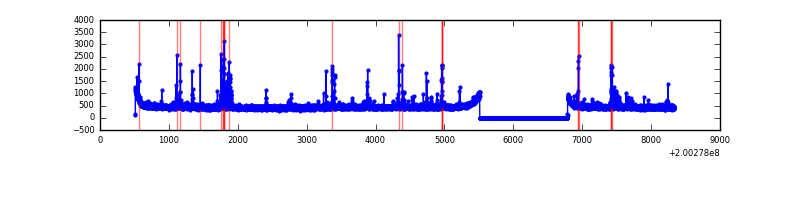 |
Top three noisy pixels from each quadrant. If the there are fewer than three noisy pixels in the level2.evt file, extra rows are filled as -1
| Pixel properties | Quadrant properties | ||||||
|---|---|---|---|---|---|---|---|
| Quadrant | DetID | PixID | Counts | Sigma | Mean | Median | Sigma |
| A | 0 | 118 | 11129 | 63.22 | 803 | 787 | 163.6 |
| A | 14 | 249 | 11098 | 63.03 | 803 | 787 | 163.6 |
| A | 0 | 226 | 9246 | 51.71 | 803 | 787 | 163.6 |
| B | 15 | 204 | 878112 | 5605.98 | 813 | 796 | 156.5 |
| B | 2 | 249 | 357947 | 2282.17 | 813 | 796 | 156.5 |
| B | 15 | 54 | 23067 | 142.31 | 813 | 796 | 156.5 |
| C | 14 | 223 | 218010 | 1197.11 | 779 | 783 | 181.5 |
| C | 6 | 80 | 77103 | 420.59 | 779 | 783 | 181.5 |
| C | 12 | 175 | 34788 | 187.4 | 779 | 783 | 181.5 |
| D | 13 | 239 | 112404 | 594.56 | 774 | 751 | 187.8 |
| D | 13 | 223 | 66984 | 352.7 | 774 | 751 | 187.8 |
| D | 5 | 233 | 49279 | 258.42 | 774 | 751 | 187.8 |
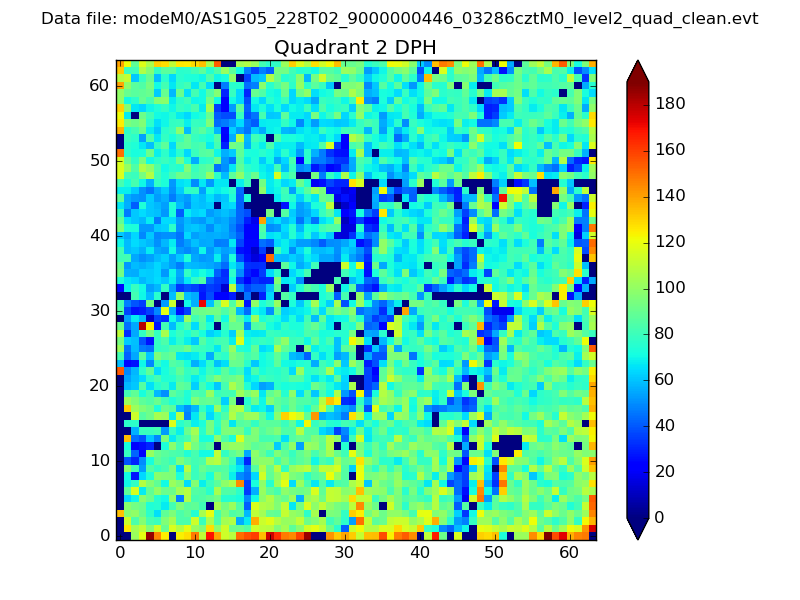
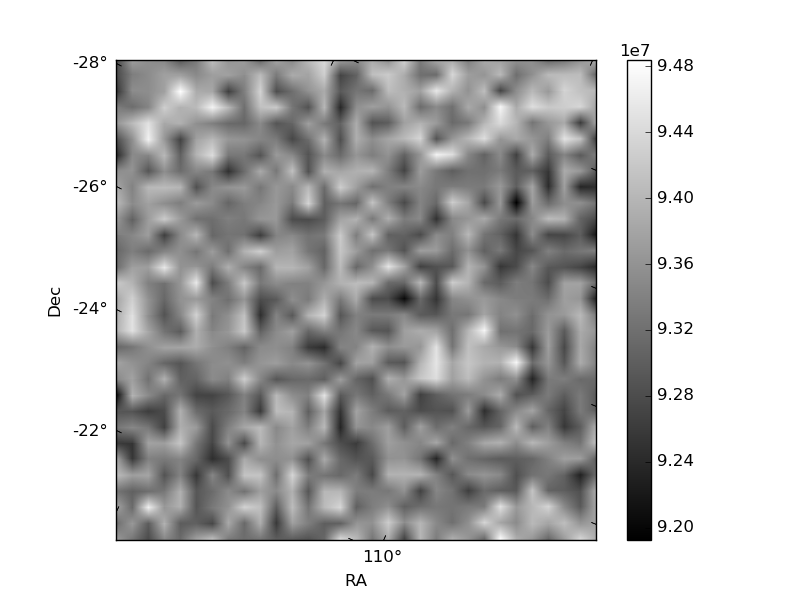
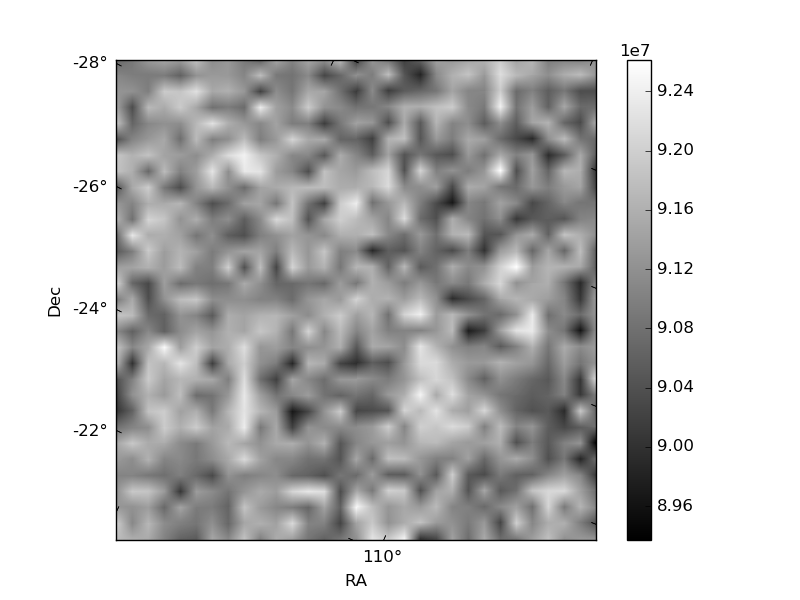
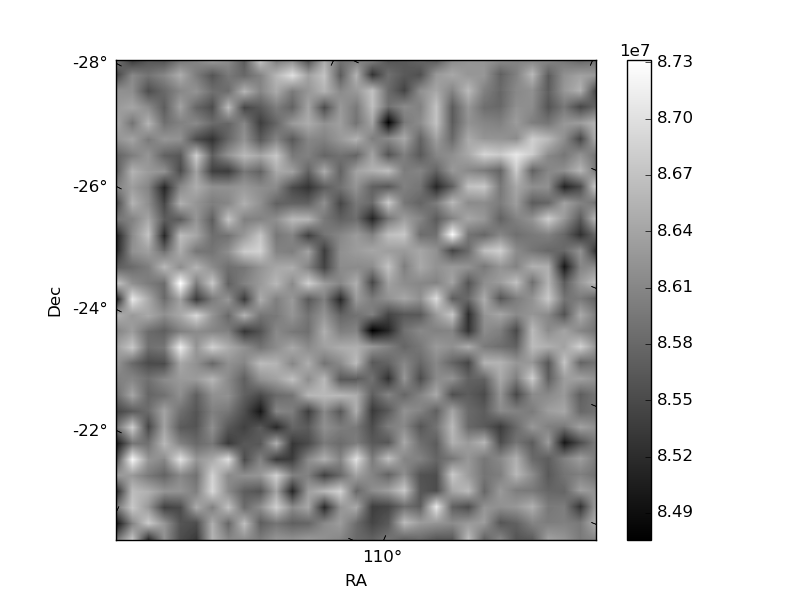
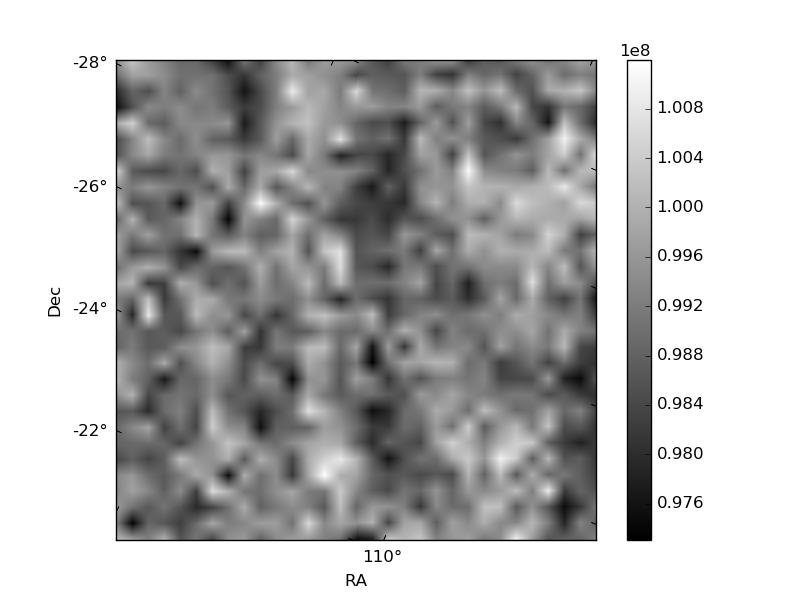
Histogram calculated using DETX and DETY for each event in the final _common_clean file
| Quadrant A | 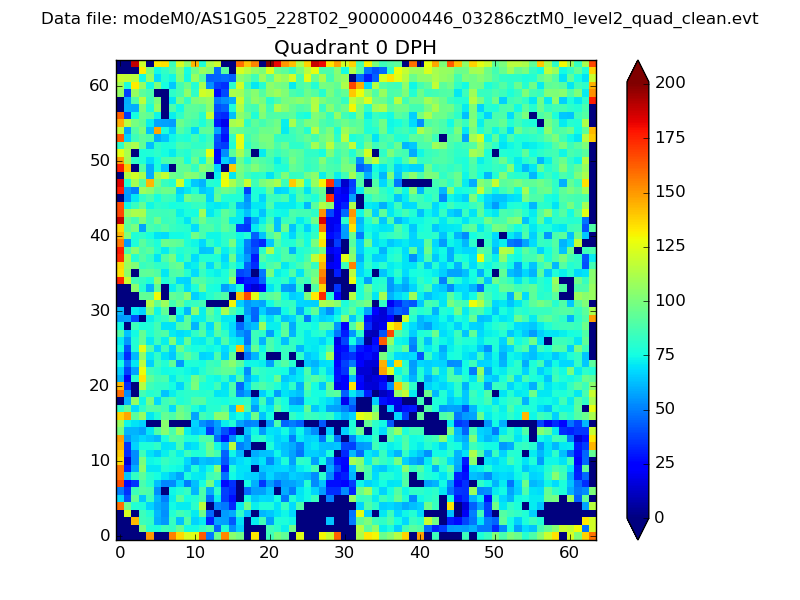 |
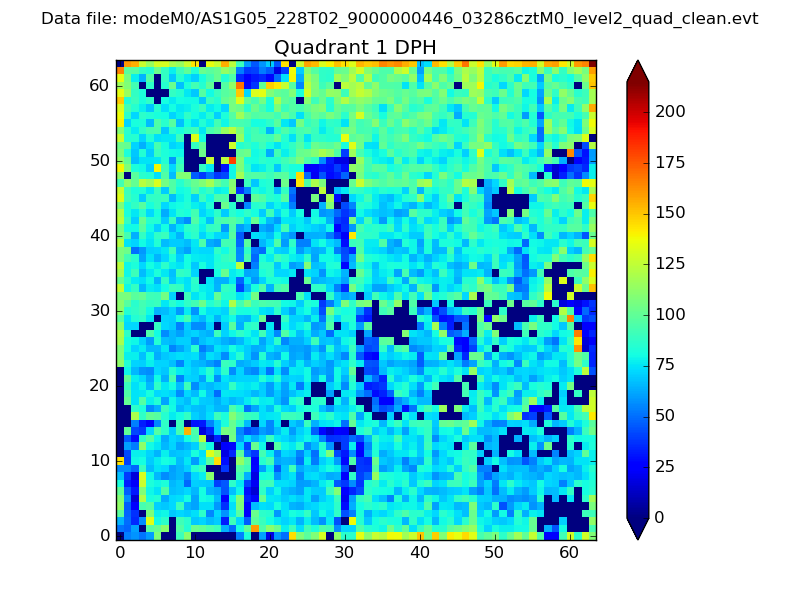 |
Quadrant B |
|---|---|---|---|
| Quadrant D | 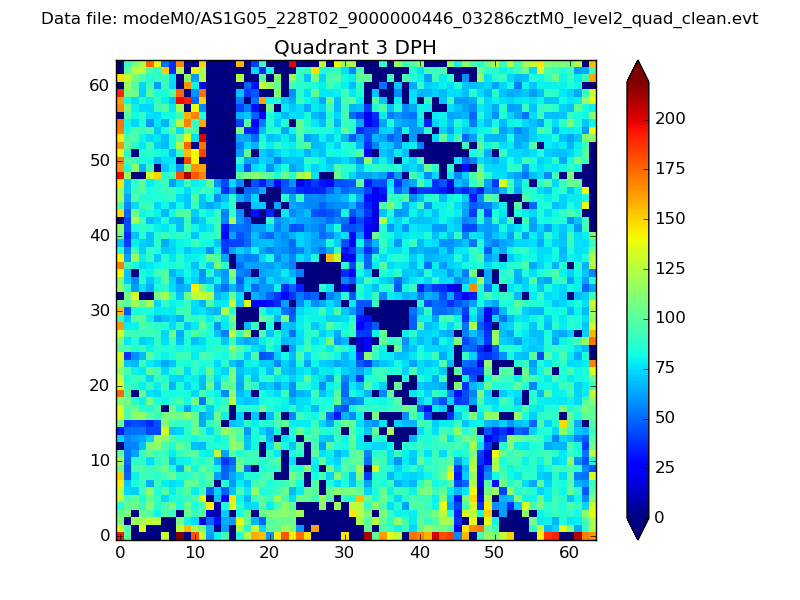 |
 |
Quadrant C |
| Plot type | Count rate plots | Images |
|---|---|---|
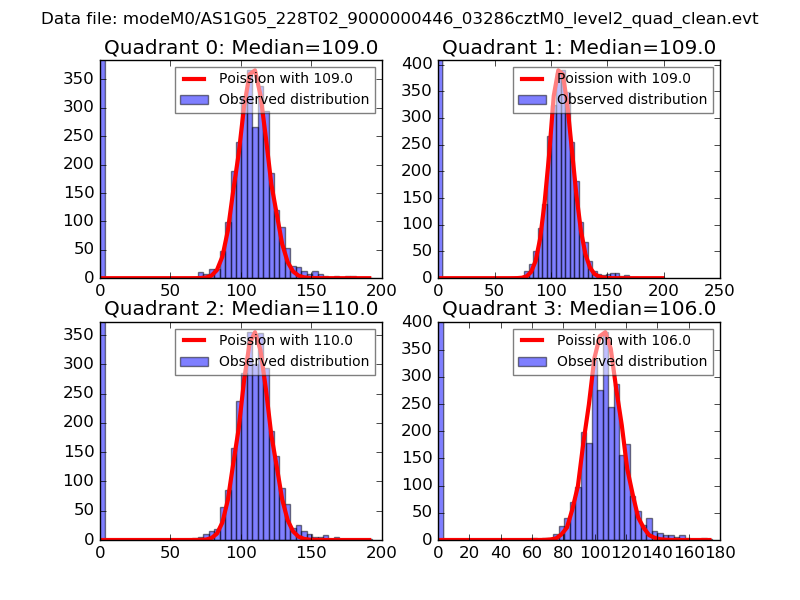
| Comparison with Poisson distribution Blue bars denote a histogram of data divided into 1 sec bins. Red curve is a Poisson curve with rate = median count rate of data. |
 |
 |
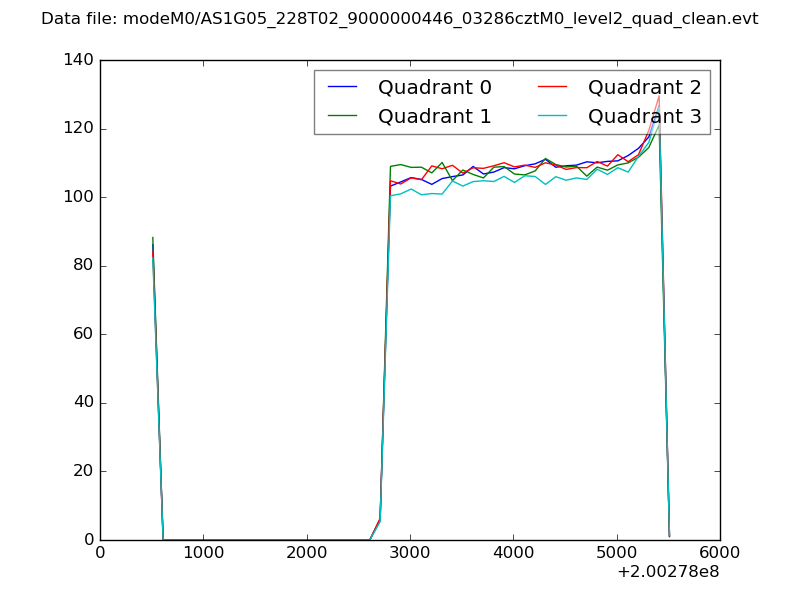
| Quadrant-wise count rates Data is divided into 100 sec bins |
 |
|
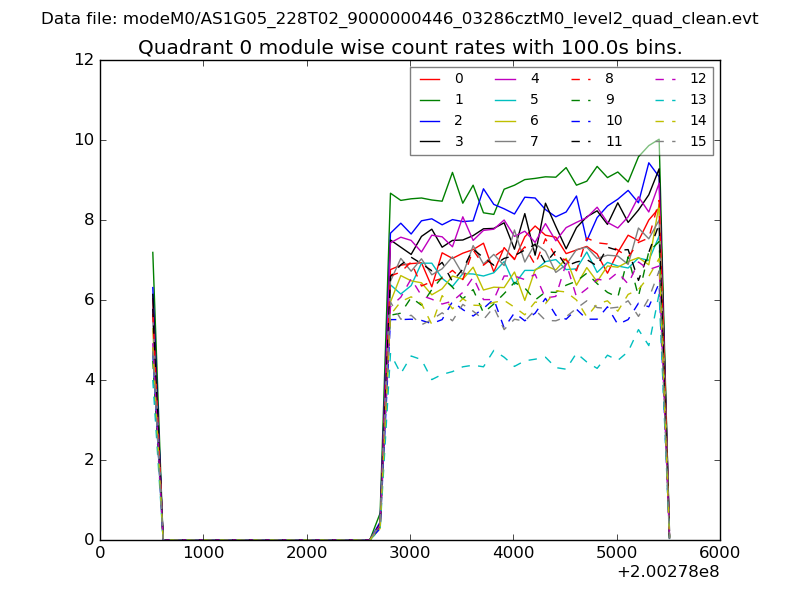
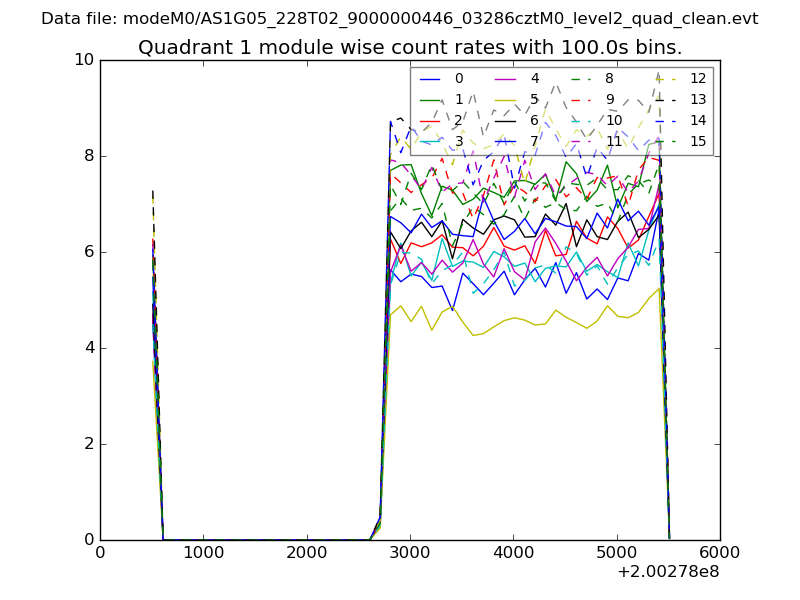
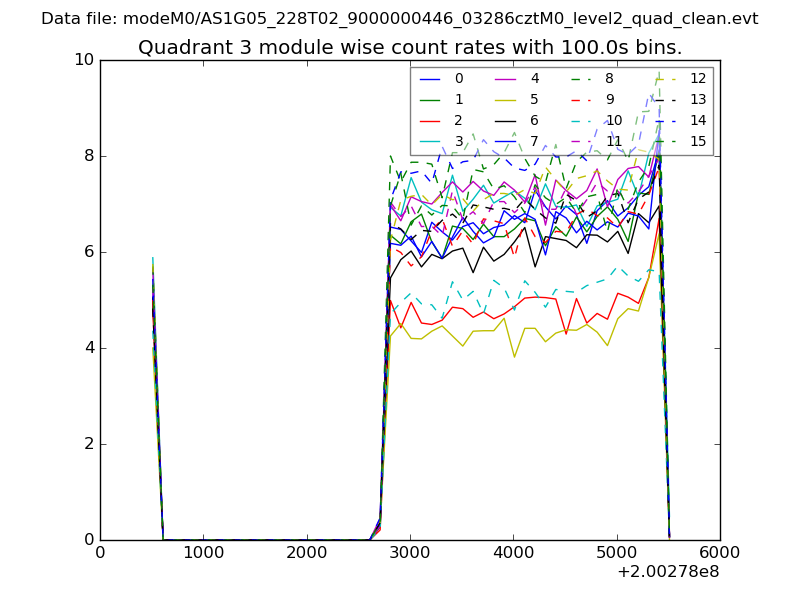
| Module-wise count rates for Quadrant A Data is divided into 100 sec bins |
 |
 |
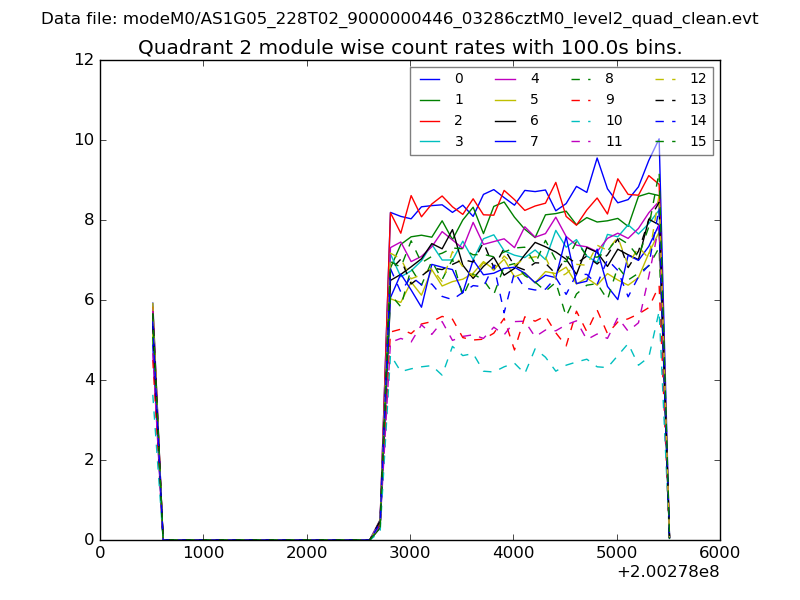
| Module-wise count rates for Quadrant B Data is divided into 100 sec bins |
 |
 |
| Module-wise count rates for Quadrant C Data is divided into 100 sec bins |
 |
 |
| Module-wise count rates for Quadrant D Data is divided into 100 sec bins |
 |
 |
| Parameter | Plot |
|---|---|
| CZT HV Monitor | 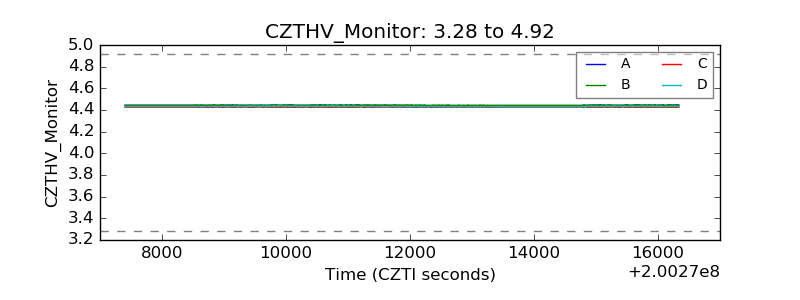 |
| D_VDD | 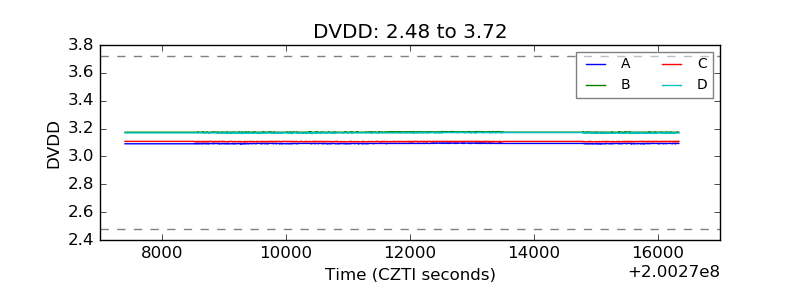 |
| Temperature 1 | 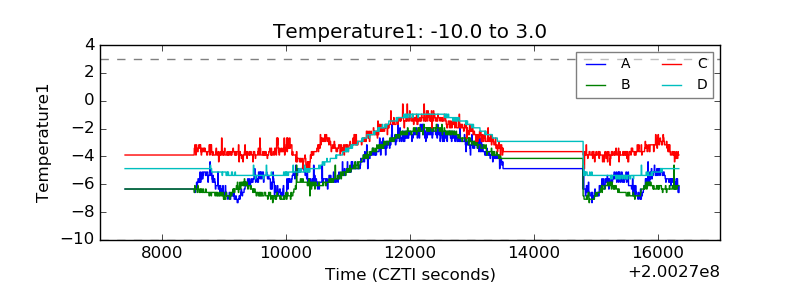 |
| Veto HV Monitor | 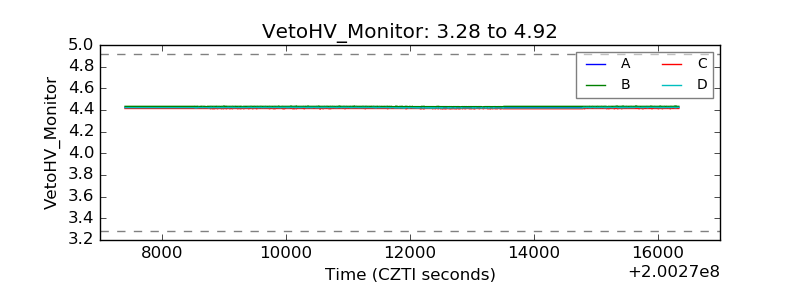 |
| Veto LLD | 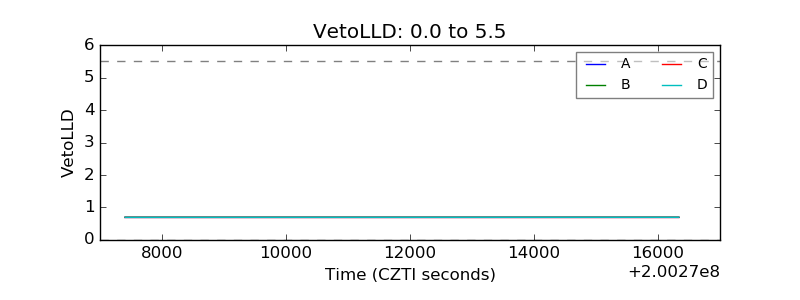 |
| Alpha Counter | 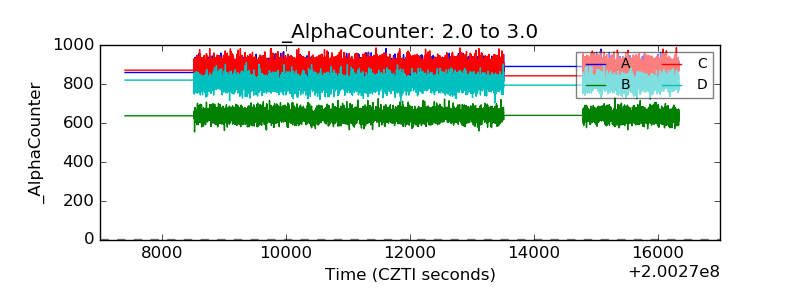 |
| _CPM_Rate | 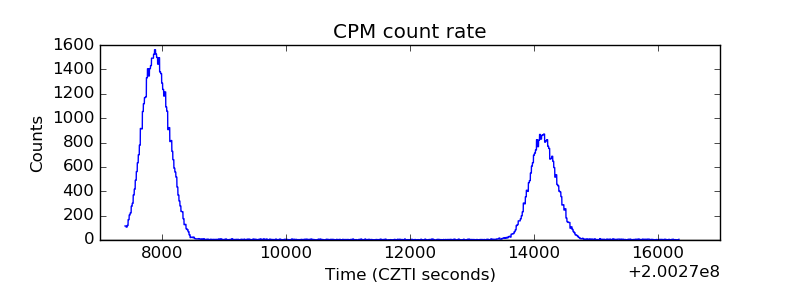 |
| CZT Counter | 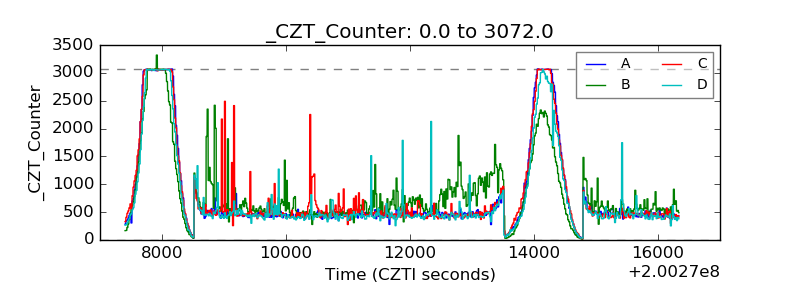 |
| +2.5 Volts monitor |  |
| +5 Volts monitor |  |
| _ROLL_ROT | 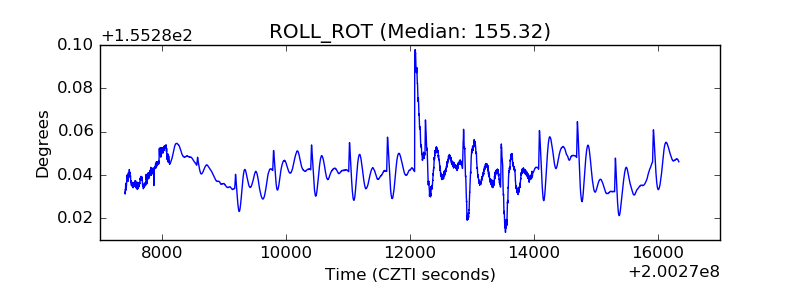 |
| _Roll_DEC | 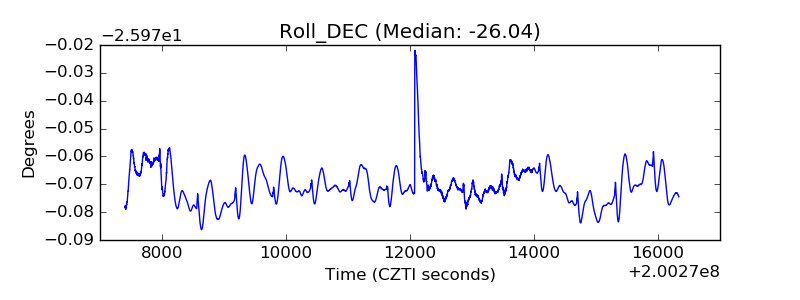 |
| _Roll_RA | 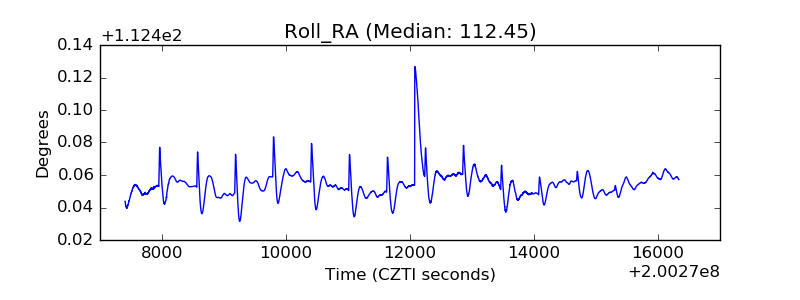 |
| Veto Counter | 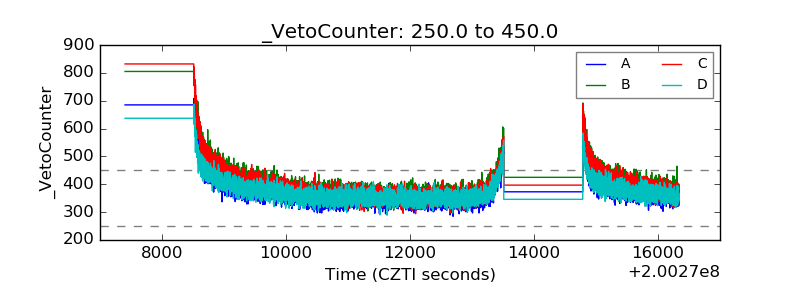 |