| Param | Original file | Final file |
|---|---|---|
| Filename | modeM0/AS1G05_228T02_9000000446_03287cztM0_level2.evt | modeM0/AS1G05_228T02_9000000446_03287cztM0_level2_quad_clean.evt |
| Size (bytes) | 471,470,400 | 62,130,240 |
| Size | 449.6 MB | 59.3 MB |
| Events in quadrant A | 3,121,012 | 355,998 |
| Events in quadrant B | 4,322,873 | 353,682 |
| Events in quadrant C | 3,299,053 | 358,152 |
| Events in quadrant D | 3,084,133 | 349,733 |
| Mode SS | |||
|---|---|---|---|
| Quadrant | BADHDUFLAG | Total packets | Discarded packets |
| A | 0 | 134 | 0 |
| B | 0 | 134 | 0 |
| C | 0 | 134 | 0 |
| D | 0 | 134 | 0 |
| Mode M0 | |||
|---|---|---|---|
| Quadrant | BADHDUFLAG | Total packets | Discarded packets |
| A | 0 | 13706 | 3 |
| B | 0 | 17229 | 2 |
| C | 0 | 14237 | 2 |
| D | 0 | 13972 | 2 |
| Mode M9 | |||
|---|---|---|---|
| Quadrant | BADHDUFLAG | Total packets | Discarded packets |
| A | 0 | 13 | 0 |
| B | 0 | 13 | 0 |
| C | 0 | 13 | 0 |
| D | 0 | 14 | 0 |
| Quadrant | Total seconds | Saturated seconds | Saturation percentage |
|---|---|---|---|
| A | 6649 | 54 | 0.812152% |
| B | 6649 | 124 | 1.864942% |
| C | 6649 | 96 | 1.443826% |
| D | 6649 | 52 | 0.782072% |
Noise dominated data is calculated using 1-second bins in cleaned event files. If a bin has >2000 counts, and if more than 50% of those come from <1% of pixels, then it is considered to be noise-dominated and hence unusable.
| Quadrant | # 1 sec bins | Bins with >0 counts | Bins with >2000 counts | High rate bins dominated by noise | Noise dominated (total time) | Noise dominated (detector-on time) | Marked lightcurve |
|---|---|---|---|---|---|---|---|
| A | 7809 | 6650 | 2 | 2 | 0.03% | 0.03% | 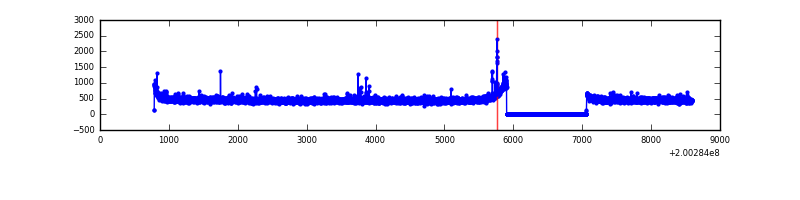 |
| B | 7809 | 6650 | 21 | 21 | 0.27% | 0.32% |  |
| C | 7809 | 6650 | 20 | 20 | 0.26% | 0.30% | 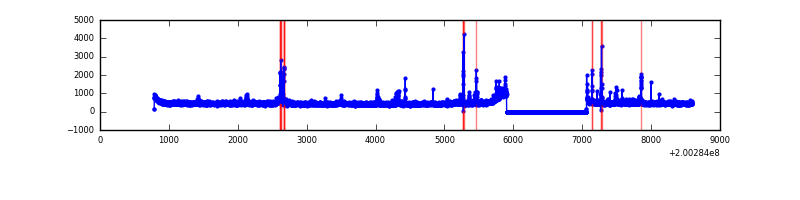 |
| D | 7809 | 6650 | 16 | 16 | 0.20% | 0.24% | 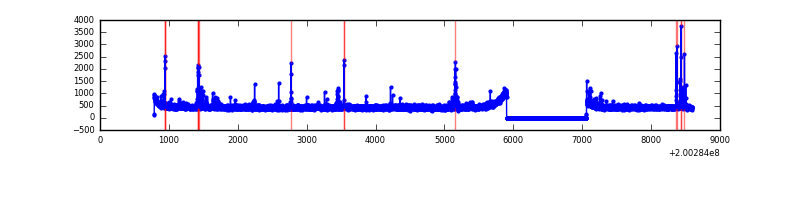 |
Top three noisy pixels from each quadrant. If the there are fewer than three noisy pixels in the level2.evt file, extra rows are filled as -1
| Pixel properties | Quadrant properties | ||||||
|---|---|---|---|---|---|---|---|
| Quadrant | DetID | PixID | Counts | Sigma | Mean | Median | Sigma |
| A | 0 | 118 | 29923 | 175.95 | 800 | 783 | 165.6 |
| A | 0 | 226 | 10966 | 61.49 | 800 | 783 | 165.6 |
| A | 12 | 194 | 8453 | 46.31 | 800 | 783 | 165.6 |
| B | 15 | 204 | 924922 | 5887.6 | 809 | 790 | 157.0 |
| B | 2 | 249 | 174699 | 1107.97 | 809 | 790 | 157.0 |
| B | 4 | 81 | 67519 | 425.13 | 809 | 790 | 157.0 |
| C | 14 | 223 | 94453 | 510.83 | 778 | 783 | 183.4 |
| C | 6 | 80 | 88752 | 479.74 | 778 | 783 | 183.4 |
| C | 1 | 192 | 50030 | 268.57 | 778 | 783 | 183.4 |
| D | 13 | 239 | 69706 | 367.46 | 774 | 752 | 187.7 |
| D | 5 | 233 | 37386 | 195.22 | 774 | 752 | 187.7 |
| D | 13 | 223 | 26649 | 138.01 | 774 | 752 | 187.7 |
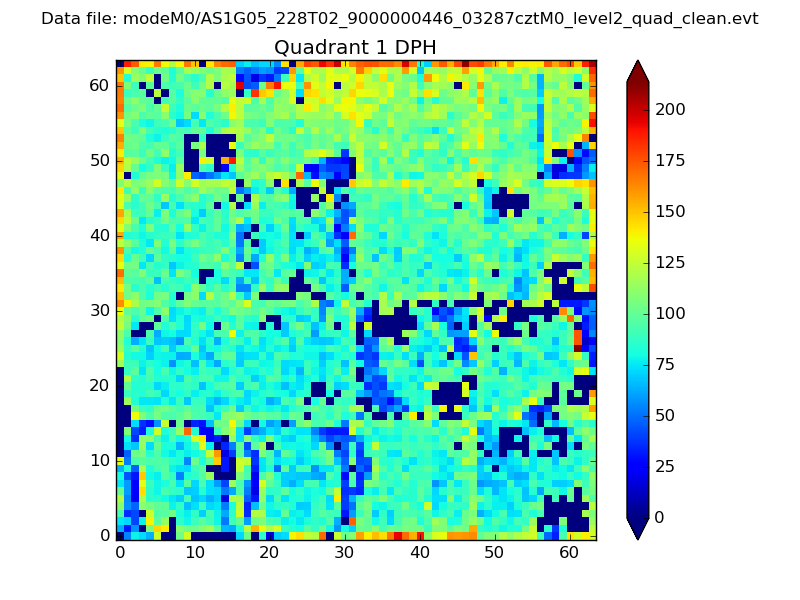
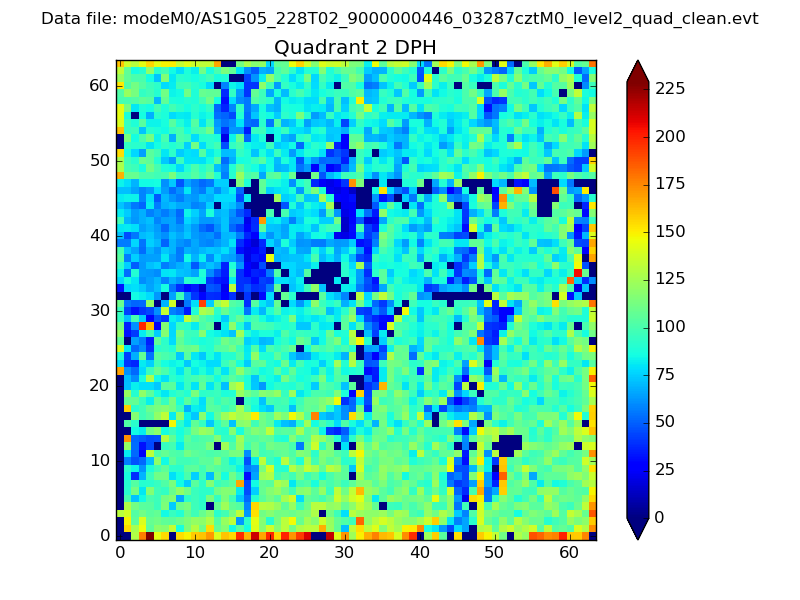
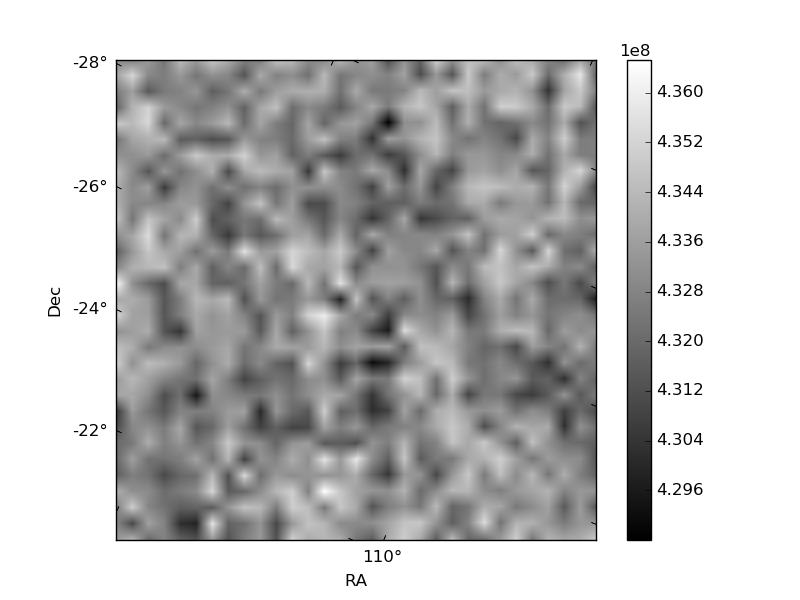
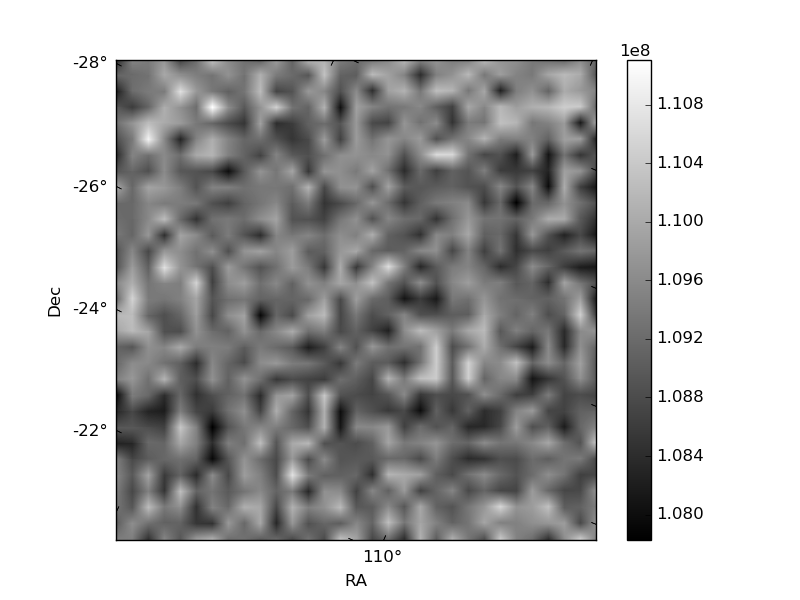
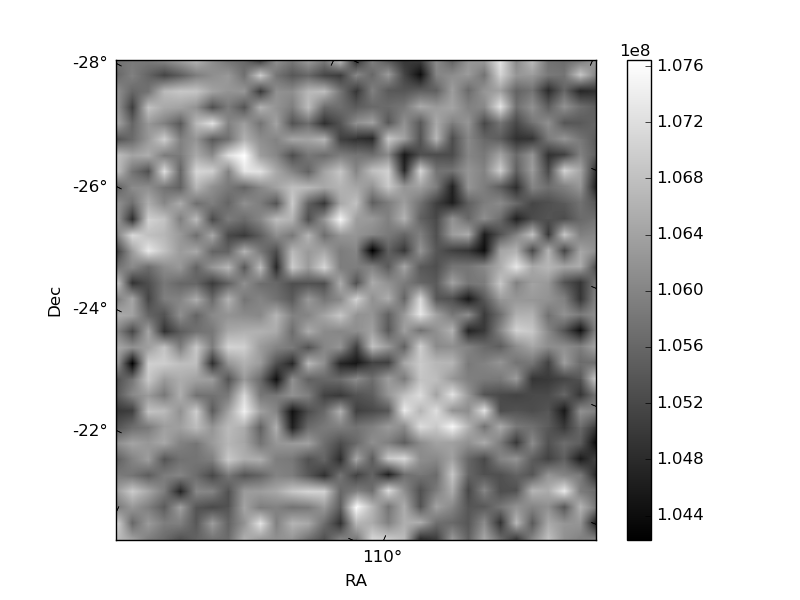
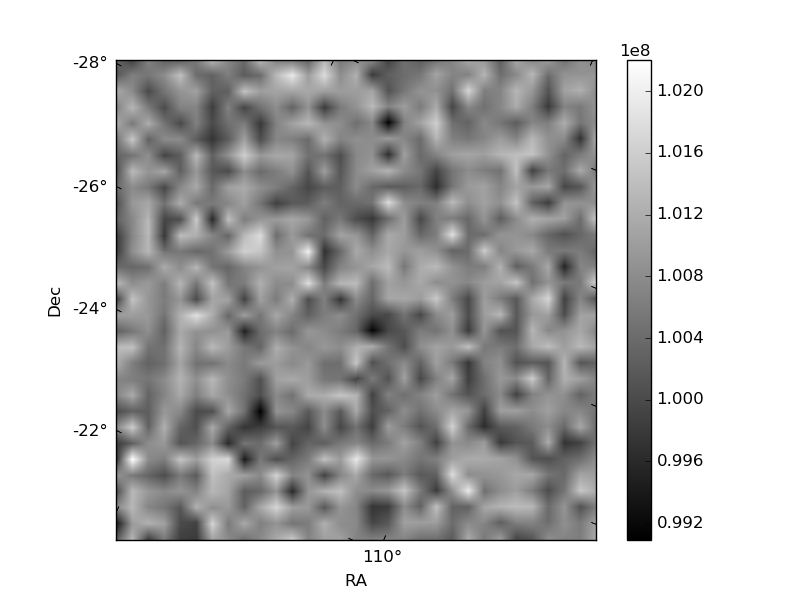
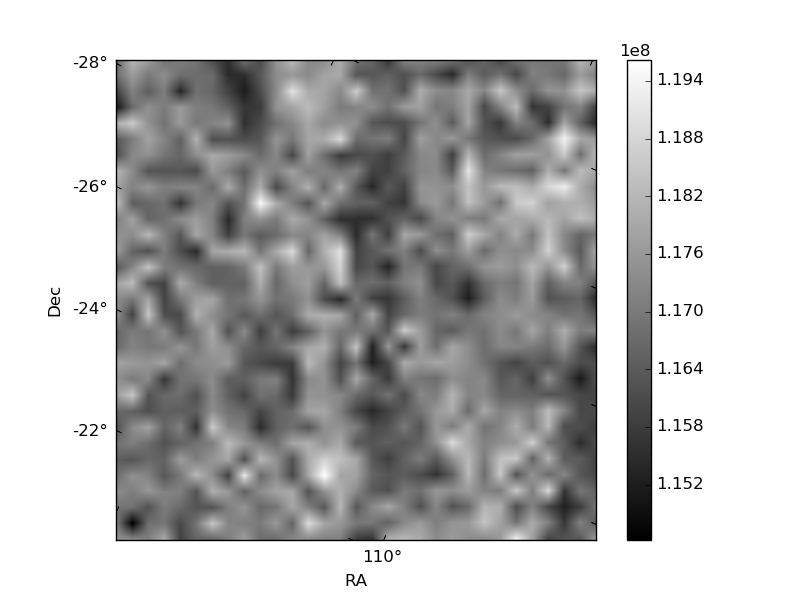
Histogram calculated using DETX and DETY for each event in the final _common_clean file
| Quadrant A | 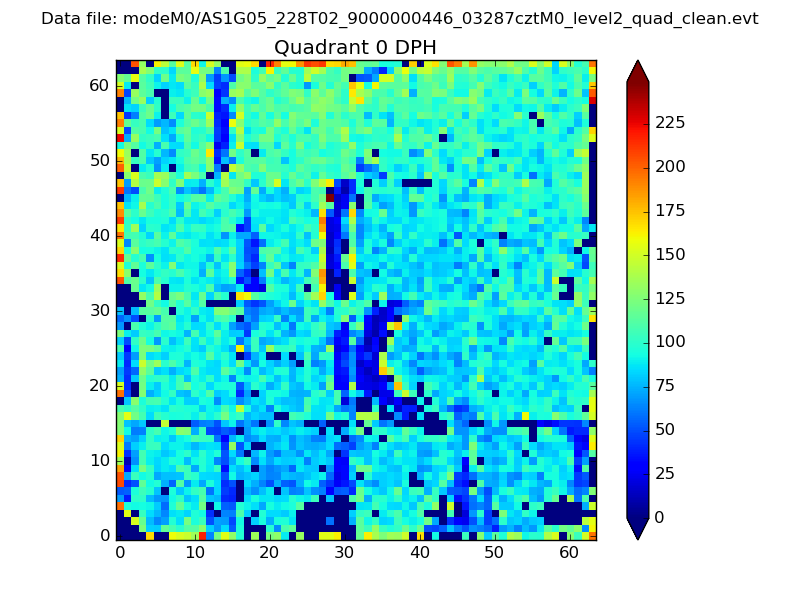 |
 |
Quadrant B |
|---|---|---|---|
| Quadrant D | 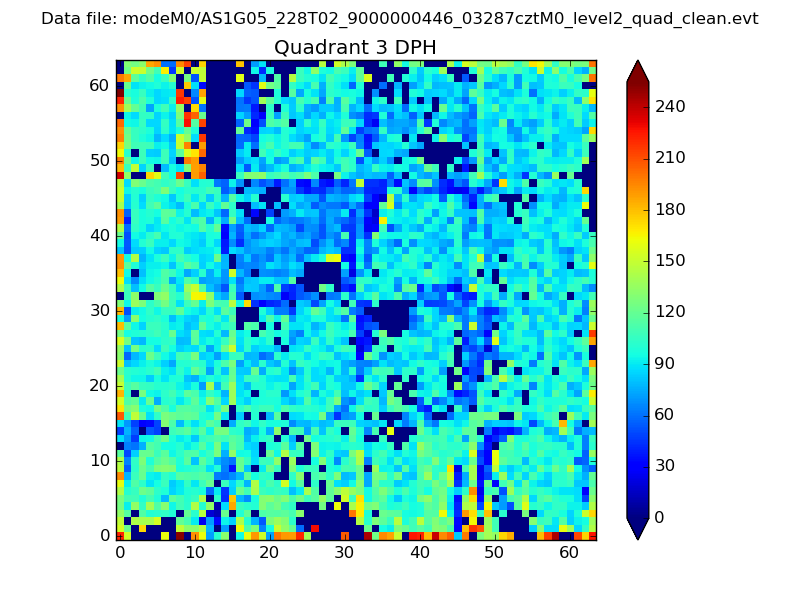 |
 |
Quadrant C |
| Plot type | Count rate plots | Images |
|---|---|---|
| Comparison with Poisson distribution Blue bars denote a histogram of data divided into 1 sec bins. Red curve is a Poisson curve with rate = median count rate of data. |
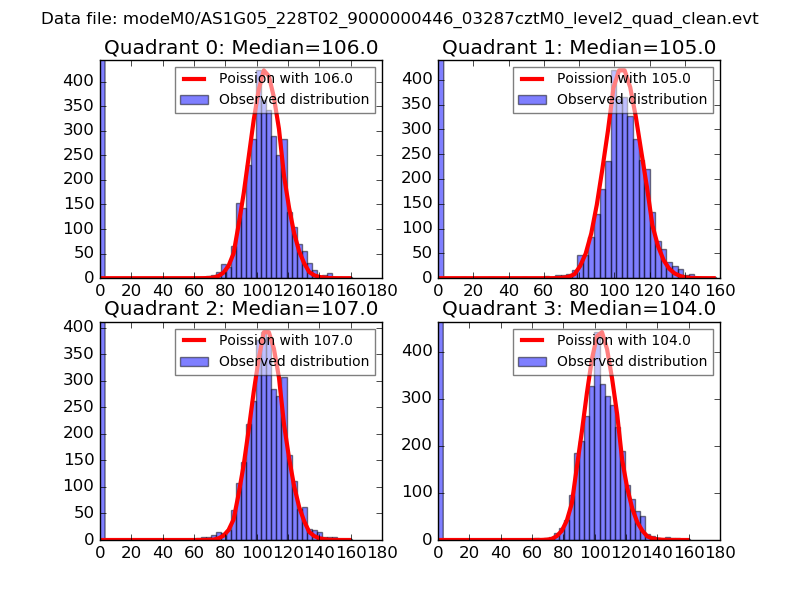 |
 |
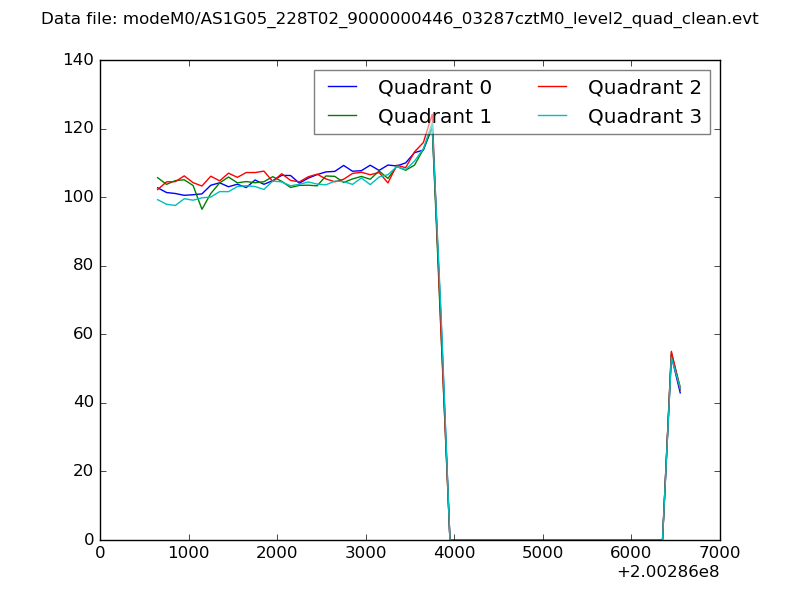
| Quadrant-wise count rates Data is divided into 100 sec bins |
 |
|
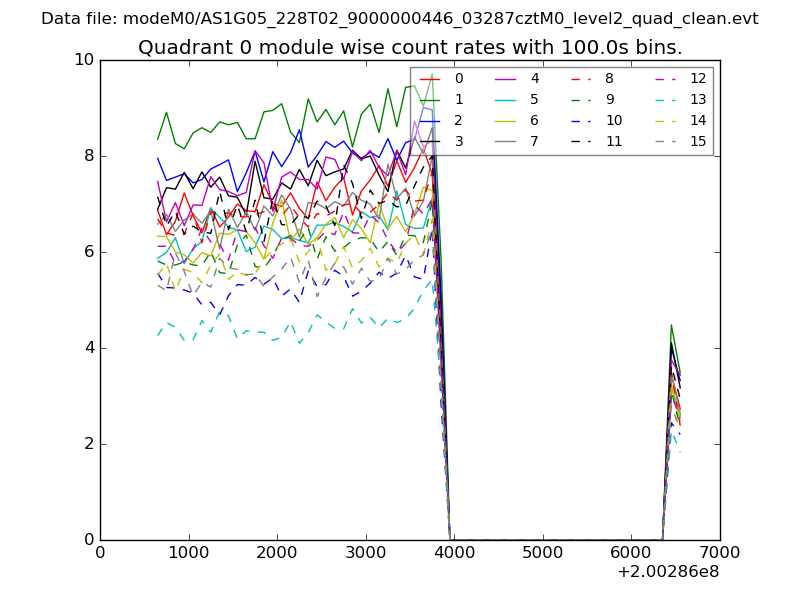
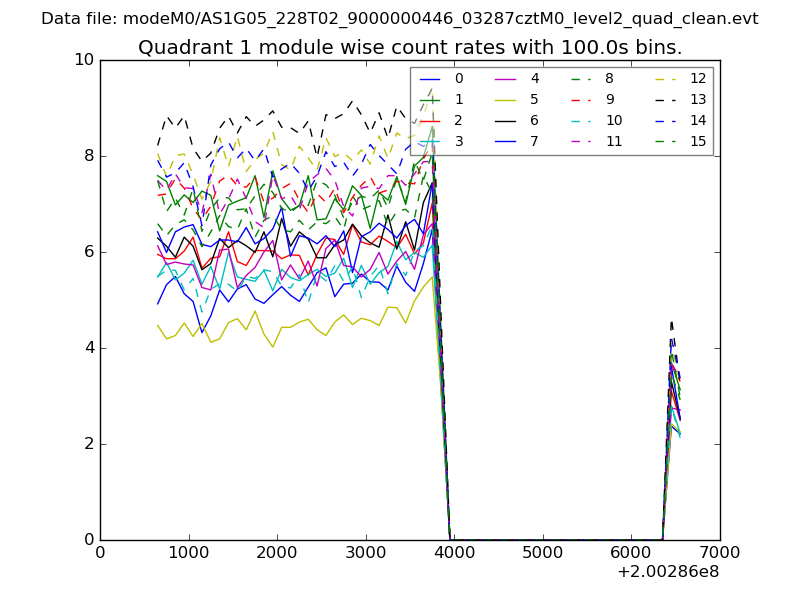
| Module-wise count rates for Quadrant A Data is divided into 100 sec bins |
 |
 |
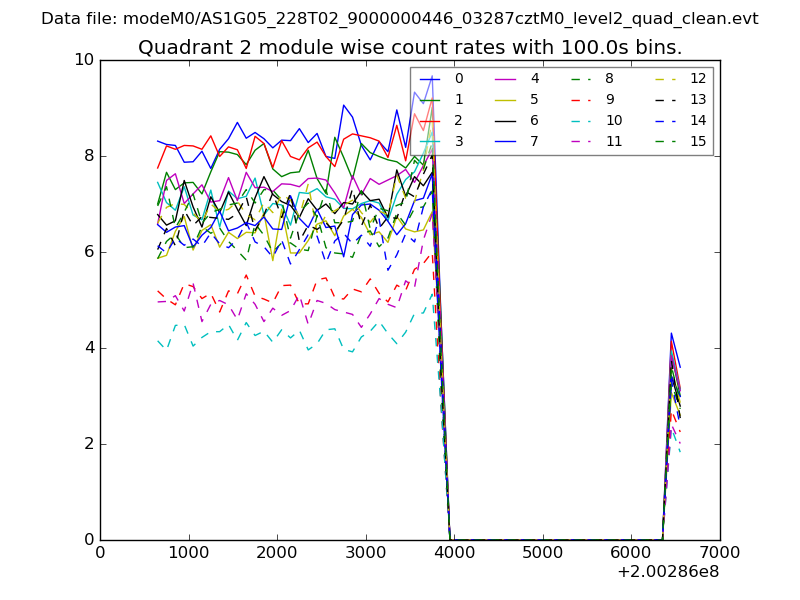
| Module-wise count rates for Quadrant B Data is divided into 100 sec bins |
 |
 |
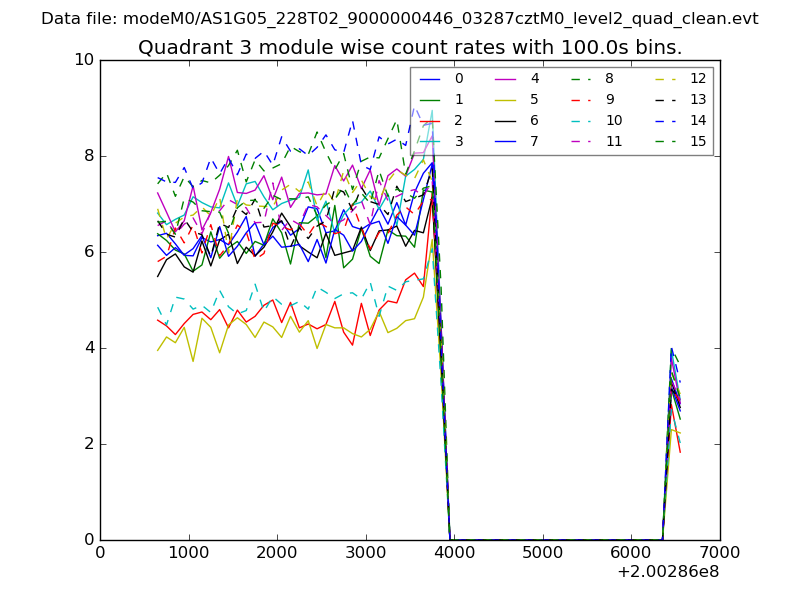
| Module-wise count rates for Quadrant C Data is divided into 100 sec bins |
 |
 |
| Module-wise count rates for Quadrant D Data is divided into 100 sec bins |
 |
 |
| Parameter | Plot |
|---|---|
| CZT HV Monitor | 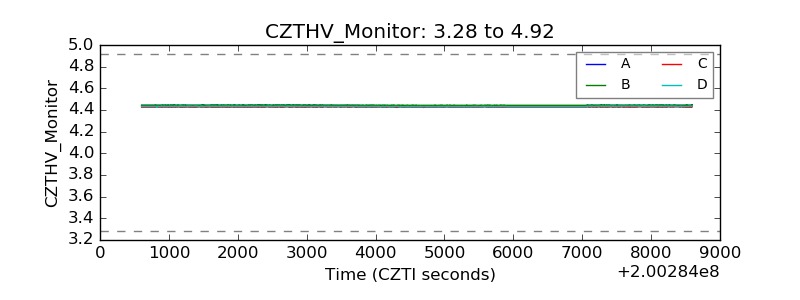 |
| D_VDD | 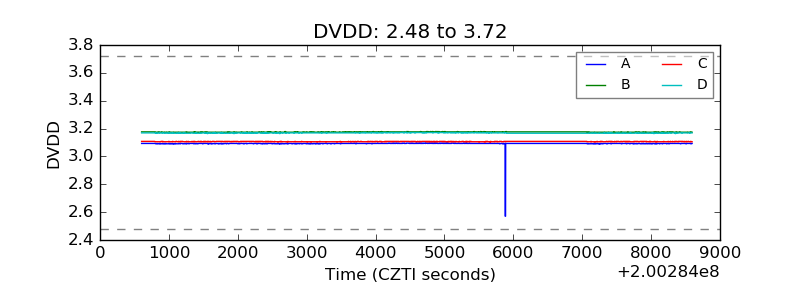 |
| Temperature 1 | 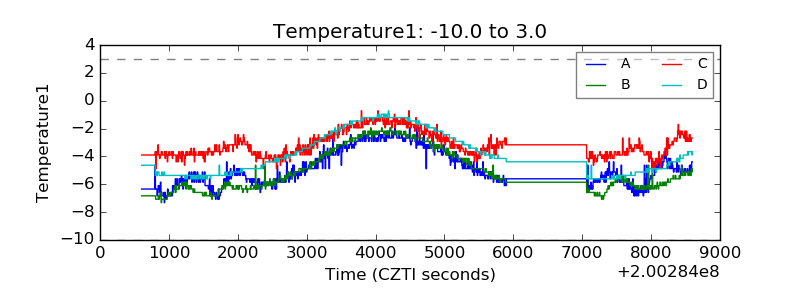 |
| Veto HV Monitor | 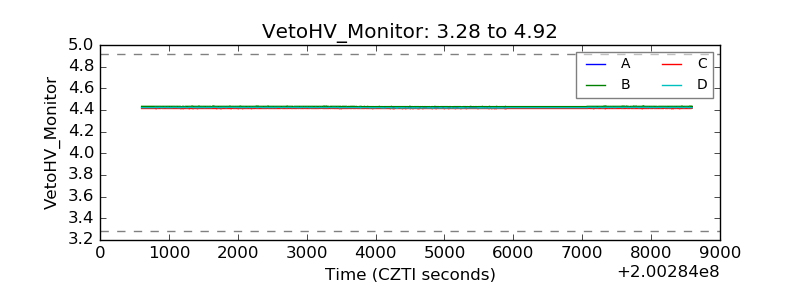 |
| Veto LLD | 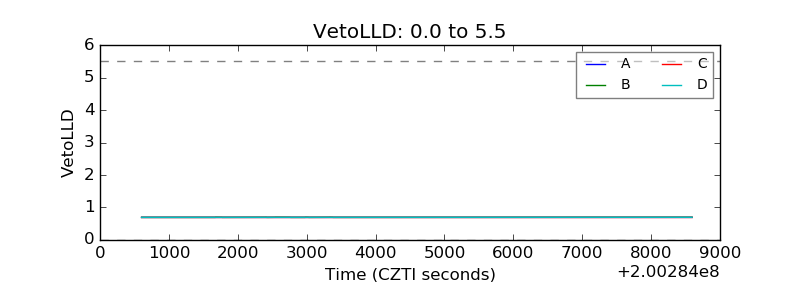 |
| Alpha Counter | 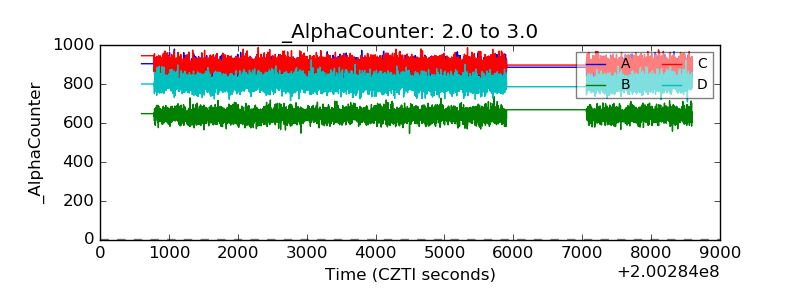 |
| _CPM_Rate | 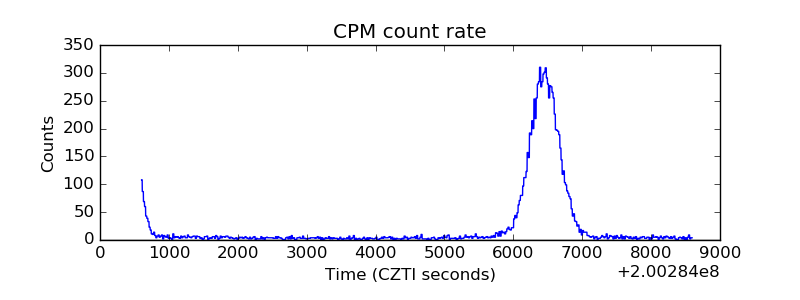 |
| CZT Counter | 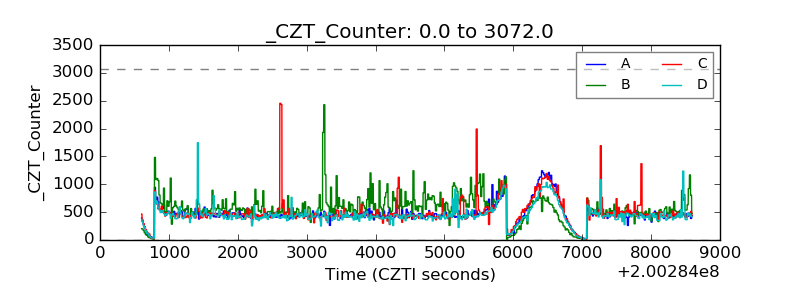 |
| +2.5 Volts monitor |  |
| +5 Volts monitor |  |
| _ROLL_ROT | 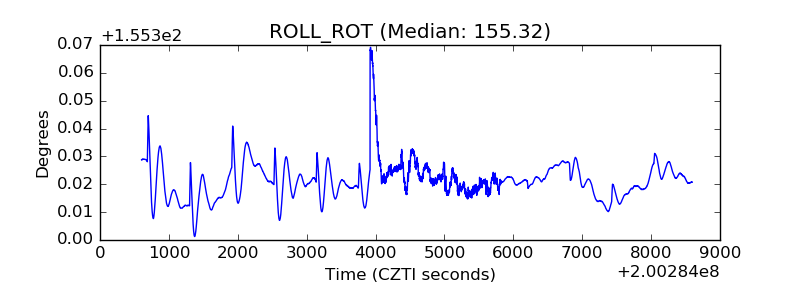 |
| _Roll_DEC | 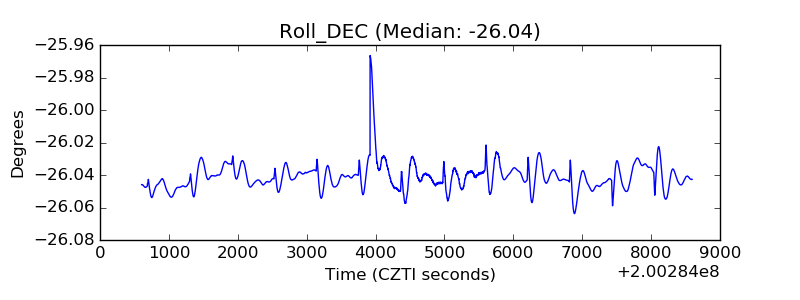 |
| _Roll_RA | 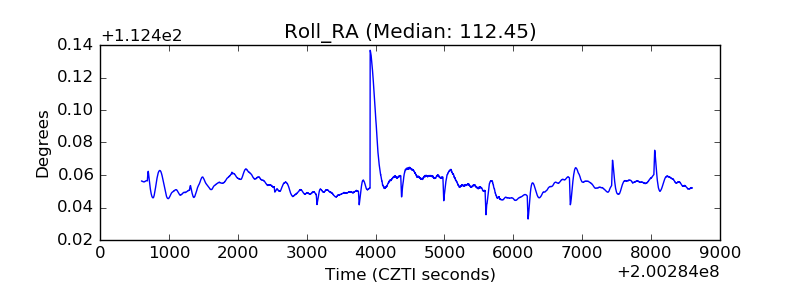 |
| Veto Counter | 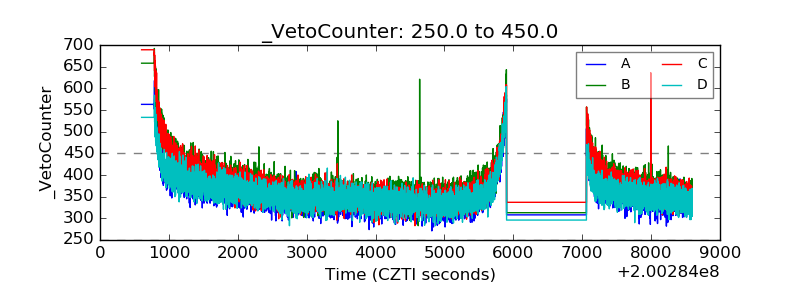 |