| Param | Original file | Final file |
|---|---|---|
| Filename | modeM0/AS1G05_228T02_9000000446_03289cztM0_level2.evt | modeM0/AS1G05_228T02_9000000446_03289cztM0_level2_quad_clean.evt |
| Size (bytes) | 556,522,560 | 74,358,720 |
| Size | 530.7 MB | 70.9 MB |
| Events in quadrant A | 3,547,711 | 434,405 |
| Events in quadrant B | 4,834,377 | 434,024 |
| Events in quadrant C | 4,456,716 | 439,577 |
| Events in quadrant D | 3,509,948 | 425,002 |
| Mode SS | |||
|---|---|---|---|
| Quadrant | BADHDUFLAG | Total packets | Discarded packets |
| A | 0 | 150 | 0 |
| B | 0 | 150 | 0 |
| C | 0 | 150 | 0 |
| D | 0 | 150 | 0 |
| Mode M0 | |||
|---|---|---|---|
| Quadrant | BADHDUFLAG | Total packets | Discarded packets |
| A | 0 | 15806 | 3 |
| B | 0 | 19276 | 2 |
| C | 0 | 18534 | 2 |
| D | 0 | 15964 | 2 |
| Mode M9 | |||
|---|---|---|---|
| Quadrant | BADHDUFLAG | Total packets | Discarded packets |
| A | 0 | 5 | 0 |
| B | 0 | 5 | 0 |
| C | 0 | 5 | 0 |
| D | 0 | 6 | 0 |
| Quadrant | Total seconds | Saturated seconds | Saturation percentage |
|---|---|---|---|
| A | 7460 | 279 | 3.739946% |
| B | 7460 | 309 | 4.142091% |
| C | 7460 | 256 | 3.431635% |
| D | 7460 | 200 | 2.680965% |
Noise dominated data is calculated using 1-second bins in cleaned event files. If a bin has >2000 counts, and if more than 50% of those come from <1% of pixels, then it is considered to be noise-dominated and hence unusable.
| Quadrant | # 1 sec bins | Bins with >0 counts | Bins with >2000 counts | High rate bins dominated by noise | Noise dominated (total time) | Noise dominated (detector-on time) | Marked lightcurve |
|---|---|---|---|---|---|---|---|
| A | 7775 | 7462 | 16 | 16 | 0.21% | 0.21% | 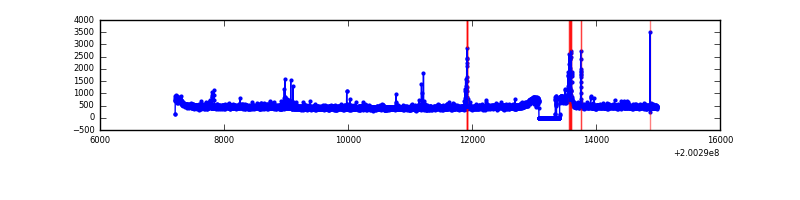 |
| B | 7775 | 7462 | 54 | 54 | 0.69% | 0.72% | 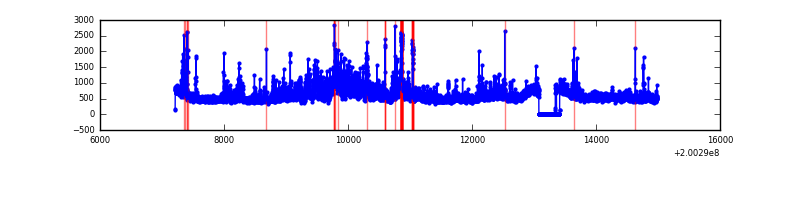 |
| C | 7775 | 7462 | 48 | 48 | 0.62% | 0.64% | 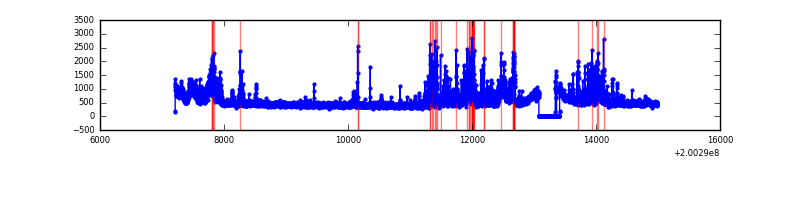 |
| D | 7775 | 7462 | 21 | 21 | 0.27% | 0.28% | 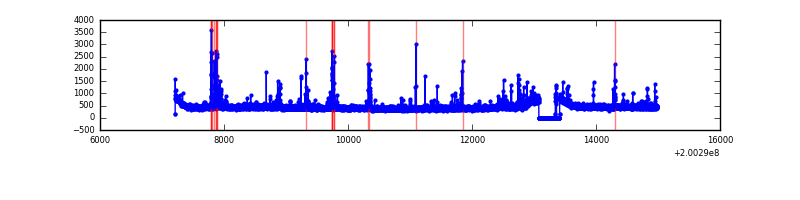 |
Top three noisy pixels from each quadrant. If the there are fewer than three noisy pixels in the level2.evt file, extra rows are filled as -1
| Pixel properties | Quadrant properties | ||||||
|---|---|---|---|---|---|---|---|
| Quadrant | DetID | PixID | Counts | Sigma | Mean | Median | Sigma |
| A | 0 | 50 | 95152 | 516.2 | 879 | 857 | 182.7 |
| A | 0 | 118 | 55758 | 300.54 | 879 | 857 | 182.7 |
| A | 0 | 226 | 13946 | 71.65 | 879 | 857 | 182.7 |
| B | 15 | 204 | 944782 | 5349.83 | 890 | 866 | 176.4 |
| B | 2 | 249 | 210175 | 1186.3 | 890 | 866 | 176.4 |
| B | 3 | 0 | 161043 | 907.83 | 890 | 866 | 176.4 |
| C | 14 | 223 | 432089 | 2137.85 | 858 | 860 | 201.7 |
| C | 12 | 175 | 271402 | 1341.23 | 858 | 860 | 201.7 |
| C | 6 | 80 | 201713 | 995.74 | 858 | 860 | 201.7 |
| D | 13 | 223 | 96891 | 459.83 | 855 | 829 | 208.9 |
| D | 13 | 239 | 72799 | 344.5 | 855 | 829 | 208.9 |
| D | 5 | 233 | 59756 | 282.07 | 855 | 829 | 208.9 |
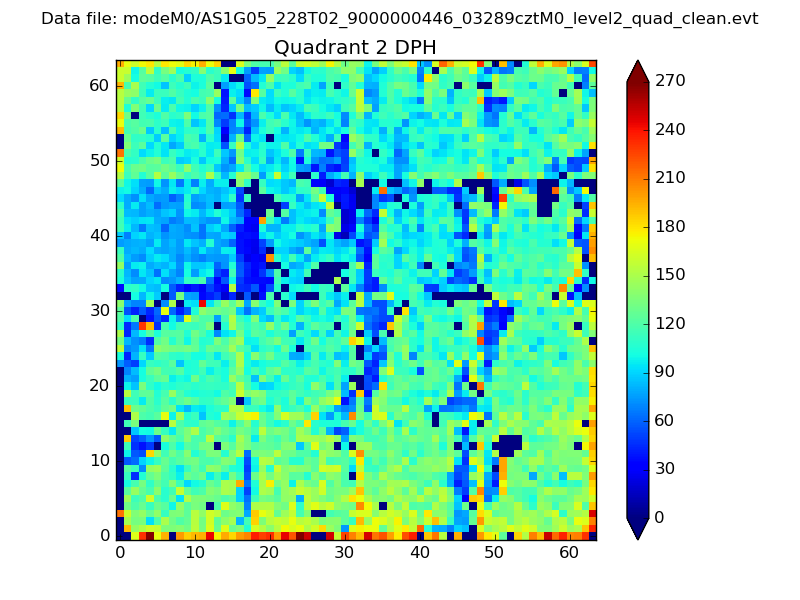
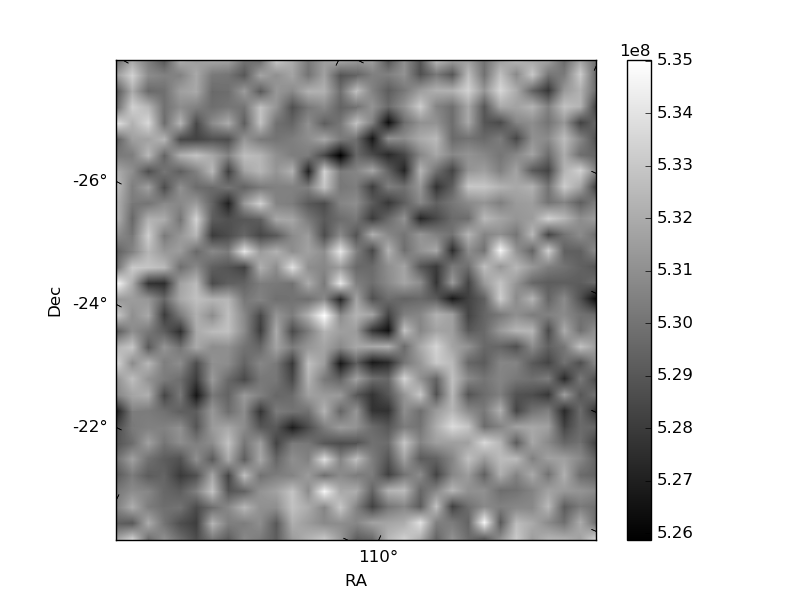
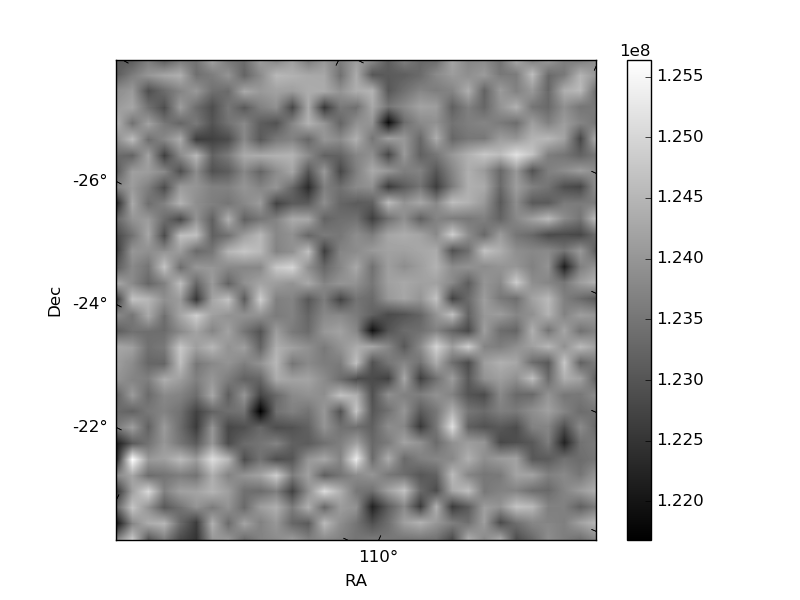
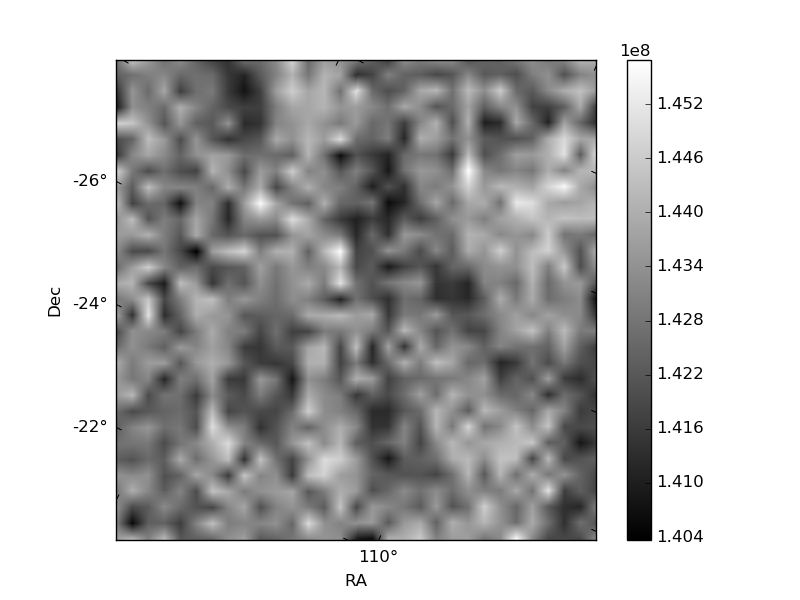
Histogram calculated using DETX and DETY for each event in the final _common_clean file
| Quadrant A | 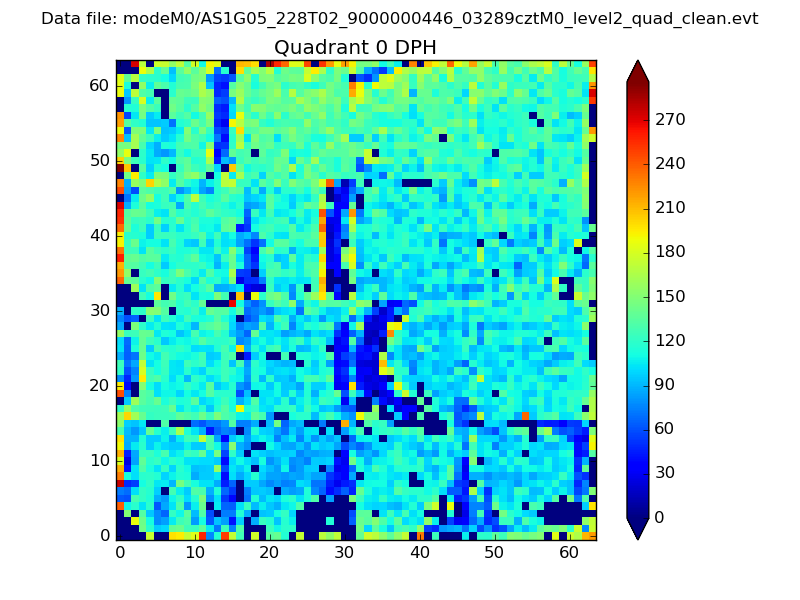 |
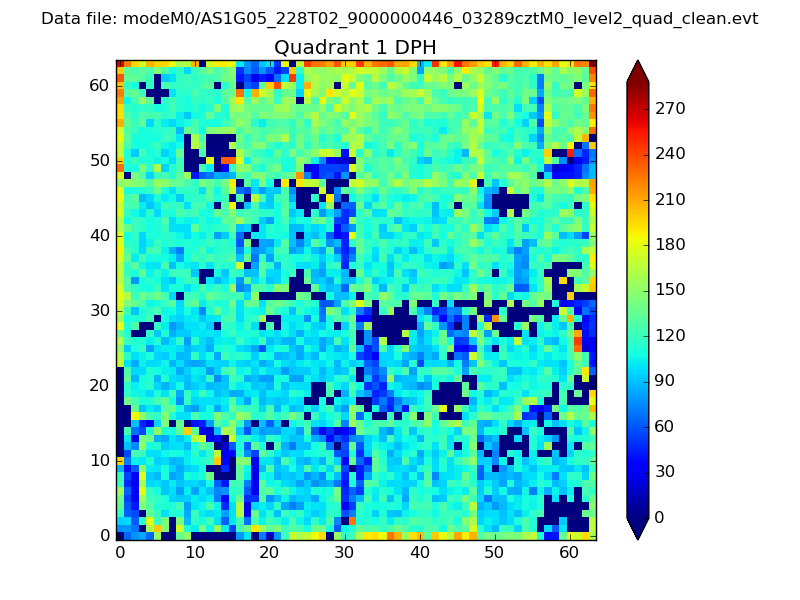 |
Quadrant B |
|---|---|---|---|
| Quadrant D | 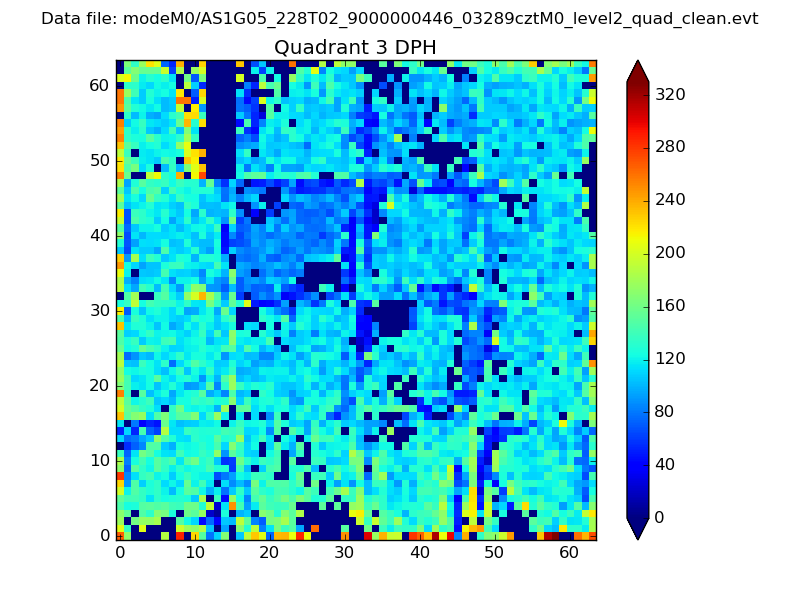 |
 |
Quadrant C |
| Plot type | Count rate plots | Images |
|---|---|---|
| Comparison with Poisson distribution Blue bars denote a histogram of data divided into 1 sec bins. Red curve is a Poisson curve with rate = median count rate of data. |
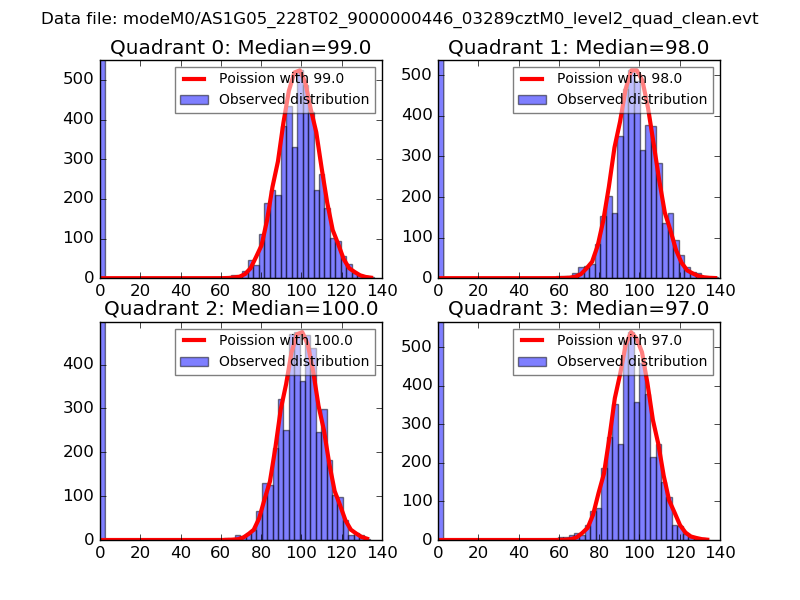 |
 |
| Quadrant-wise count rates Data is divided into 100 sec bins |
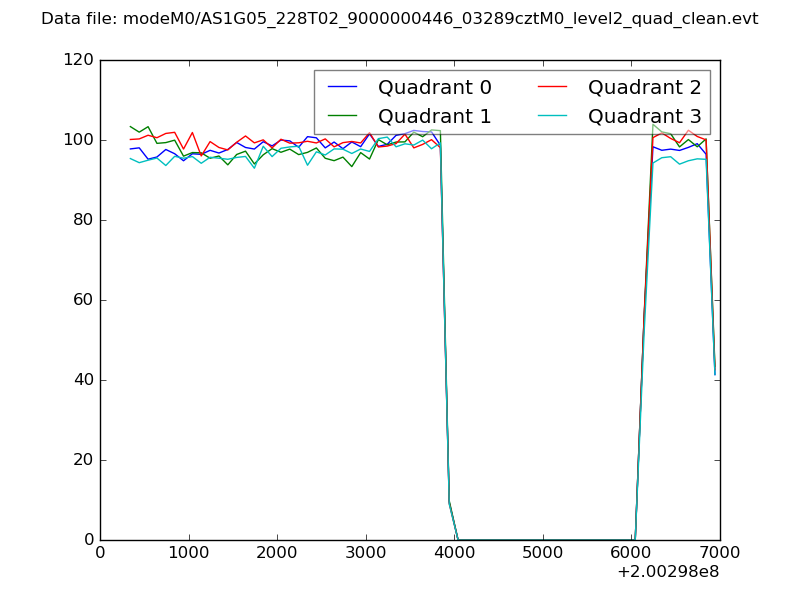 |
|
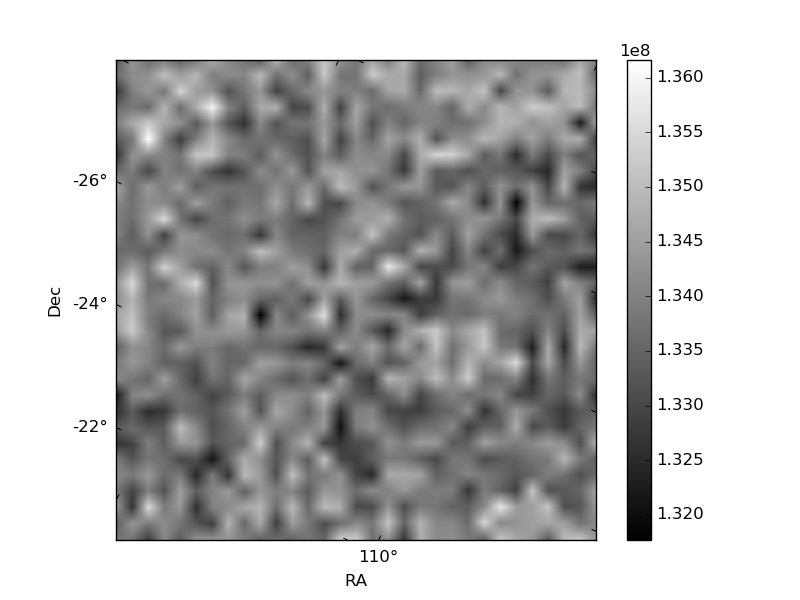
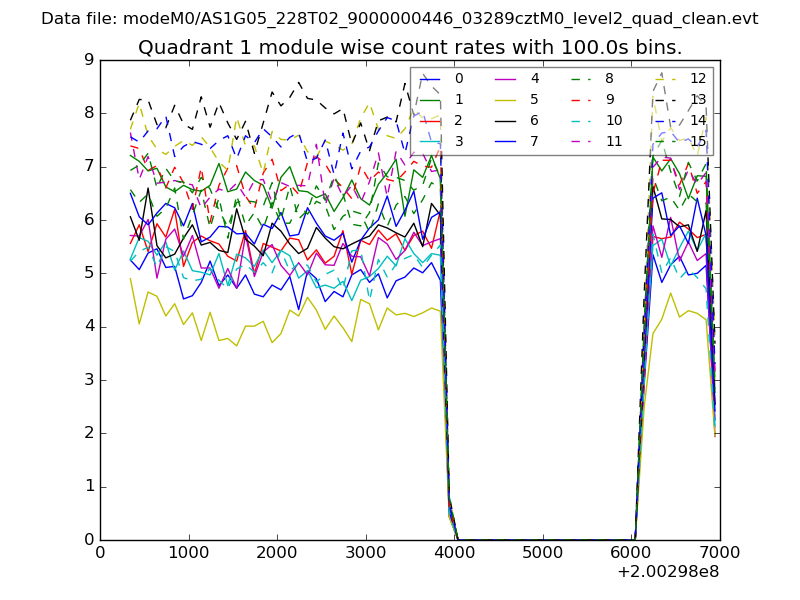
| Module-wise count rates for Quadrant A Data is divided into 100 sec bins |
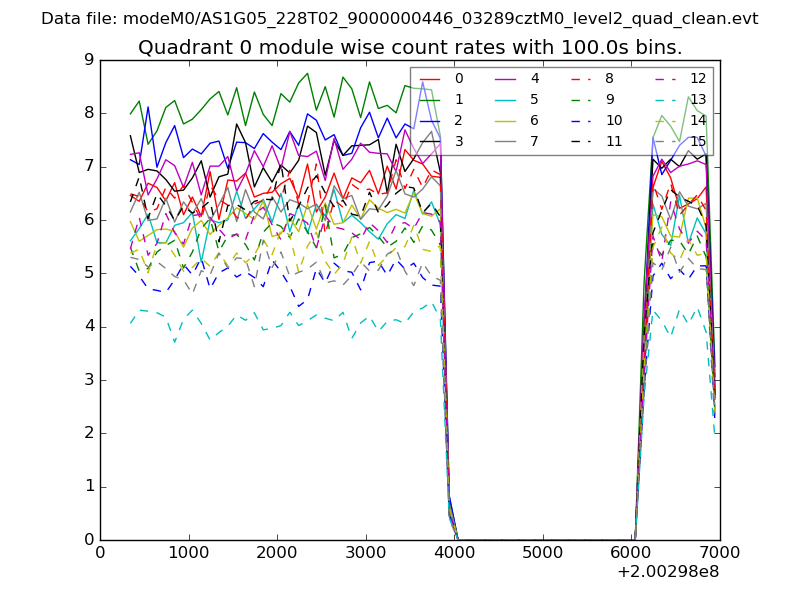 |
 |
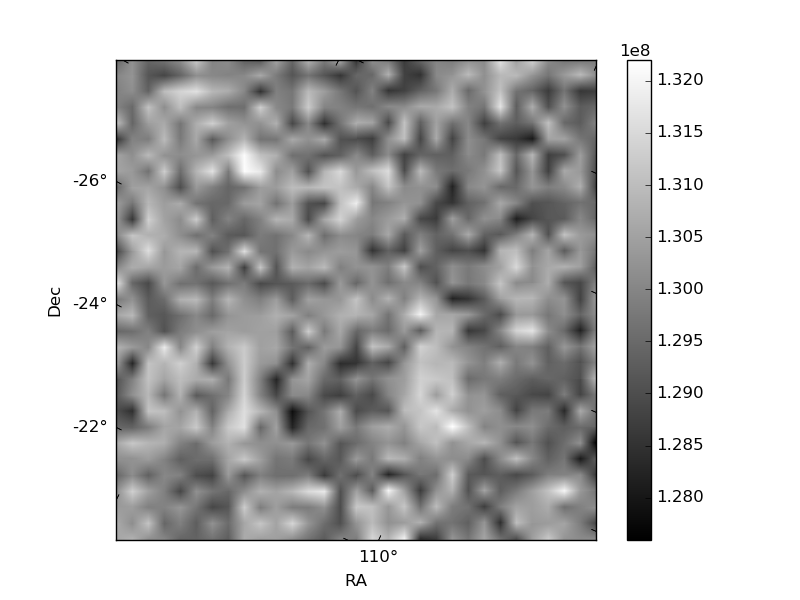
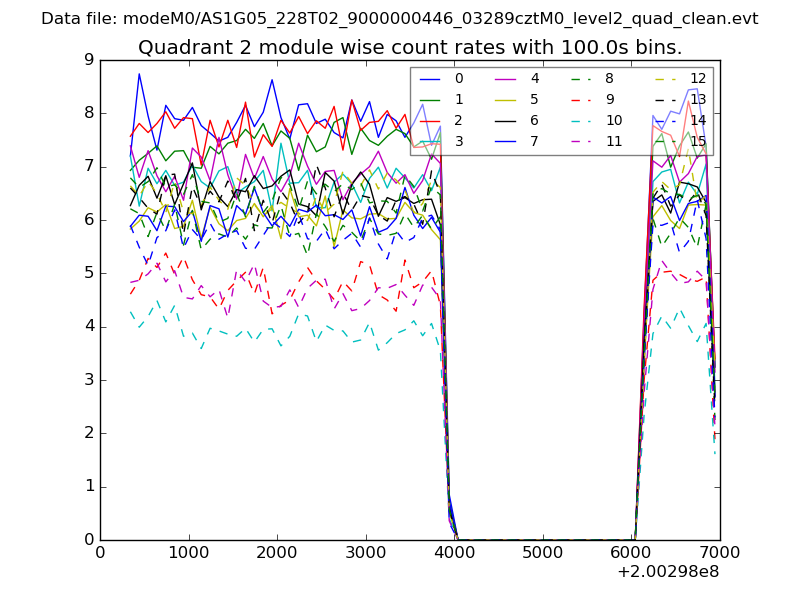
| Module-wise count rates for Quadrant B Data is divided into 100 sec bins |
 |
 |
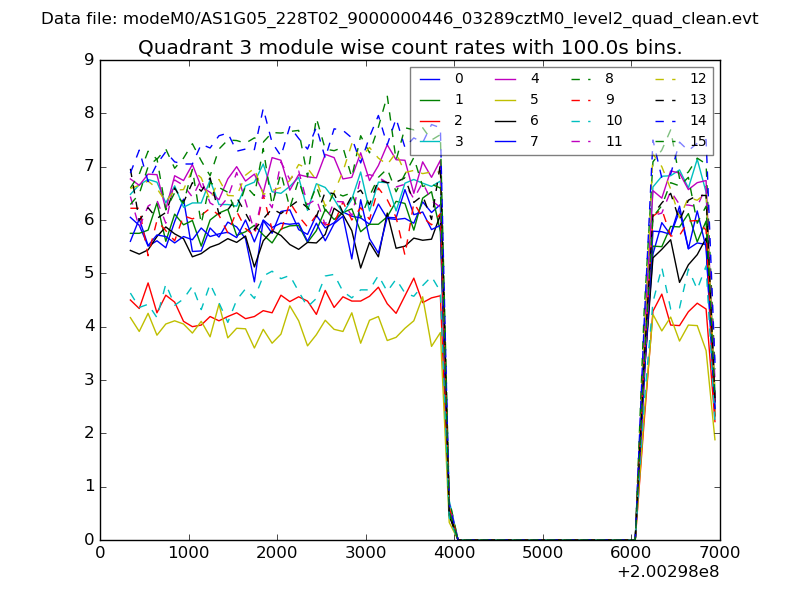
| Module-wise count rates for Quadrant C Data is divided into 100 sec bins |
 |
 |
| Module-wise count rates for Quadrant D Data is divided into 100 sec bins |
 |
 |
| Parameter | Plot |
|---|---|
| CZT HV Monitor | 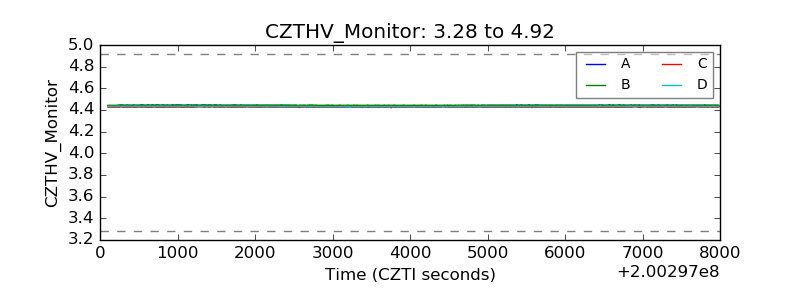 |
| D_VDD | 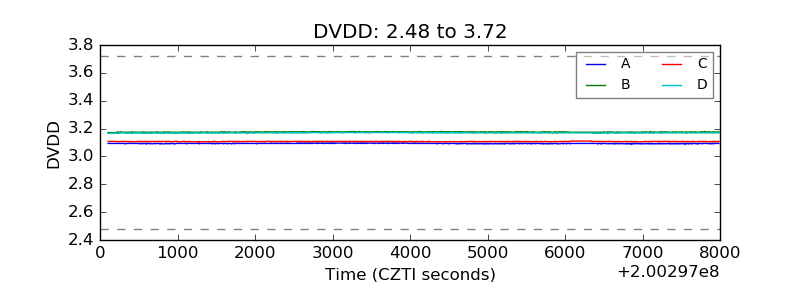 |
| Temperature 1 | 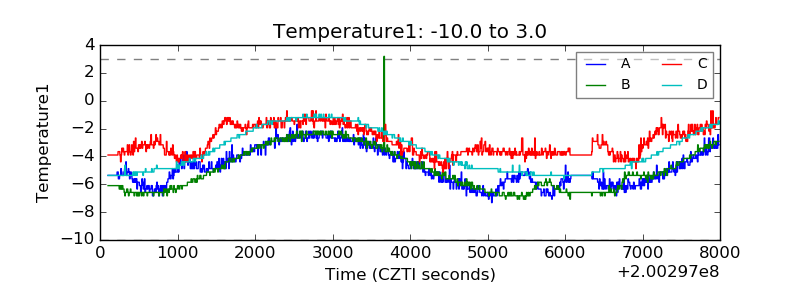 |
| Veto HV Monitor | 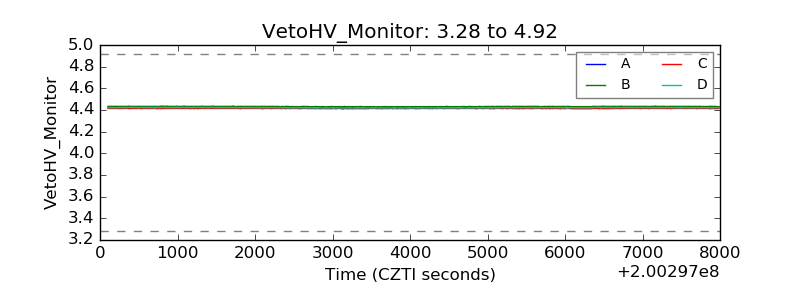 |
| Veto LLD | 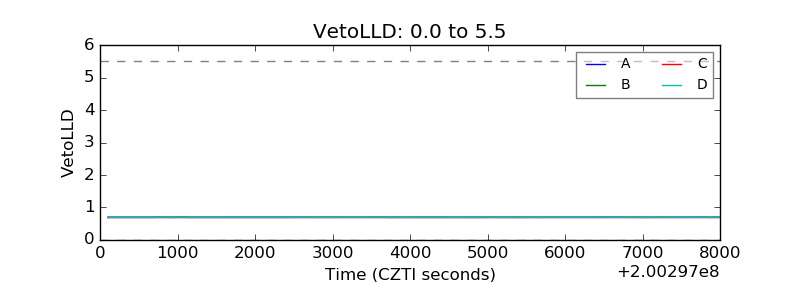 |
| Alpha Counter | 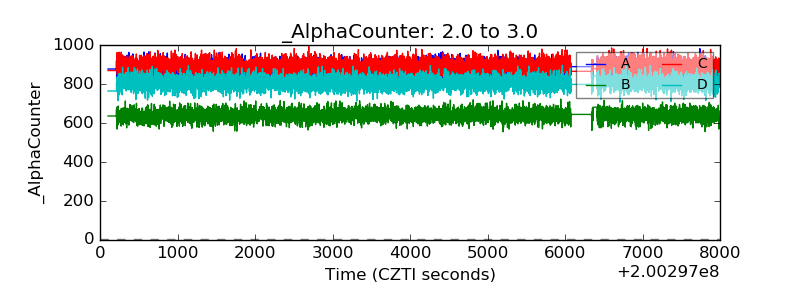 |
| _CPM_Rate | 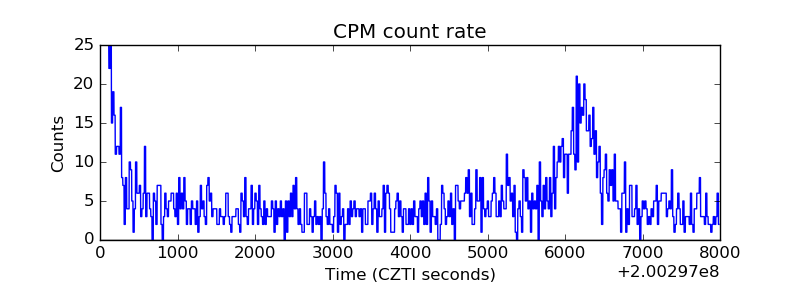 |
| CZT Counter | 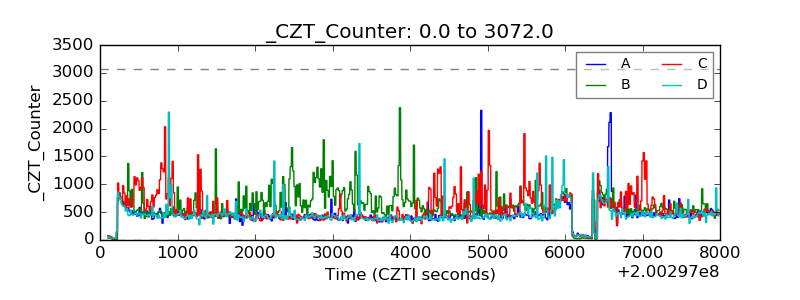 |
| +2.5 Volts monitor |  |
| +5 Volts monitor |  |
| _ROLL_ROT | 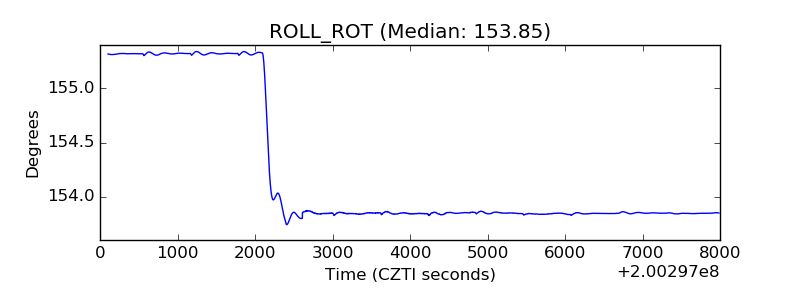 |
| _Roll_DEC | 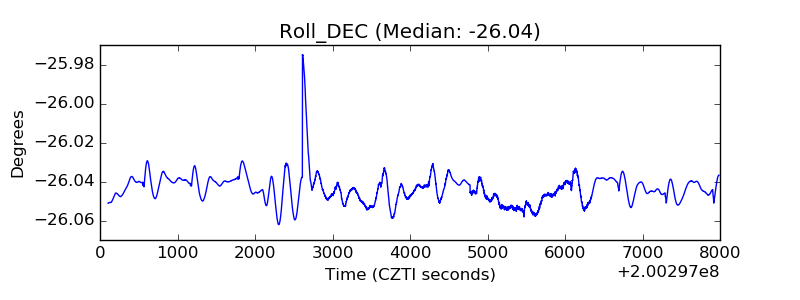 |
| _Roll_RA | 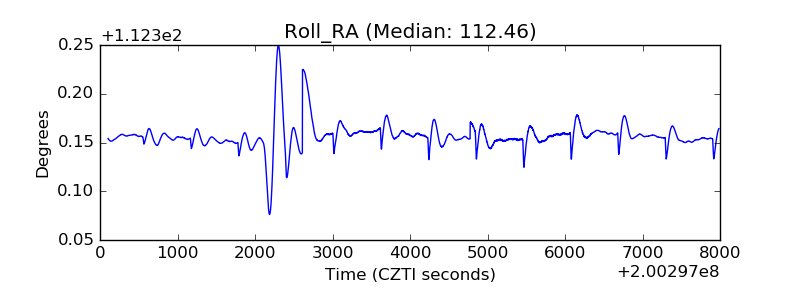 |
| Veto Counter | 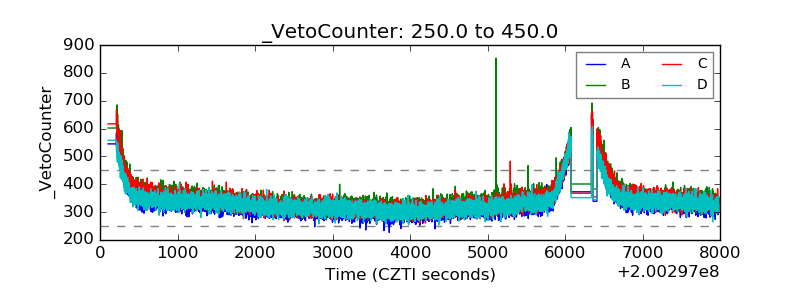 |