| Param | Original file | Final file |
|---|---|---|
| Filename | modeM0/AS1G05_228T02_9000000446_03290cztM0_level2.evt | modeM0/AS1G05_228T02_9000000446_03290cztM0_level2_quad_clean.evt |
| Size (bytes) | 496,638,720 | 81,095,040 |
| Size | 473.6 MB | 77.3 MB |
| Events in quadrant A | 3,407,378 | 490,725 |
| Events in quadrant B | 4,167,198 | 489,156 |
| Events in quadrant C | 3,593,954 | 493,850 |
| Events in quadrant D | 3,380,473 | 478,188 |
| Mode SS | |||
|---|---|---|---|
| Quadrant | BADHDUFLAG | Total packets | Discarded packets |
| A | 0 | 144 | 0 |
| B | 0 | 144 | 0 |
| C | 0 | 144 | 0 |
| D | 0 | 144 | 0 |
| Mode M0 | |||
|---|---|---|---|
| Quadrant | BADHDUFLAG | Total packets | Discarded packets |
| A | 0 | 15275 | 1 |
| B | 0 | 16793 | 0 |
| C | 0 | 15699 | 0 |
| D | 0 | 15481 | 0 |
| Quadrant | Total seconds | Saturated seconds | Saturation percentage |
|---|---|---|---|
| A | 7238 | 233 | 3.219121% |
| B | 7238 | 262 | 3.619784% |
| C | 7238 | 115 | 1.588837% |
| D | 7238 | 130 | 1.796076% |
Noise dominated data is calculated using 1-second bins in cleaned event files. If a bin has >2000 counts, and if more than 50% of those come from <1% of pixels, then it is considered to be noise-dominated and hence unusable.
| Quadrant | # 1 sec bins | Bins with >0 counts | Bins with >2000 counts | High rate bins dominated by noise | Noise dominated (total time) | Noise dominated (detector-on time) | Marked lightcurve |
|---|---|---|---|---|---|---|---|
| A | 7238 | 7238 | 8 | 8 | 0.11% | 0.11% | 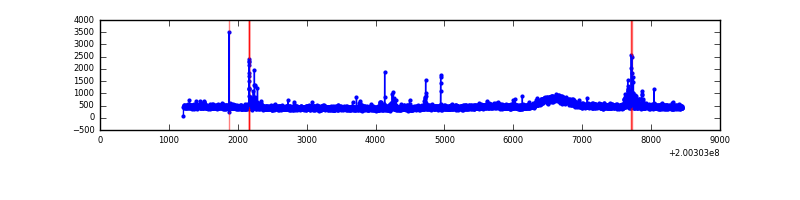 |
| B | 7238 | 7238 | 21 | 21 | 0.29% | 0.29% | 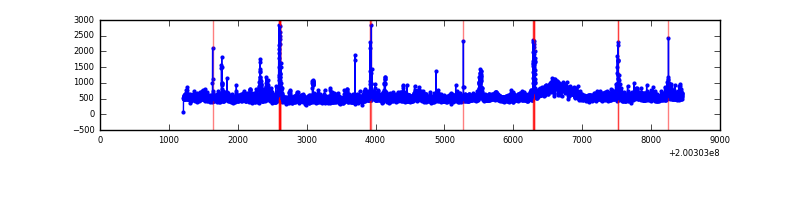 |
| C | 7238 | 7238 | 11 | 11 | 0.15% | 0.15% | 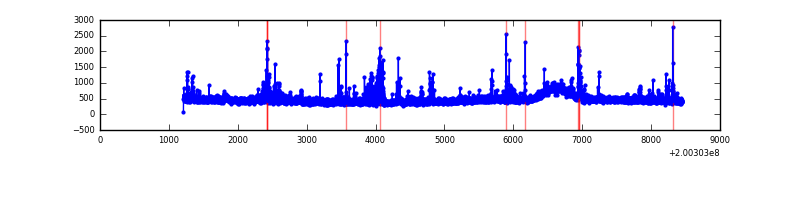 |
| D | 7238 | 7238 | 18 | 18 | 0.25% | 0.25% | 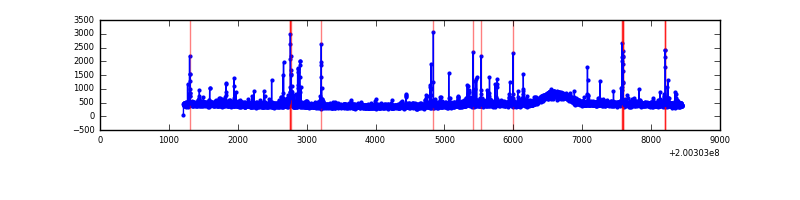 |
Top three noisy pixels from each quadrant. If the there are fewer than three noisy pixels in the level2.evt file, extra rows are filled as -1
| Pixel properties | Quadrant properties | ||||||
|---|---|---|---|---|---|---|---|
| Quadrant | DetID | PixID | Counts | Sigma | Mean | Median | Sigma |
| A | 0 | 118 | 78482 | 436.74 | 854 | 836 | 177.8 |
| A | 14 | 249 | 19799 | 106.66 | 854 | 836 | 177.8 |
| A | 0 | 226 | 15983 | 85.2 | 854 | 836 | 177.8 |
| B | 15 | 204 | 593520 | 3512.83 | 859 | 837 | 168.7 |
| B | 2 | 249 | 119756 | 704.83 | 859 | 837 | 168.7 |
| B | 14 | 167 | 64179 | 375.43 | 859 | 837 | 168.7 |
| C | 6 | 80 | 127314 | 643.32 | 831 | 832 | 196.6 |
| C | 2 | 53 | 94753 | 477.7 | 831 | 832 | 196.6 |
| C | 7 | 220 | 70427 | 353.98 | 831 | 832 | 196.6 |
| D | 5 | 233 | 117341 | 574.44 | 832 | 805 | 202.9 |
| D | 13 | 223 | 59834 | 290.97 | 832 | 805 | 202.9 |
| D | 13 | 239 | 31008 | 148.88 | 832 | 805 | 202.9 |
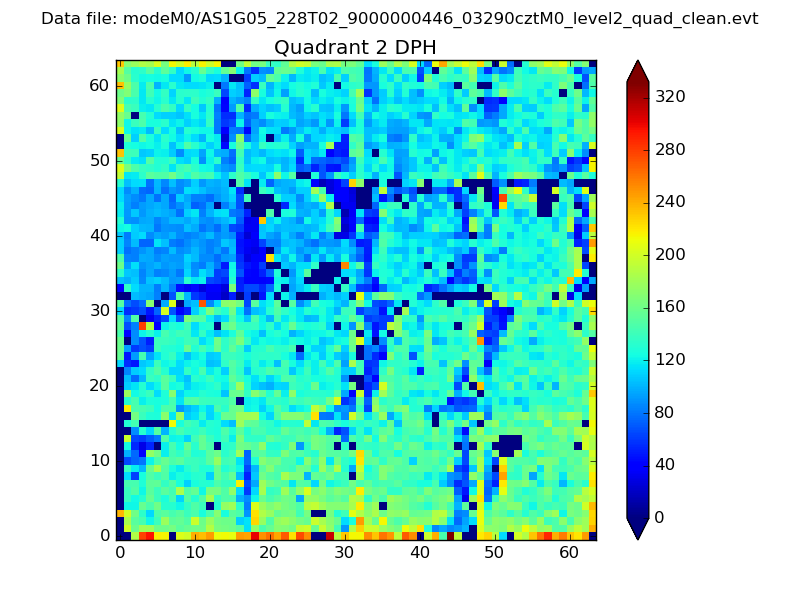
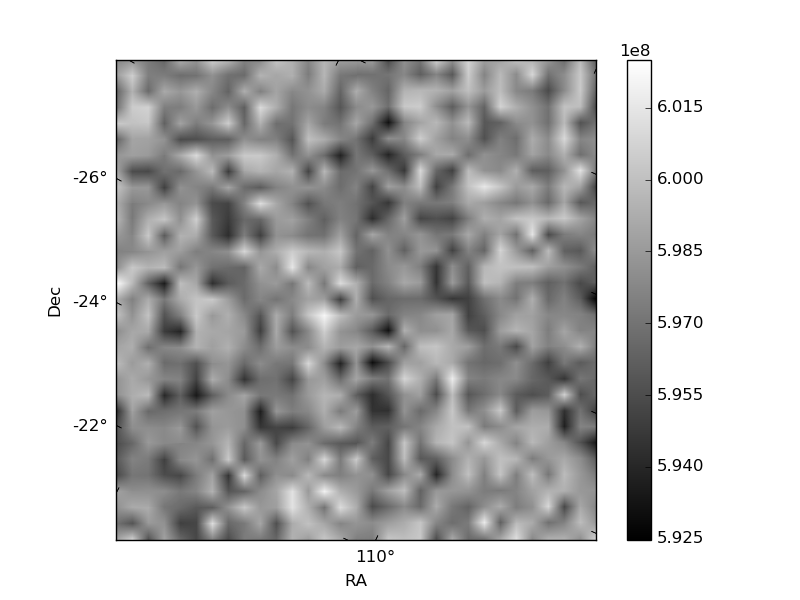
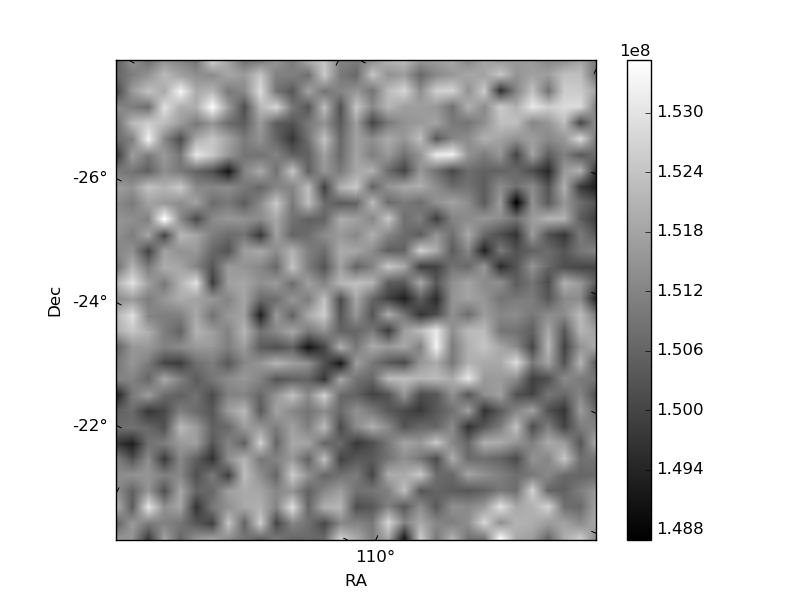
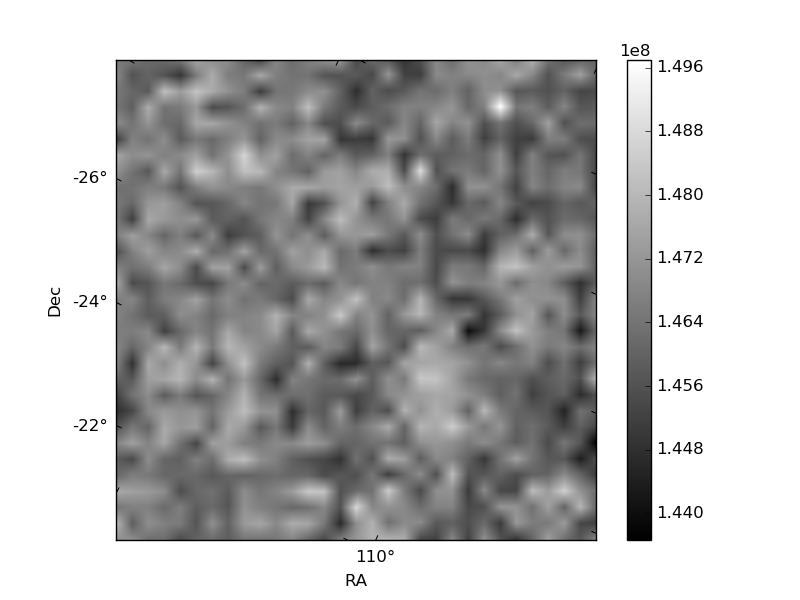
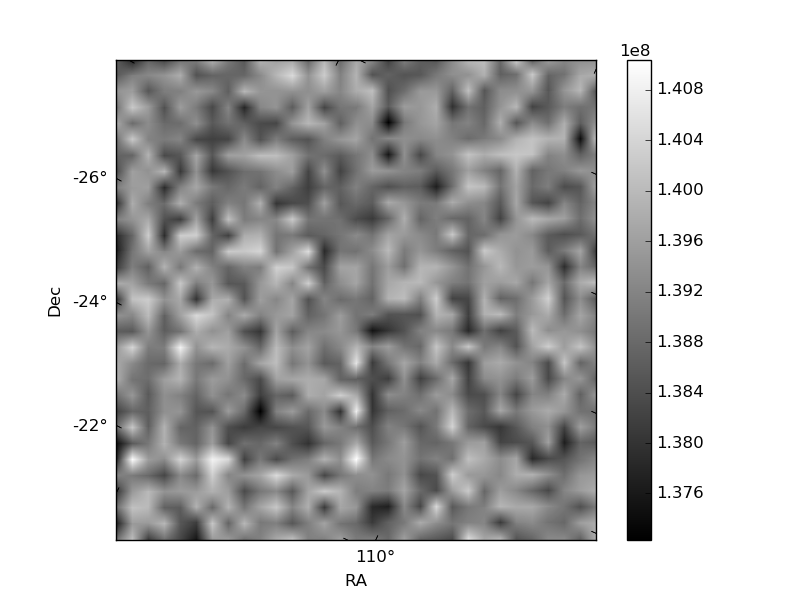
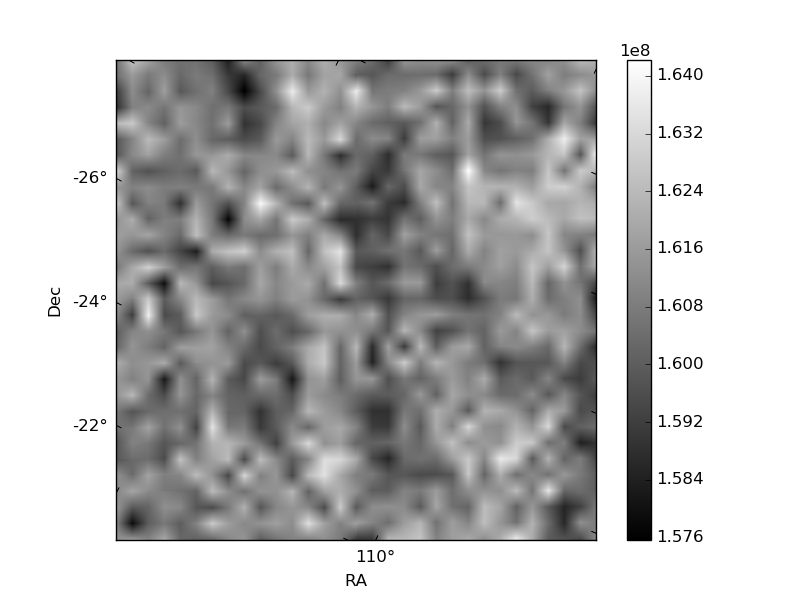
Histogram calculated using DETX and DETY for each event in the final _common_clean file
| Quadrant A | 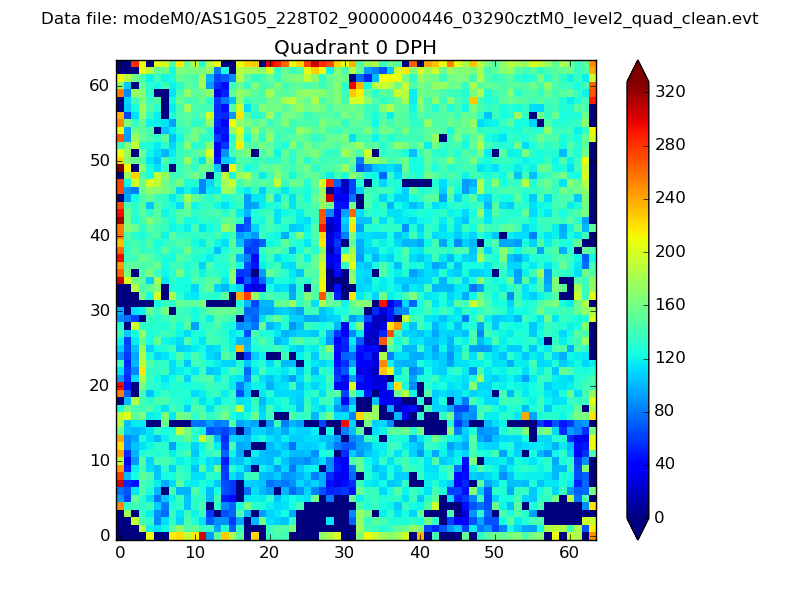 |
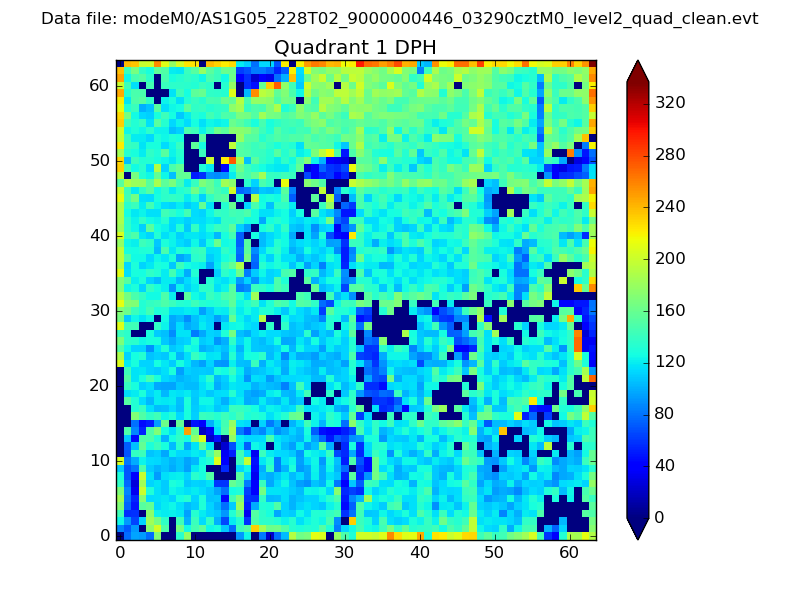 |
Quadrant B |
|---|---|---|---|
| Quadrant D | 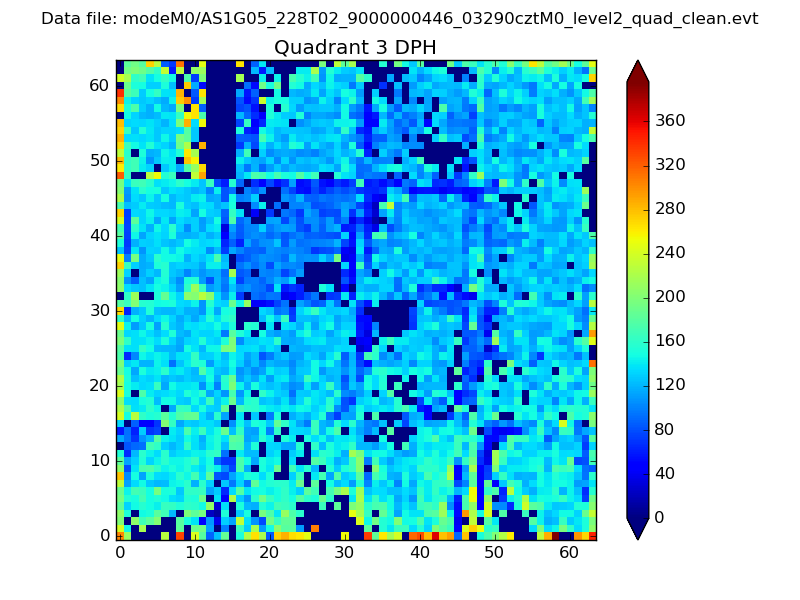 |
 |
Quadrant C |
| Plot type | Count rate plots | Images |
|---|---|---|
| Comparison with Poisson distribution Blue bars denote a histogram of data divided into 1 sec bins. Red curve is a Poisson curve with rate = median count rate of data. |
 |
 |
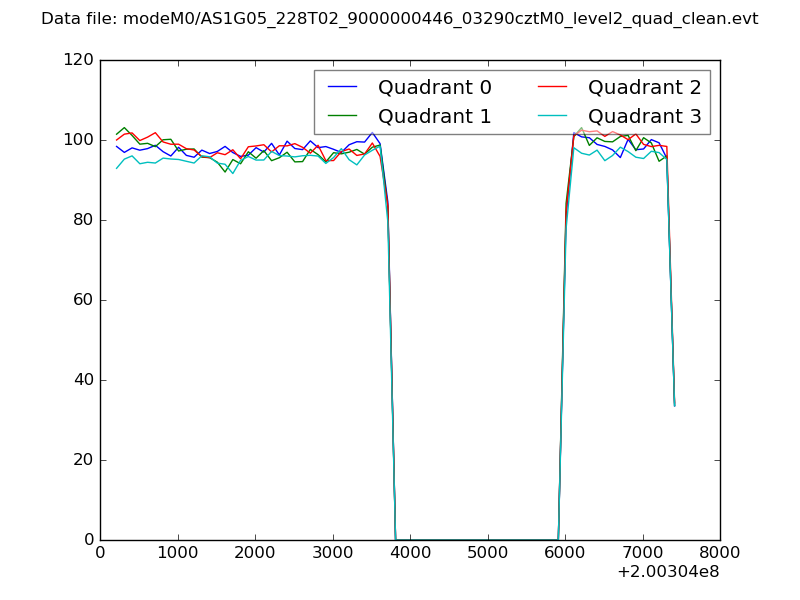
| Quadrant-wise count rates Data is divided into 100 sec bins |
 |
|
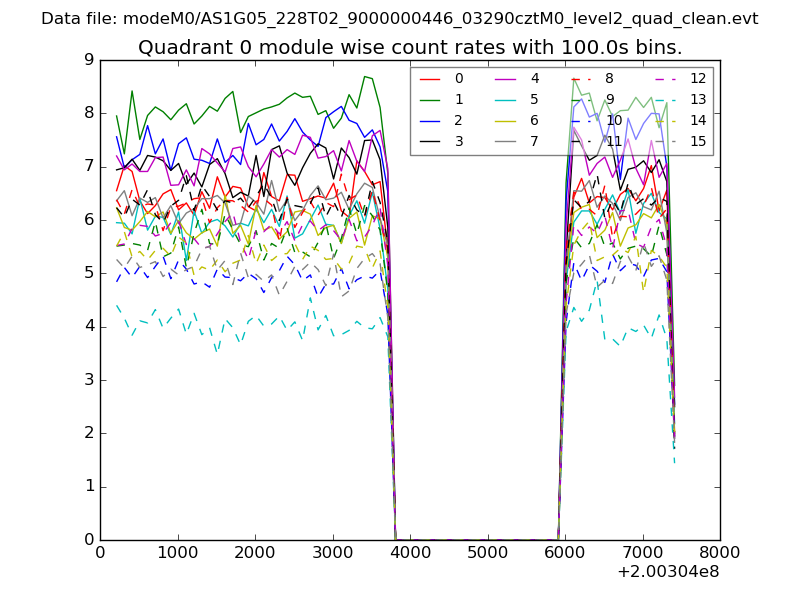
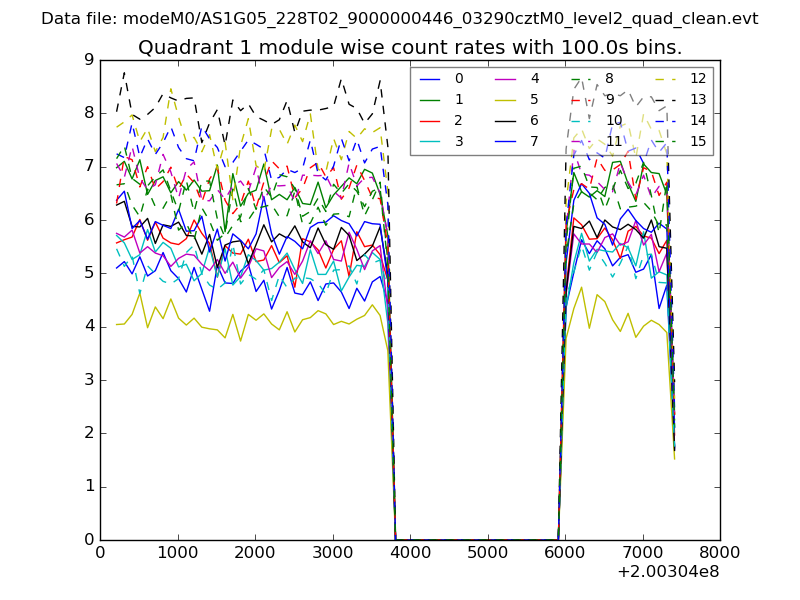
| Module-wise count rates for Quadrant A Data is divided into 100 sec bins |
 |
 |
| Module-wise count rates for Quadrant B Data is divided into 100 sec bins |
 |
 |
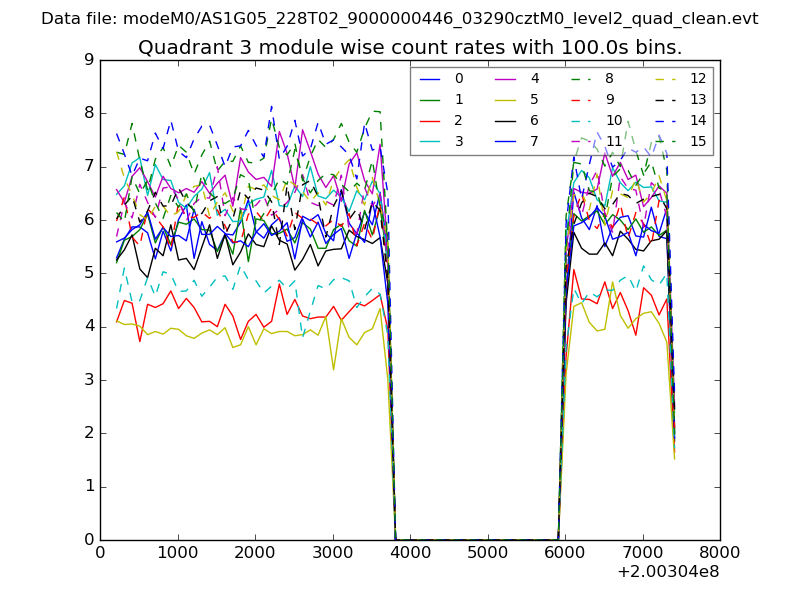
| Module-wise count rates for Quadrant C Data is divided into 100 sec bins |
 |
 |
| Module-wise count rates for Quadrant D Data is divided into 100 sec bins |
 |
 |
| Parameter | Plot |
|---|---|
| CZT HV Monitor | 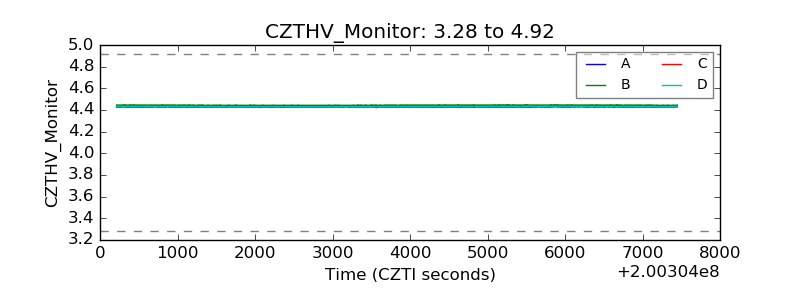 |
| D_VDD | 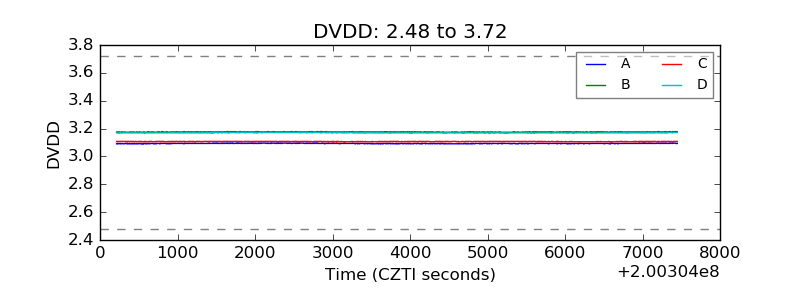 |
| Temperature 1 | 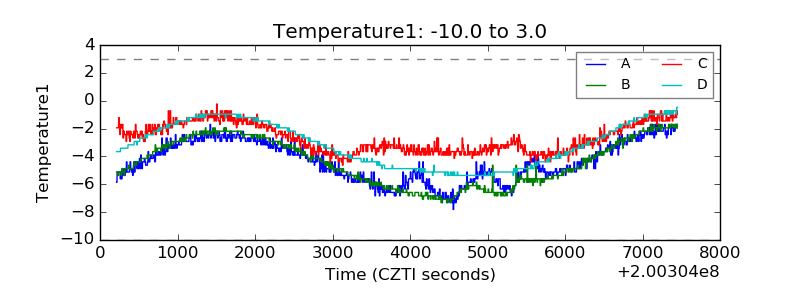 |
| Veto HV Monitor | 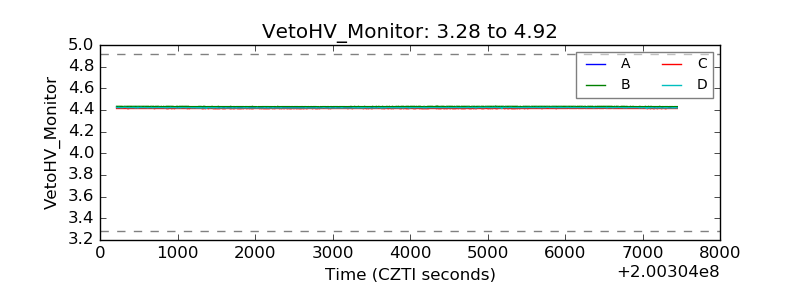 |
| Veto LLD | 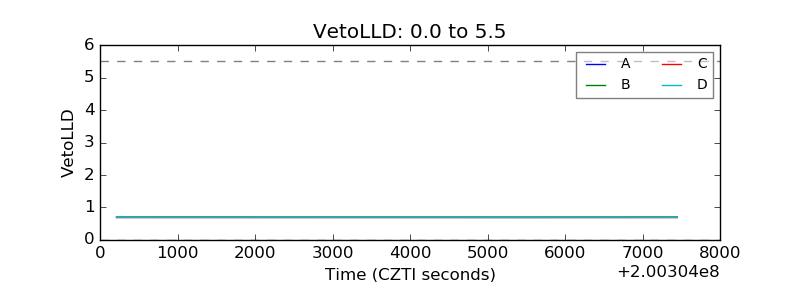 |
| Alpha Counter | 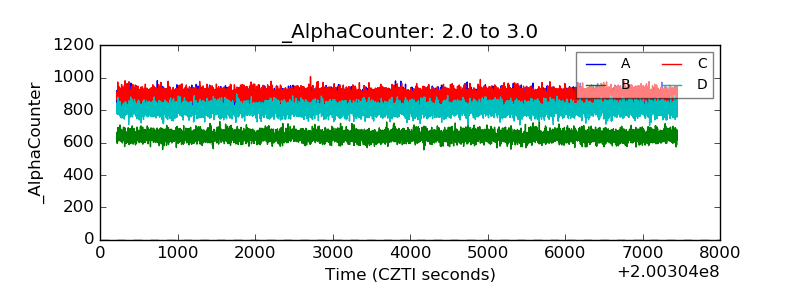 |
| _CPM_Rate | 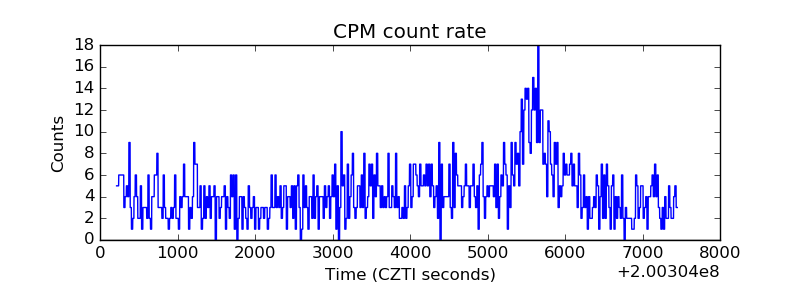 |
| CZT Counter | 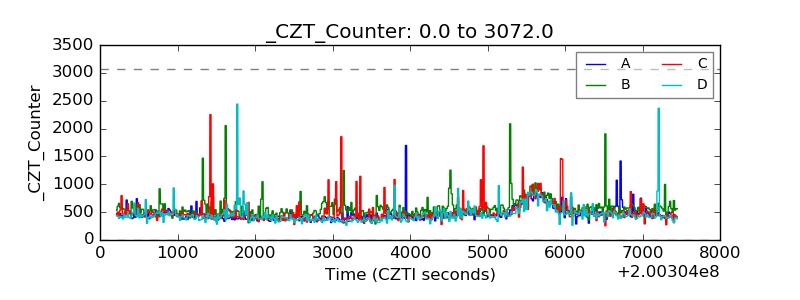 |
| +2.5 Volts monitor |  |
| +5 Volts monitor |  |
| _ROLL_ROT | 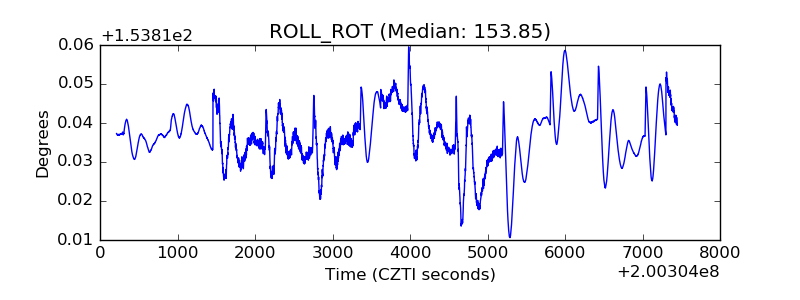 |
| _Roll_DEC | 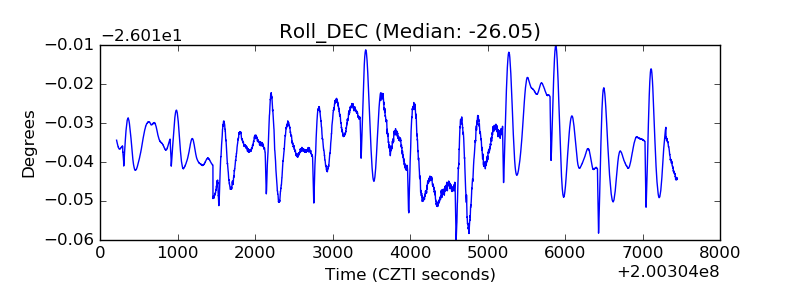 |
| _Roll_RA | 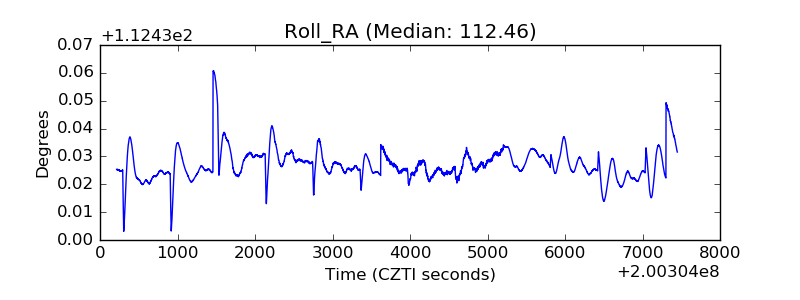 |
| Veto Counter | 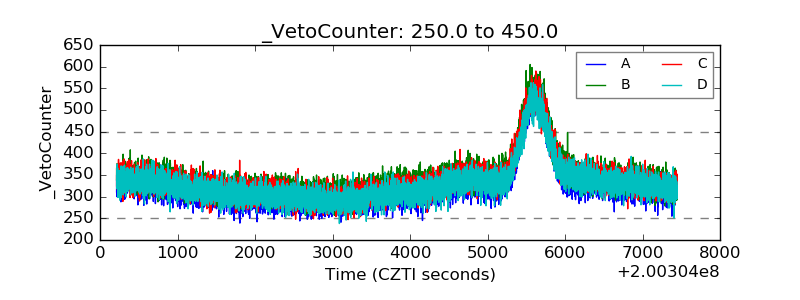 |