| Param | Original file | Final file |
|---|---|---|
| Filename | modeM0/AS1G05_228T02_9000000446_03294cztM0_level2.evt | modeM0/AS1G05_228T02_9000000446_03294cztM0_level2_quad_clean.evt |
| Size (bytes) | 1,397,707,200 | 185,826,240 |
| Size | 1.3 GB | 177.2 MB |
| Events in quadrant A | 8,262,155 | 1,118,060 |
| Events in quadrant B | 12,172,062 | 1,100,874 |
| Events in quadrant C | 11,949,774 | 1,086,926 |
| Events in quadrant D | 8,735,472 | 1,085,238 |
| Mode SS | |||
|---|---|---|---|
| Quadrant | BADHDUFLAG | Total packets | Discarded packets |
| A | 0 | 366 | 0 |
| B | 0 | 366 | 0 |
| C | 0 | 366 | 0 |
| D | 0 | 366 | 0 |
| Mode M0 | |||
|---|---|---|---|
| Quadrant | BADHDUFLAG | Total packets | Discarded packets |
| A | 0 | 37344 | 4 |
| B | 0 | 48349 | 3 |
| C | 0 | 48013 | 3 |
| D | 0 | 39678 | 3 |
| Mode M9 | |||
|---|---|---|---|
| Quadrant | BADHDUFLAG | Total packets | Discarded packets |
| A | 0 | 18 | 0 |
| B | 0 | 18 | 0 |
| C | 0 | 18 | 0 |
| D | 0 | 18 | 0 |
| Quadrant | Total seconds | Saturated seconds | Saturation percentage |
|---|---|---|---|
| A | 17928 | 166 | 0.925926% |
| B | 17928 | 196 | 1.093262% |
| C | 17928 | 746 | 4.161089% |
| D | 17928 | 317 | 1.768184% |
Noise dominated data is calculated using 1-second bins in cleaned event files. If a bin has >2000 counts, and if more than 50% of those come from <1% of pixels, then it is considered to be noise-dominated and hence unusable.
| Quadrant | # 1 sec bins | Bins with >0 counts | Bins with >2000 counts | High rate bins dominated by noise | Noise dominated (total time) | Noise dominated (detector-on time) | Marked lightcurve |
|---|---|---|---|---|---|---|---|
| A | 19808 | 17931 | 36 | 36 | 0.18% | 0.20% | 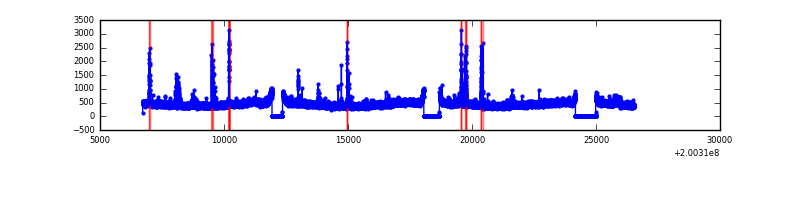 |
| B | 19808 | 17931 | 17 | 17 | 0.09% | 0.09% | 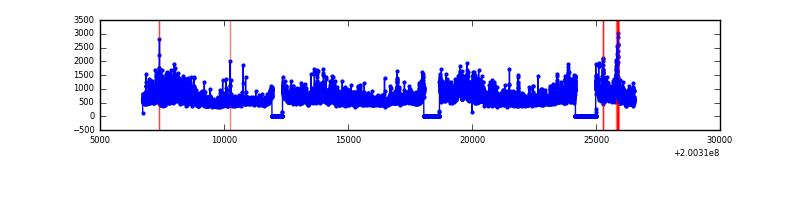 |
| C | 19808 | 17931 | 530 | 530 | 2.68% | 2.96% | 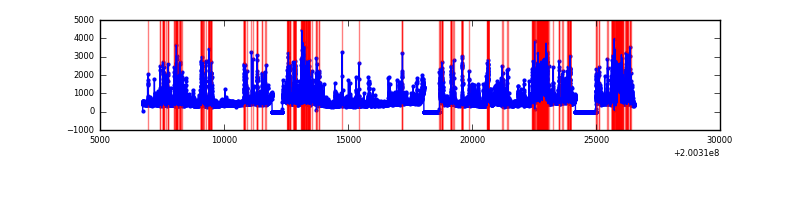 |
| D | 19808 | 17931 | 241 | 241 | 1.22% | 1.34% | 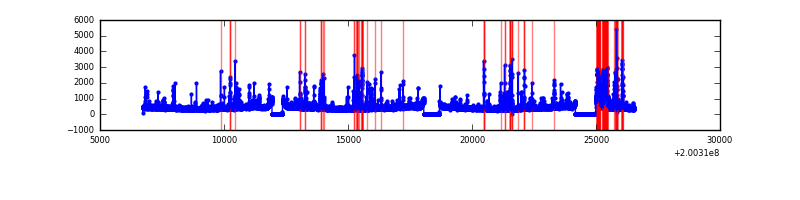 |
Top three noisy pixels from each quadrant. If the there are fewer than three noisy pixels in the level2.evt file, extra rows are filled as -1
| Pixel properties | Quadrant properties | ||||||
|---|---|---|---|---|---|---|---|
| Quadrant | DetID | PixID | Counts | Sigma | Mean | Median | Sigma |
| A | 0 | 118 | 264365 | 620.69 | 2042 | 1995 | 422.7 |
| A | 0 | 50 | 75182 | 173.14 | 2042 | 1995 | 422.7 |
| A | 0 | 226 | 48952 | 111.09 | 2042 | 1995 | 422.7 |
| B | 15 | 204 | 3720744 | 9253.54 | 2061 | 2010 | 401.9 |
| B | 3 | 0 | 139979 | 343.32 | 2061 | 2010 | 401.9 |
| B | 14 | 167 | 110901 | 270.96 | 2061 | 2010 | 401.9 |
| C | 2 | 53 | 1795175 | 3943.56 | 1944 | 1953 | 454.7 |
| C | 7 | 220 | 778758 | 1708.31 | 1944 | 1953 | 454.7 |
| C | 14 | 223 | 696874 | 1528.23 | 1944 | 1953 | 454.7 |
| D | 14 | 34 | 668573 | 1400.74 | 1963 | 1902 | 475.9 |
| D | 13 | 223 | 305871 | 638.67 | 1963 | 1902 | 475.9 |
| D | 5 | 233 | 111959 | 231.24 | 1963 | 1902 | 475.9 |
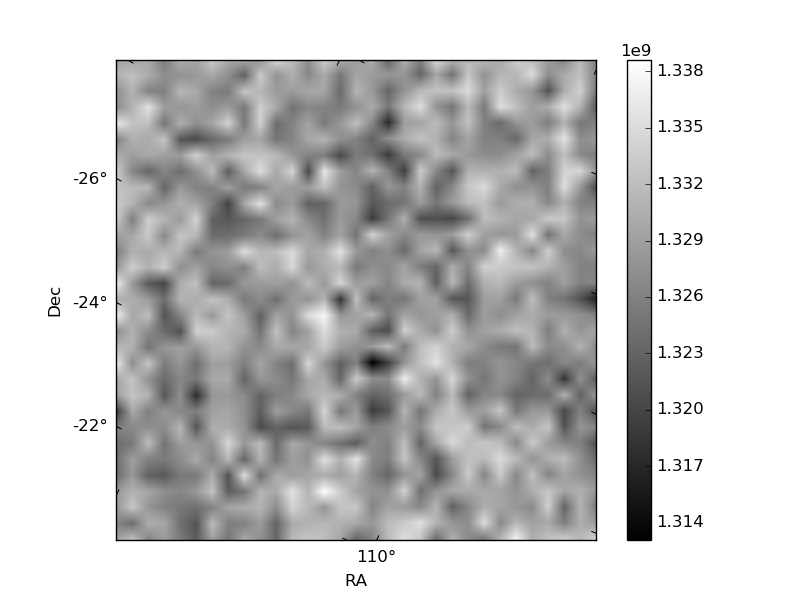
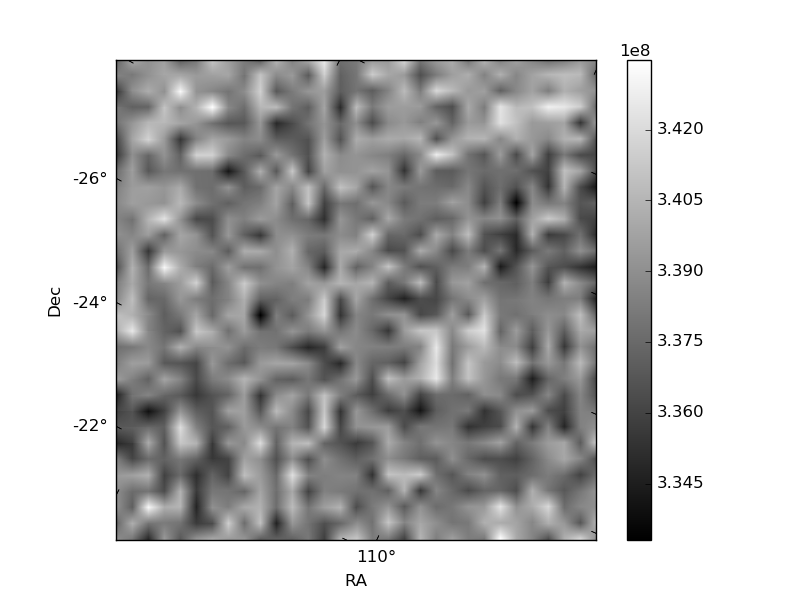
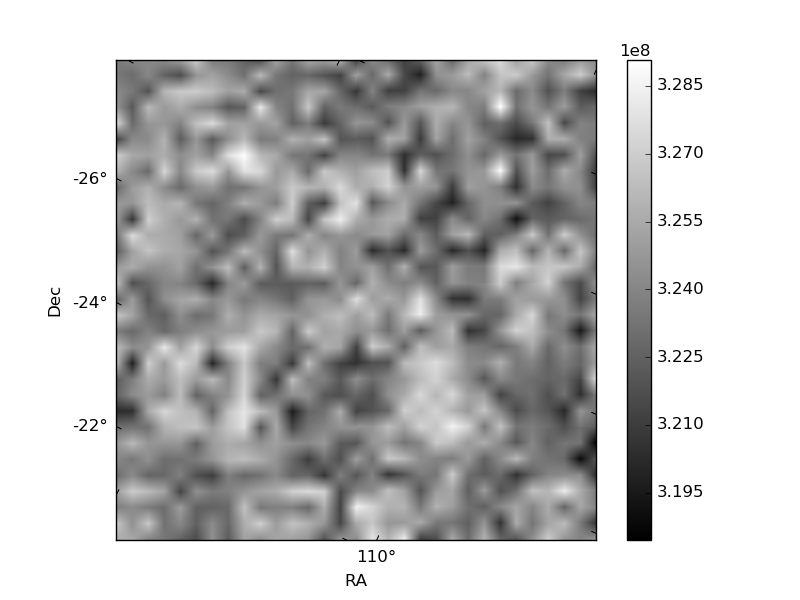
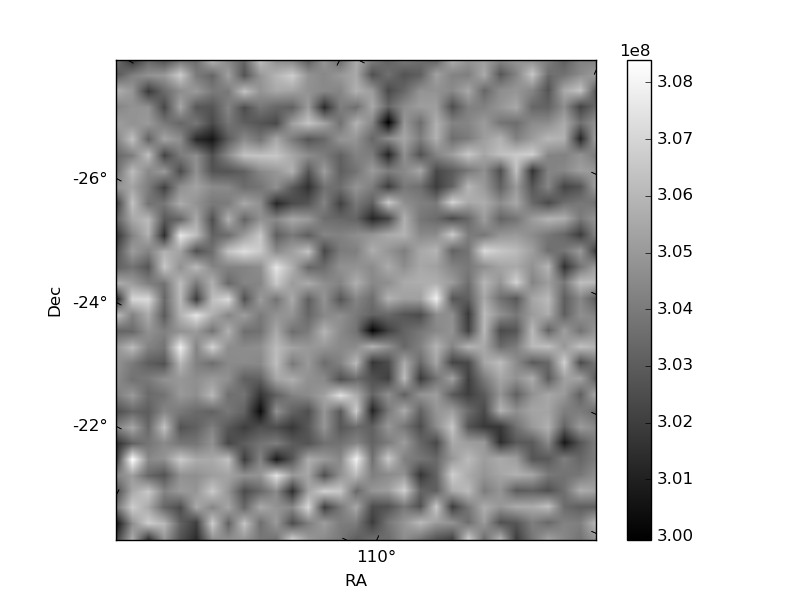
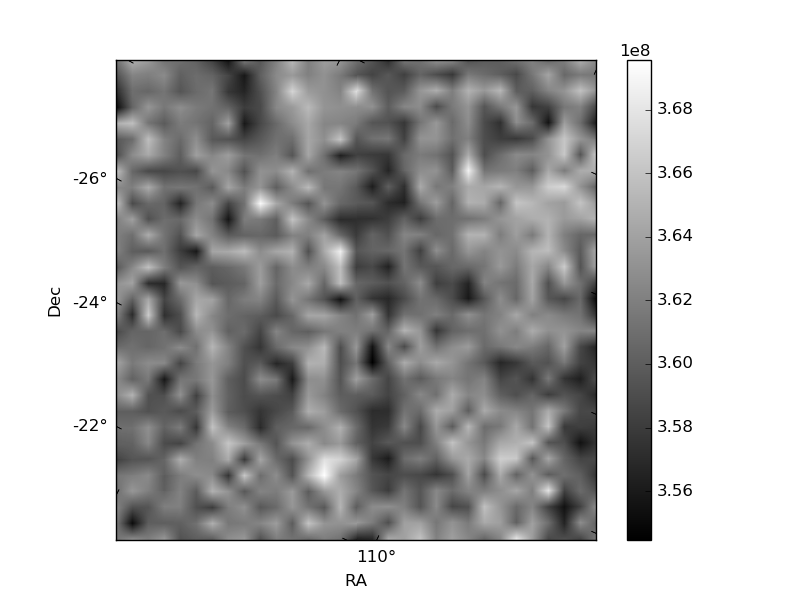
Histogram calculated using DETX and DETY for each event in the final _common_clean file
| Quadrant A | 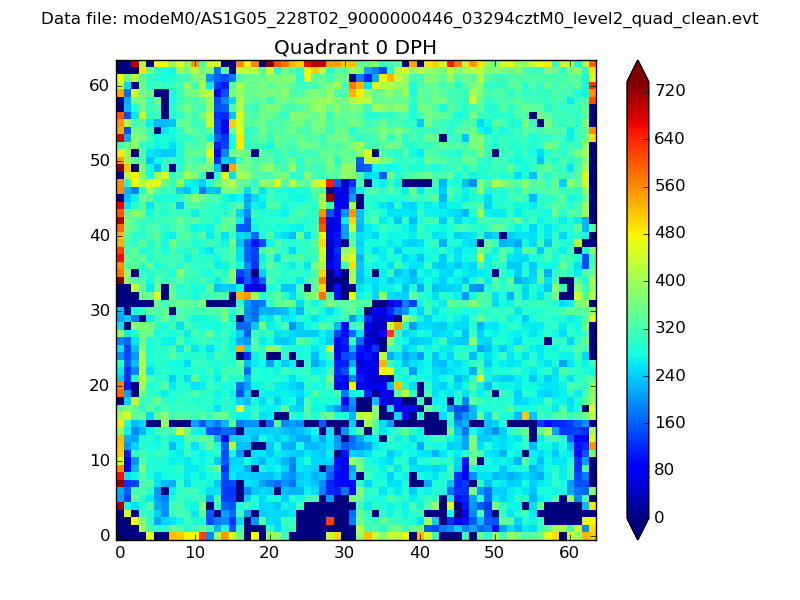 |
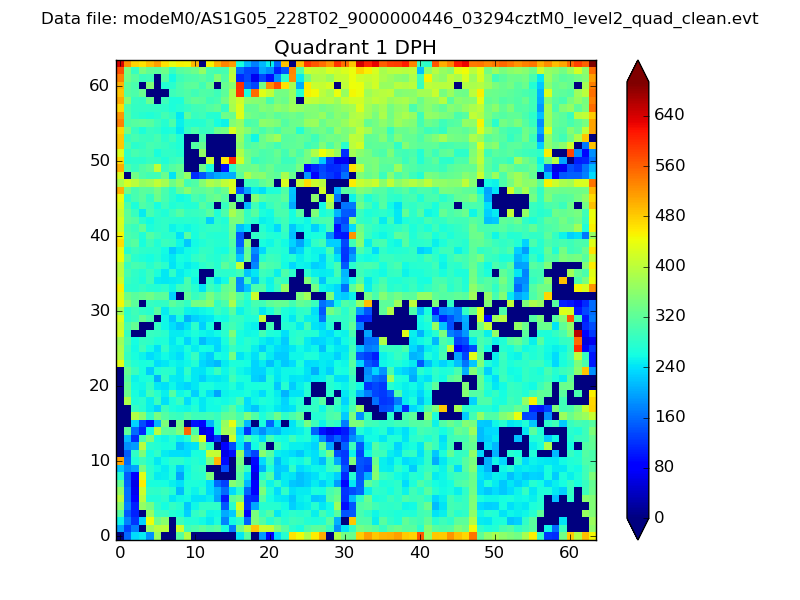 |
Quadrant B |
|---|---|---|---|
| Quadrant D | 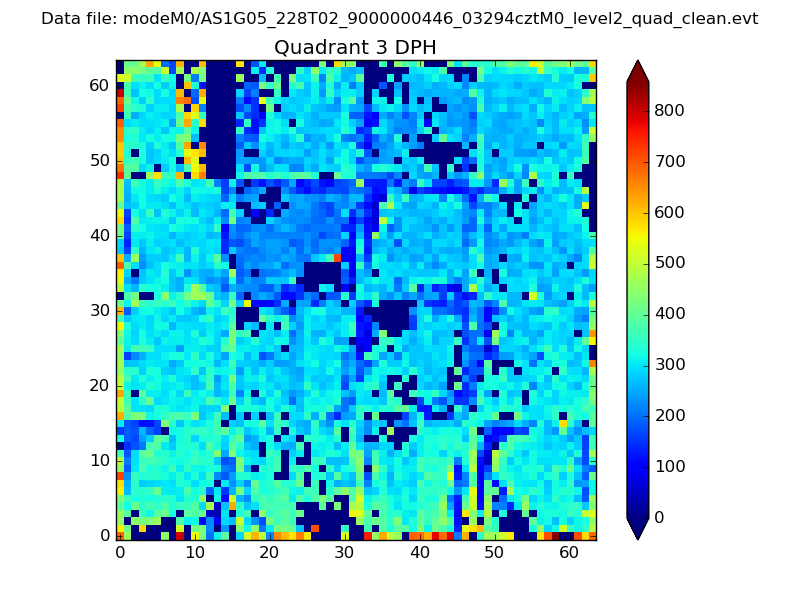 |
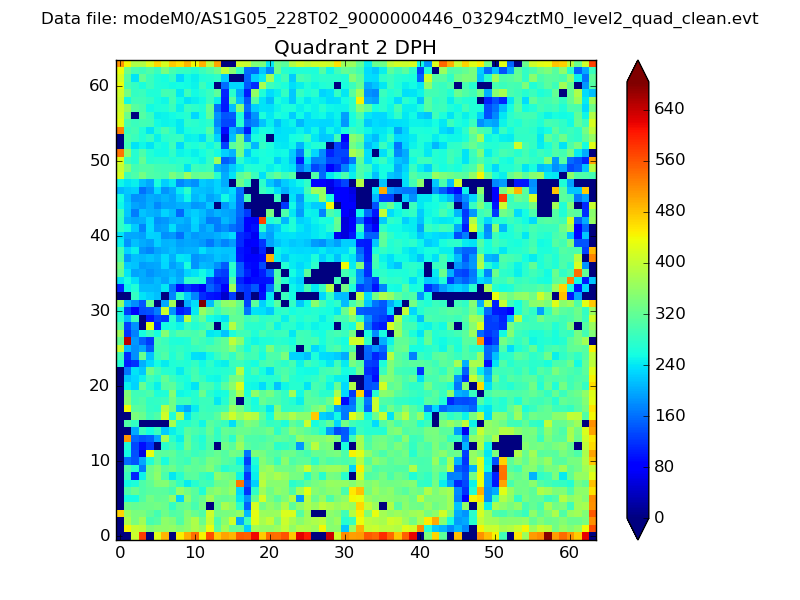 |
Quadrant C |
| Plot type | Count rate plots | Images |
|---|---|---|
| Comparison with Poisson distribution Blue bars denote a histogram of data divided into 1 sec bins. Red curve is a Poisson curve with rate = median count rate of data. |
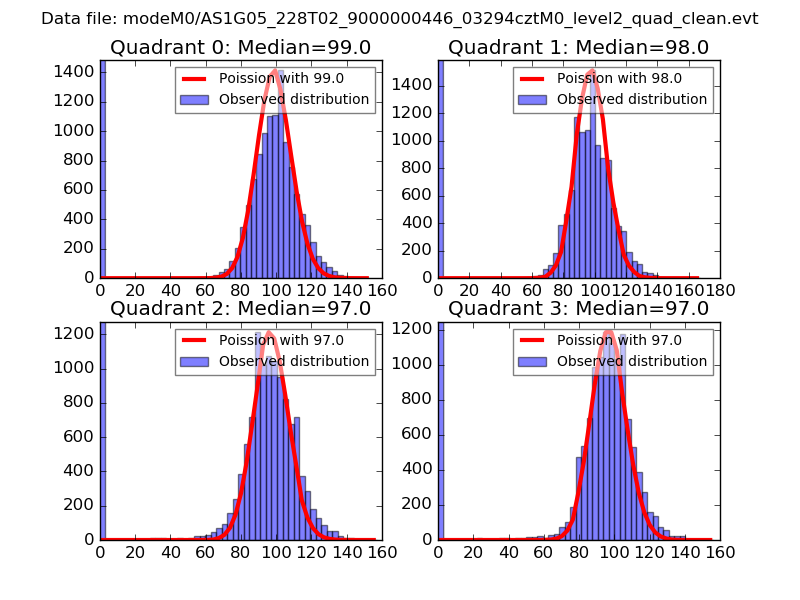 |
 |
| Quadrant-wise count rates Data is divided into 100 sec bins |
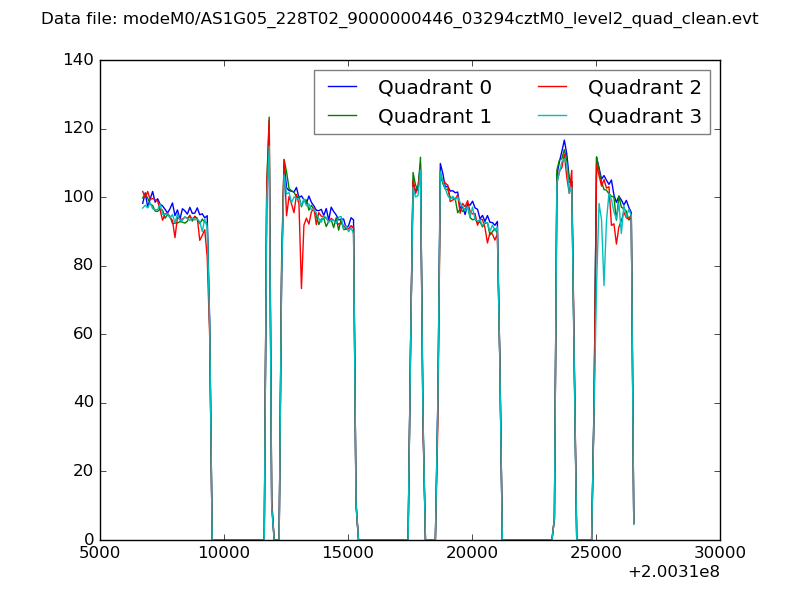 |
|
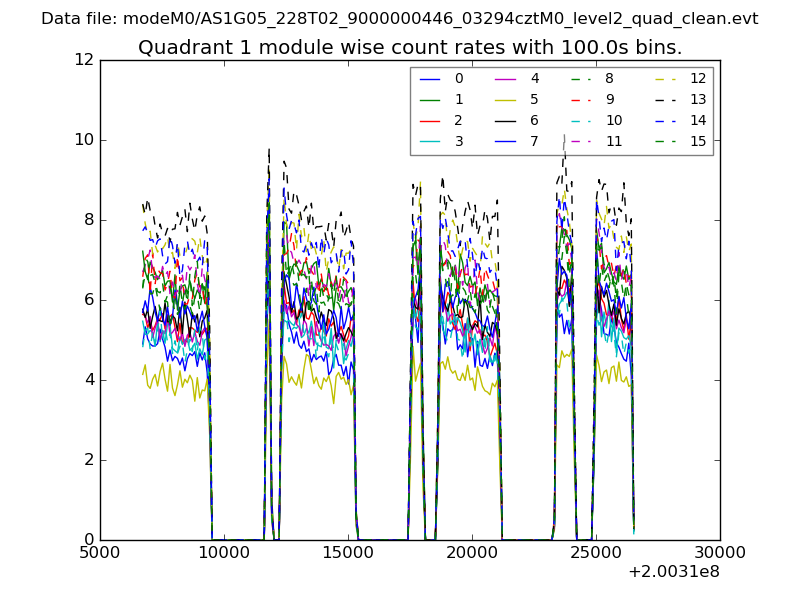
| Module-wise count rates for Quadrant A Data is divided into 100 sec bins |
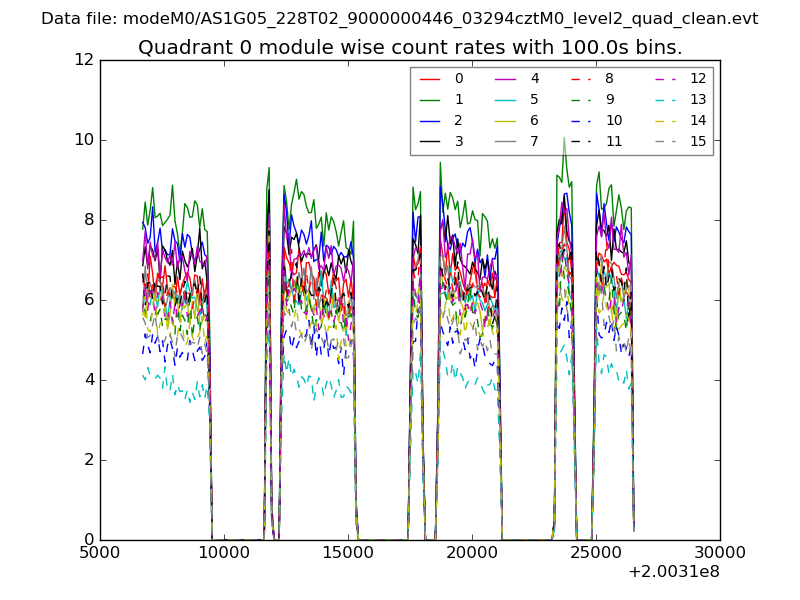 |
 |
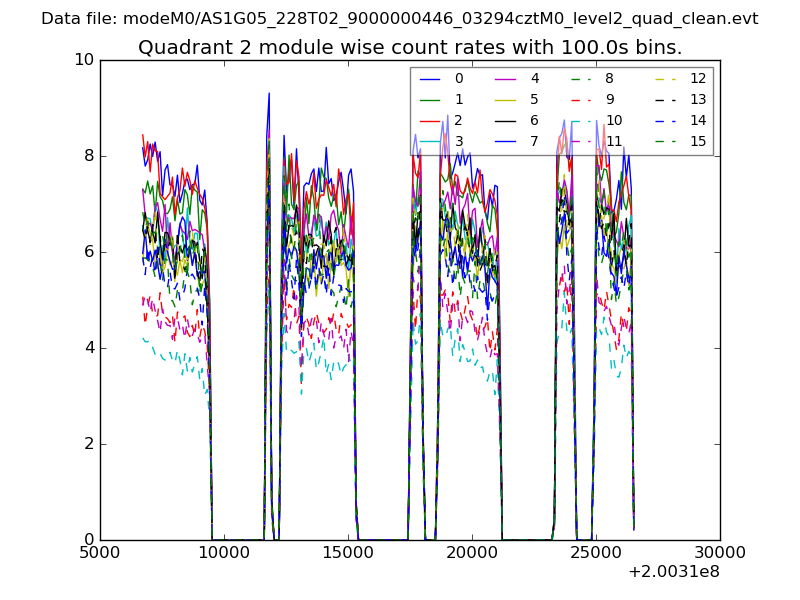
| Module-wise count rates for Quadrant B Data is divided into 100 sec bins |
 |
 |
| Module-wise count rates for Quadrant C Data is divided into 100 sec bins |
 |
 |
| Module-wise count rates for Quadrant D Data is divided into 100 sec bins |
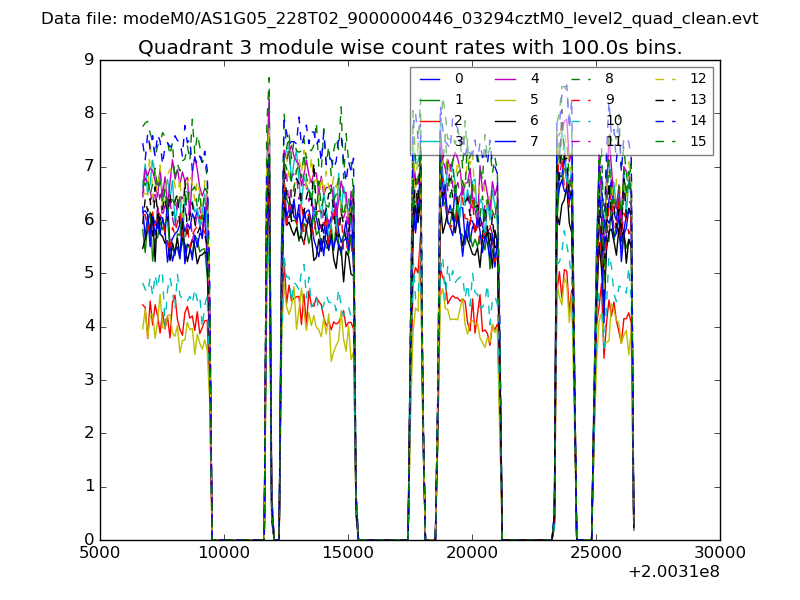 |
 |
| Parameter | Plot |
|---|---|
| CZT HV Monitor | 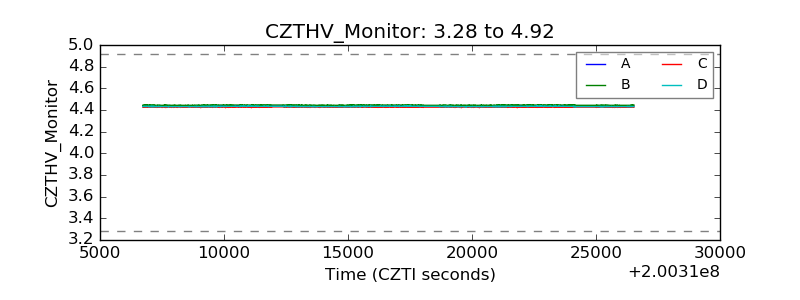 |
| D_VDD | 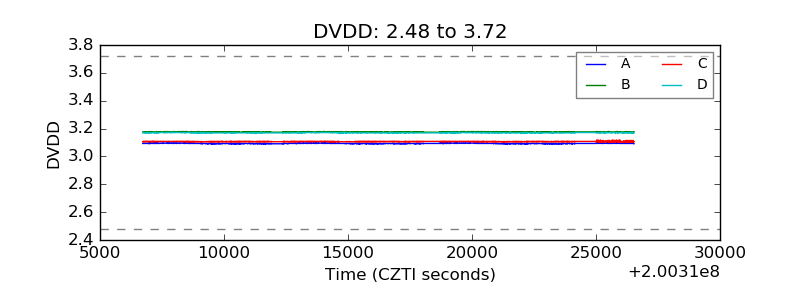 |
| Temperature 1 | 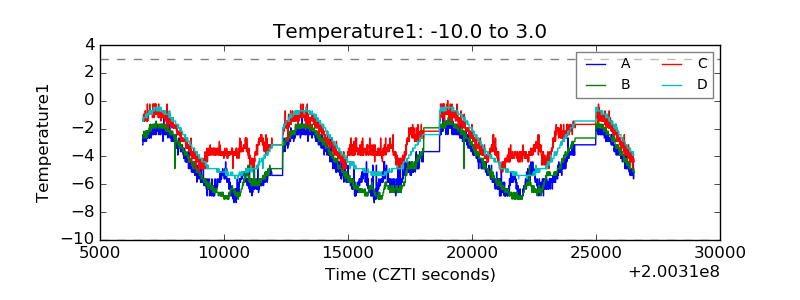 |
| Veto HV Monitor | 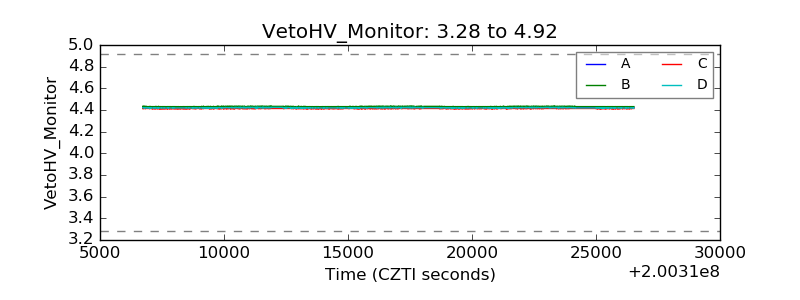 |
| Veto LLD | 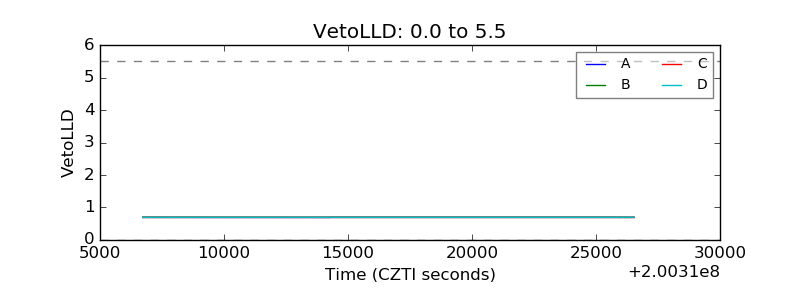 |
| Alpha Counter | 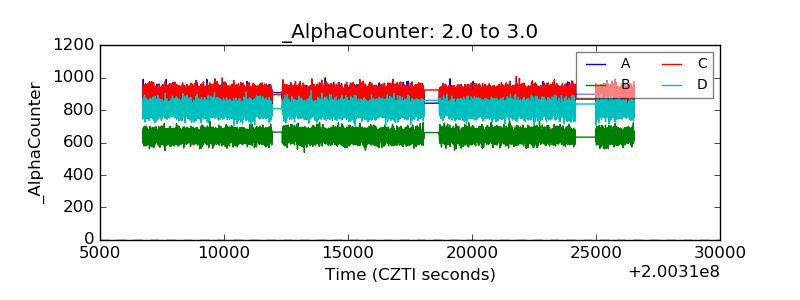 |
| _CPM_Rate | 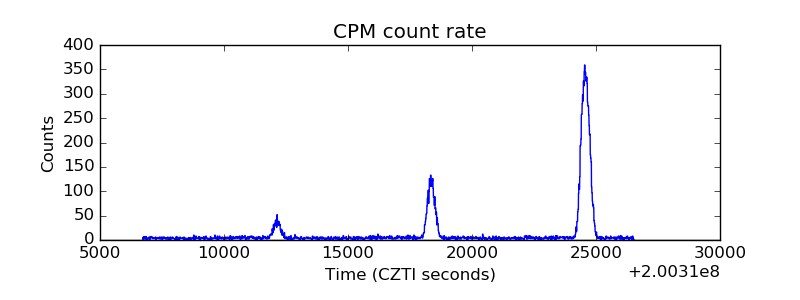 |
| CZT Counter | 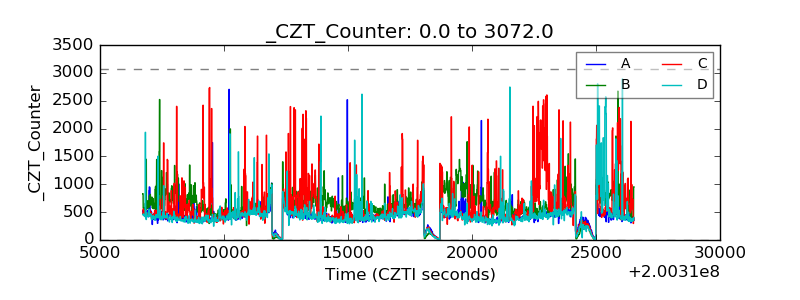 |
| +2.5 Volts monitor |  |
| +5 Volts monitor |  |
| _ROLL_ROT | 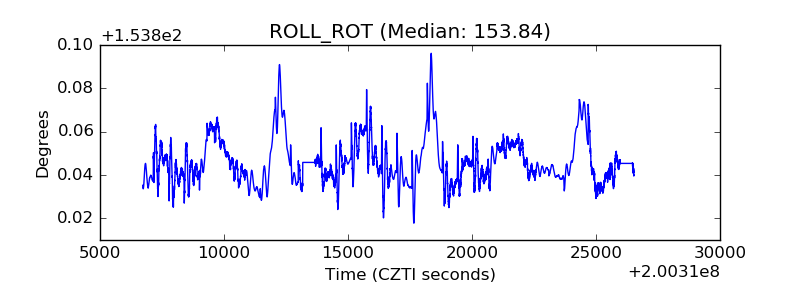 |
| _Roll_DEC | 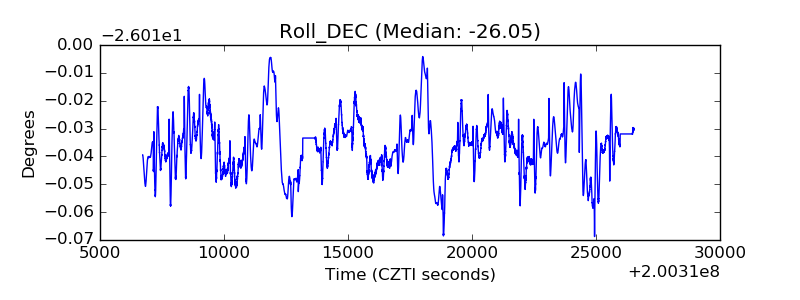 |
| _Roll_RA | 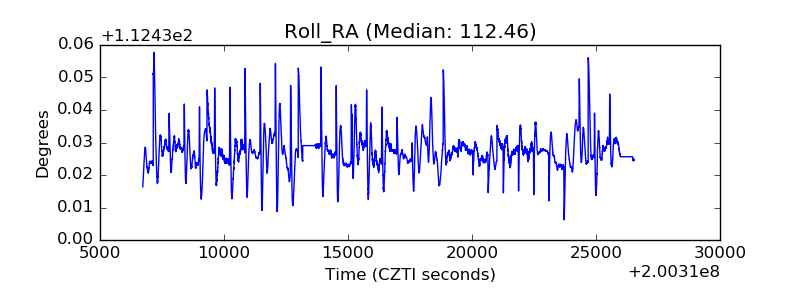 |
| Veto Counter | 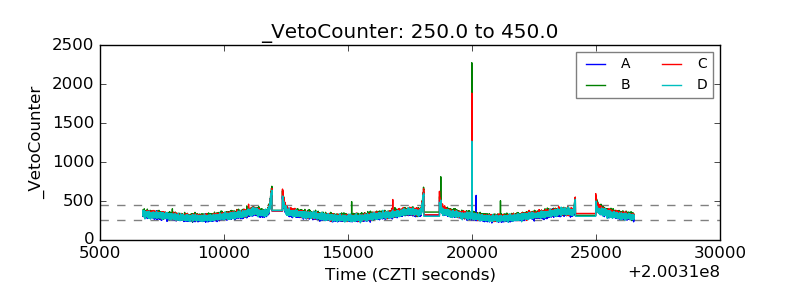 |