| Param | Original file | Final file |
|---|---|---|
| Filename | modeM0/AS1G05_228T02_9000000446_03295cztM0_level2.evt | modeM0/AS1G05_228T02_9000000446_03295cztM0_level2_quad_clean.evt |
| Size (bytes) | 165,792,960 | 34,585,920 |
| Size | 158.1 MB | 33.0 MB |
| Events in quadrant A | 993,534 | 227,185 |
| Events in quadrant B | 1,476,909 | 225,200 |
| Events in quadrant C | 1,395,081 | 221,819 |
| Events in quadrant D | 1,009,765 | 219,728 |
| Mode SS | |||
|---|---|---|---|
| Quadrant | BADHDUFLAG | Total packets | Discarded packets |
| A | 0 | 46 | 0 |
| B | 0 | 46 | 0 |
| C | 0 | 46 | 0 |
| D | 0 | 46 | 0 |
| Mode M0 | |||
|---|---|---|---|
| Quadrant | BADHDUFLAG | Total packets | Discarded packets |
| A | 0 | 4328 | 2 |
| B | 0 | 5861 | 1 |
| C | 0 | 5620 | 1 |
| D | 0 | 4507 | 1 |
| Mode M9 | |||
|---|---|---|---|
| Quadrant | BADHDUFLAG | Total packets | Discarded packets |
| A | 0 | 9 | 0 |
| B | 0 | 9 | 0 |
| C | 0 | 9 | 0 |
| D | 0 | 9 | 0 |
| Quadrant | Total seconds | Saturated seconds | Saturation percentage |
|---|---|---|---|
| A | 2105 | 11 | 0.522565% |
| B | 2105 | 30 | 1.425178% |
| C | 2105 | 51 | 2.422803% |
| D | 2105 | 19 | 0.902613% |
Noise dominated data is calculated using 1-second bins in cleaned event files. If a bin has >2000 counts, and if more than 50% of those come from <1% of pixels, then it is considered to be noise-dominated and hence unusable.
| Quadrant | # 1 sec bins | Bins with >0 counts | Bins with >2000 counts | High rate bins dominated by noise | Noise dominated (total time) | Noise dominated (detector-on time) | Marked lightcurve |
|---|---|---|---|---|---|---|---|
| A | 3081 | 2107 | 0 | 0 | 0.00% | 0.00% | 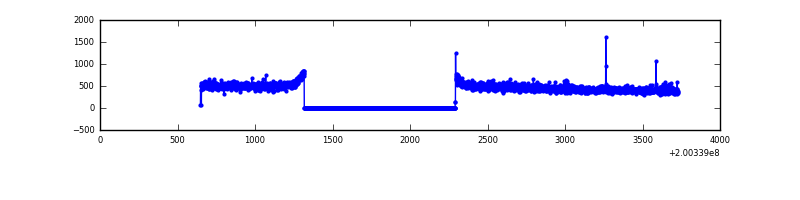 |
| B | 3081 | 2107 | 2 | 2 | 0.06% | 0.09% | 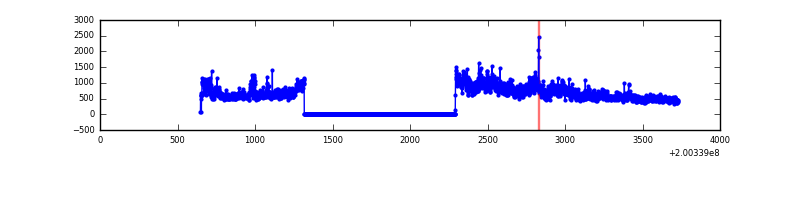 |
| C | 3081 | 2107 | 37 | 37 | 1.20% | 1.76% | 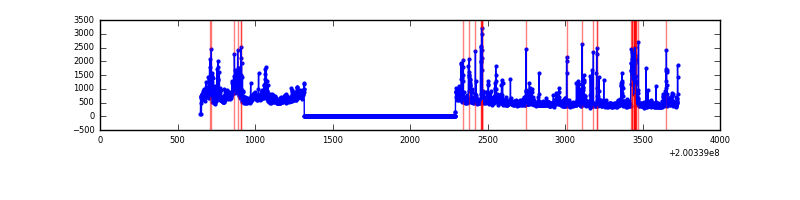 |
| D | 3081 | 2107 | 8 | 8 | 0.26% | 0.38% | 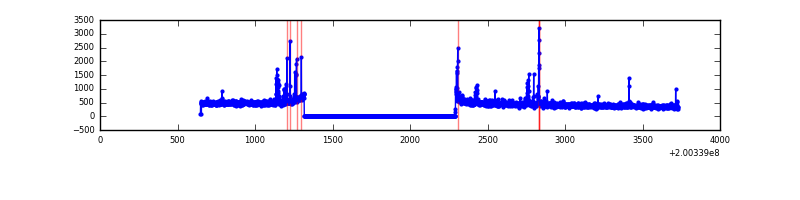 |
Top three noisy pixels from each quadrant. If the there are fewer than three noisy pixels in the level2.evt file, extra rows are filled as -1
| Pixel properties | Quadrant properties | ||||||
|---|---|---|---|---|---|---|---|
| Quadrant | DetID | PixID | Counts | Sigma | Mean | Median | Sigma |
| A | 0 | 118 | 3290 | 55.83 | 256 | 250 | 54.5 |
| A | 0 | 226 | 2968 | 49.91 | 256 | 250 | 54.5 |
| A | 12 | 194 | 2833 | 47.43 | 256 | 250 | 54.5 |
| B | 15 | 204 | 420145 | 8003.07 | 259 | 253 | 52.5 |
| B | 4 | 81 | 27328 | 516.04 | 259 | 253 | 52.5 |
| B | 14 | 167 | 12055 | 224.94 | 259 | 253 | 52.5 |
| C | 7 | 220 | 147659 | 2496.53 | 243 | 244 | 59.0 |
| C | 14 | 223 | 89152 | 1505.69 | 243 | 244 | 59.0 |
| C | 1 | 192 | 79550 | 1343.08 | 243 | 244 | 59.0 |
| D | 13 | 223 | 38541 | 616.04 | 246 | 237 | 62.2 |
| D | 1 | 193 | 32258 | 514.99 | 246 | 237 | 62.2 |
| D | 10 | 34 | 4512 | 68.75 | 246 | 237 | 62.2 |
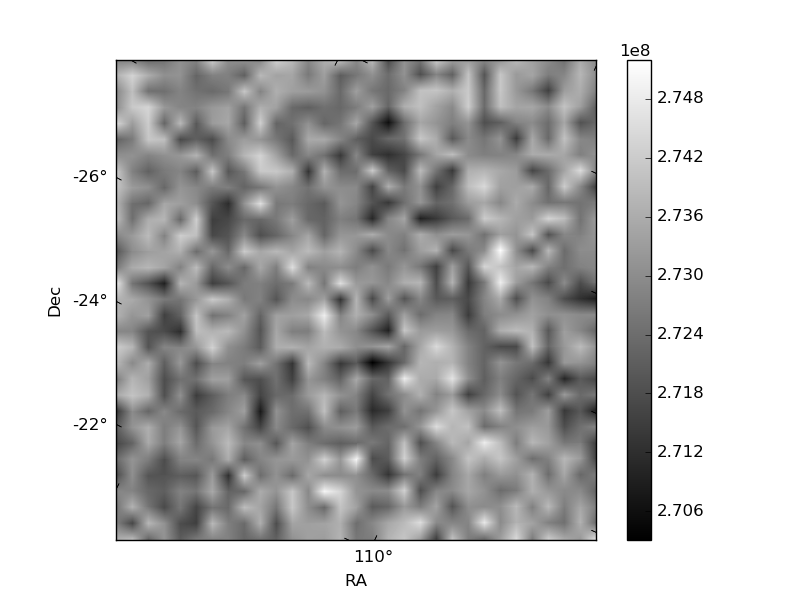
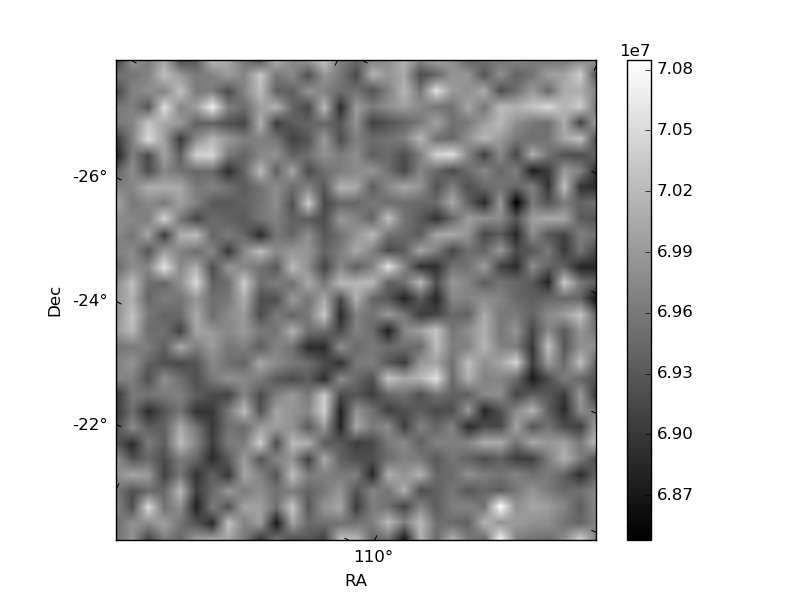
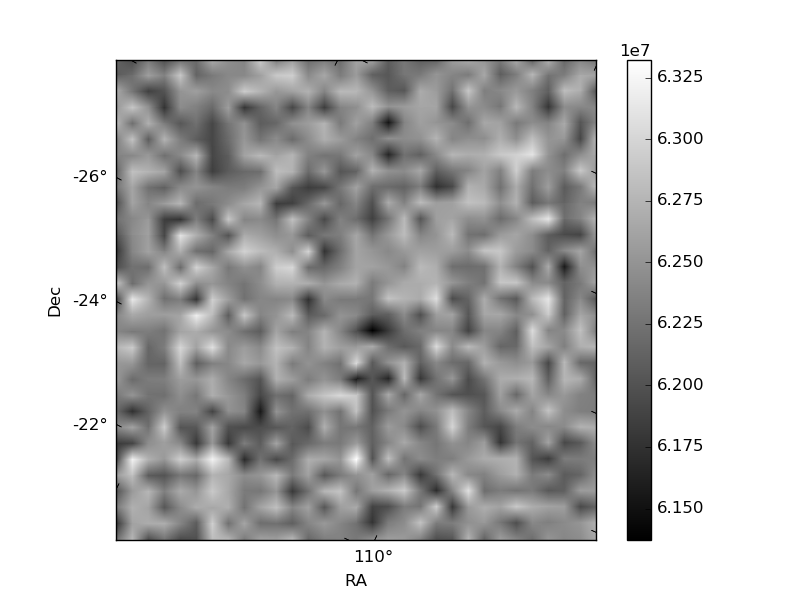
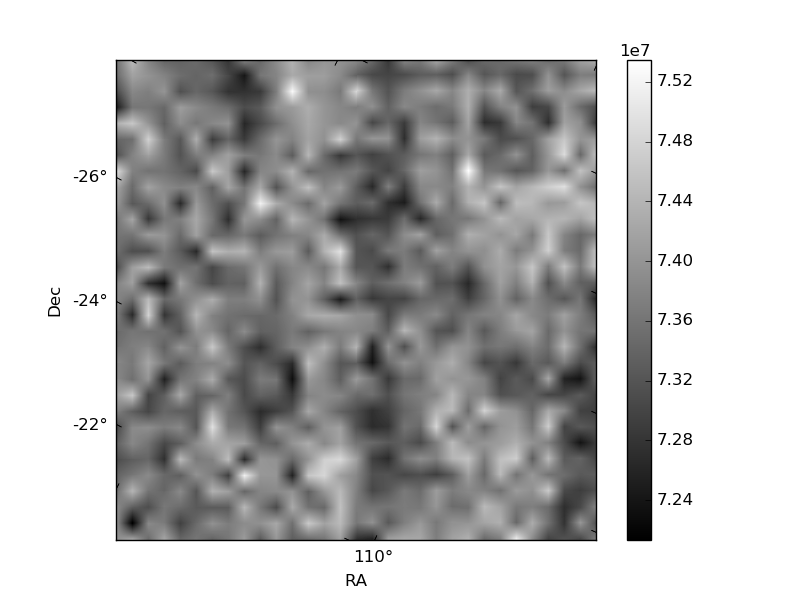
Histogram calculated using DETX and DETY for each event in the final _common_clean file
| Quadrant A | 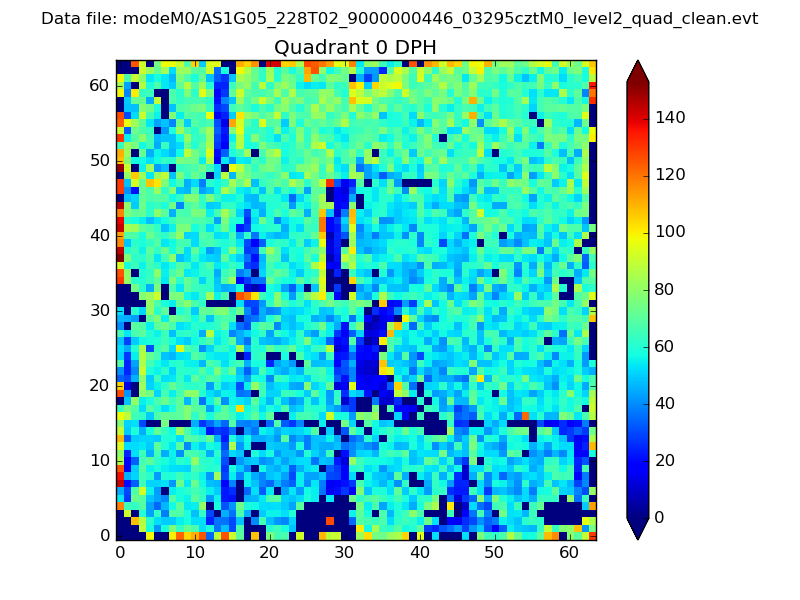 |
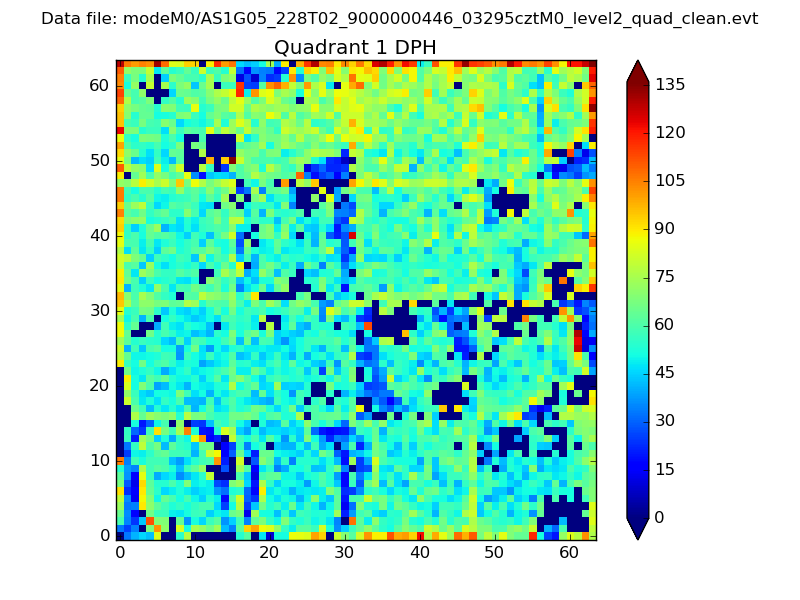 |
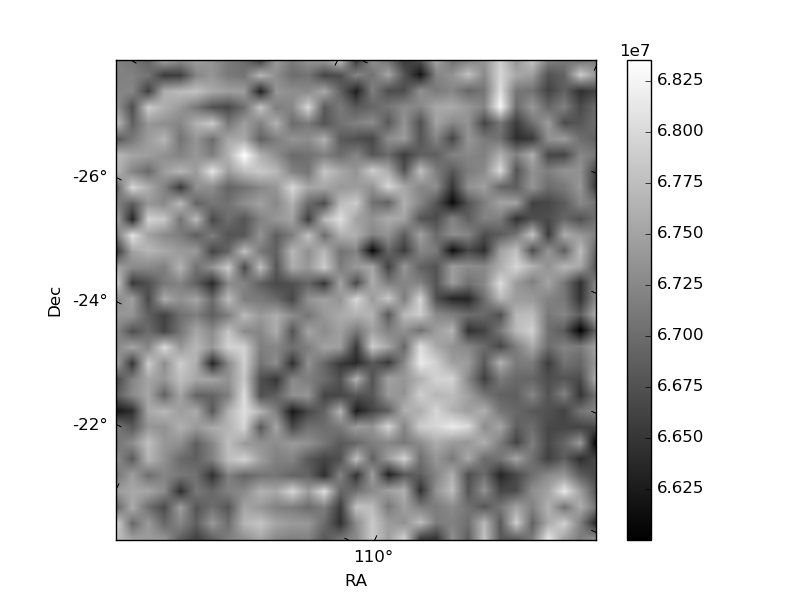
Quadrant B |
|---|---|---|---|
| Quadrant D | 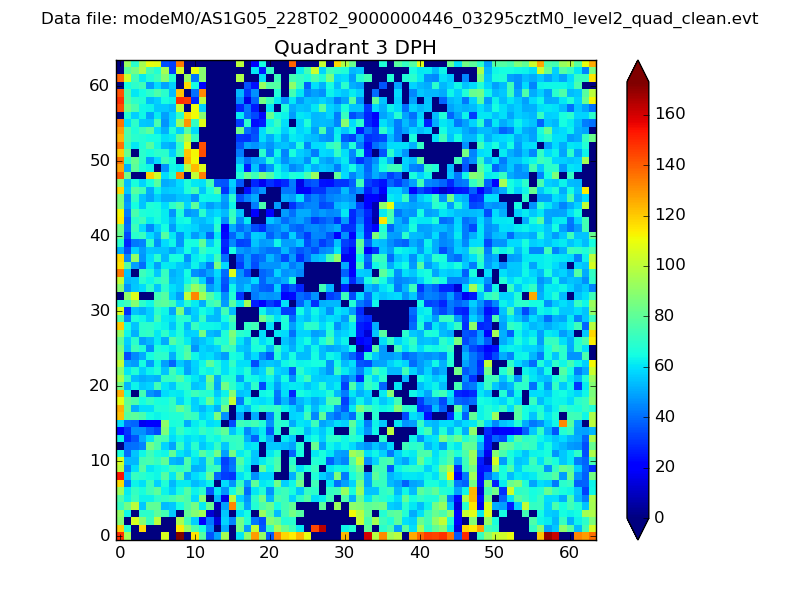 |
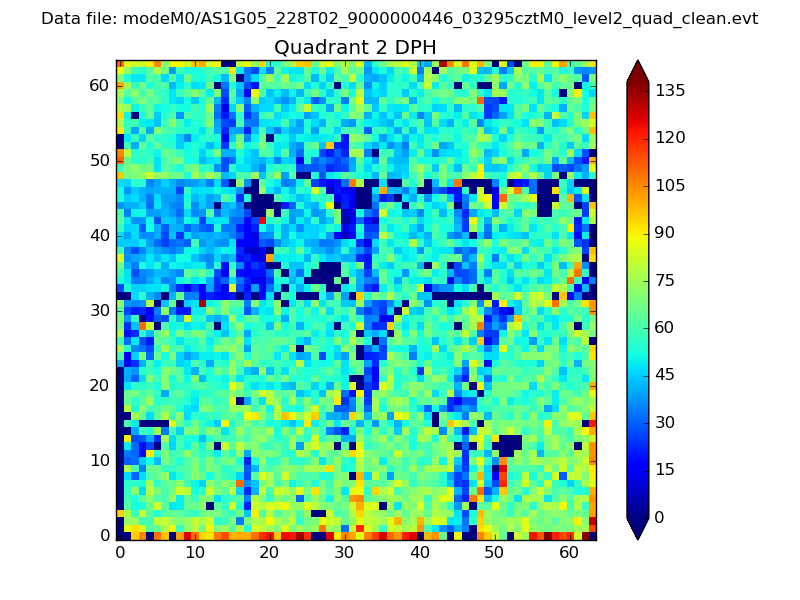 |
Quadrant C |
| Plot type | Count rate plots | Images |
|---|---|---|
| Comparison with Poisson distribution Blue bars denote a histogram of data divided into 1 sec bins. Red curve is a Poisson curve with rate = median count rate of data. |
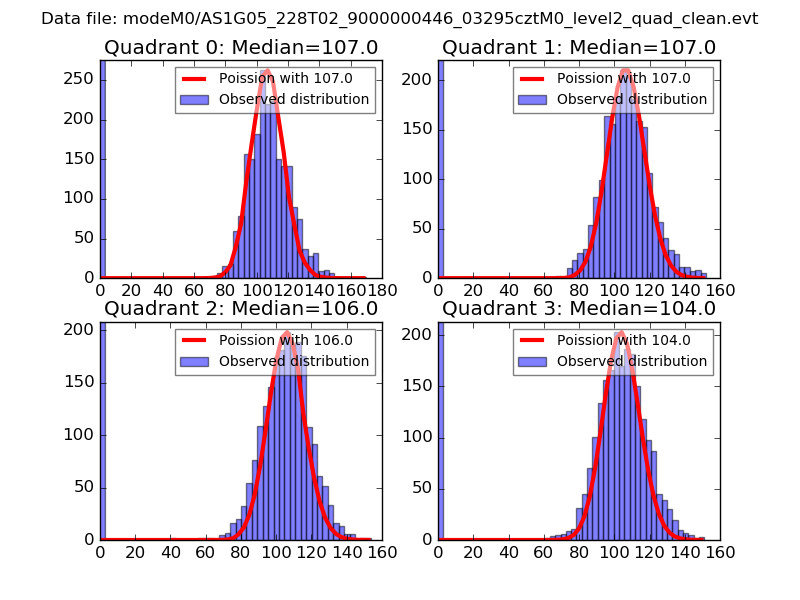 |
 |
| Quadrant-wise count rates Data is divided into 100 sec bins |
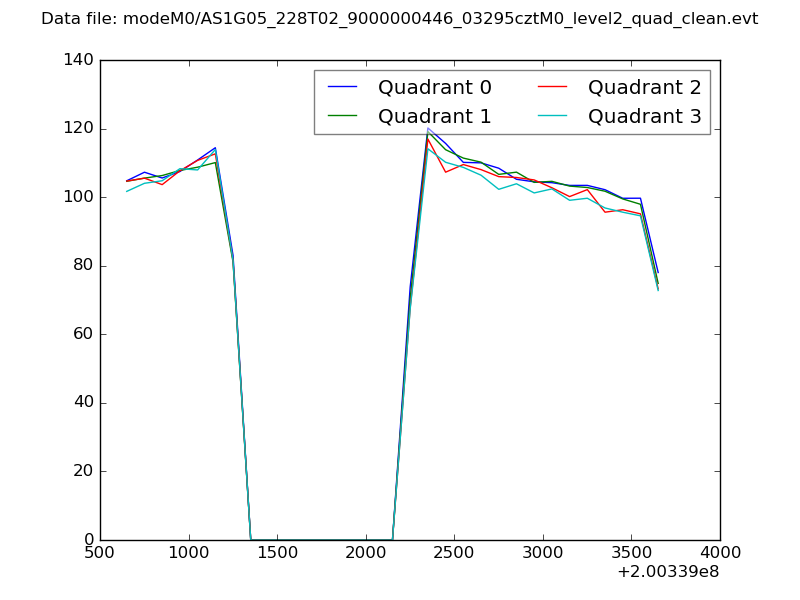 |
|
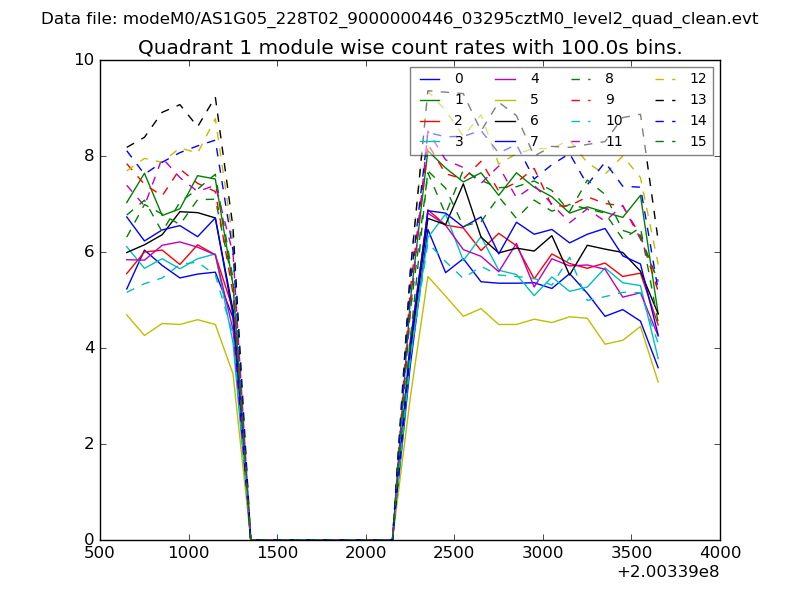
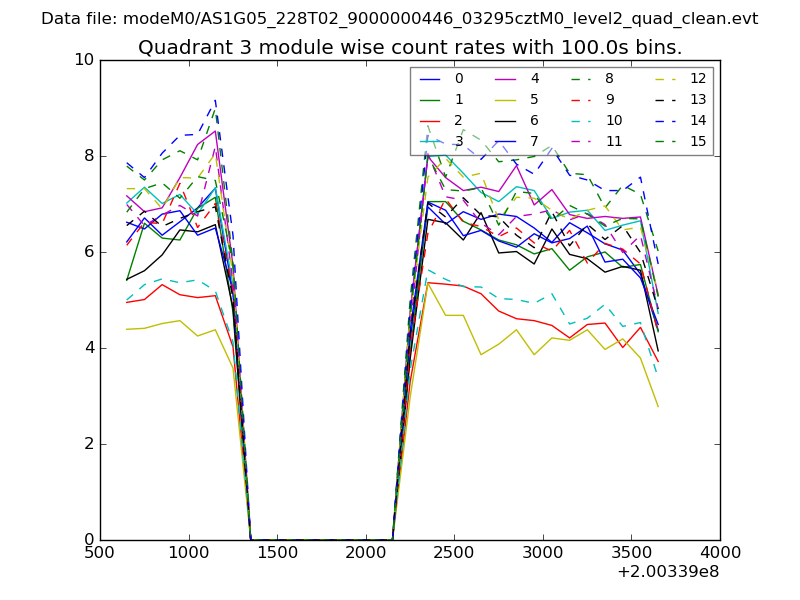
| Module-wise count rates for Quadrant A Data is divided into 100 sec bins |
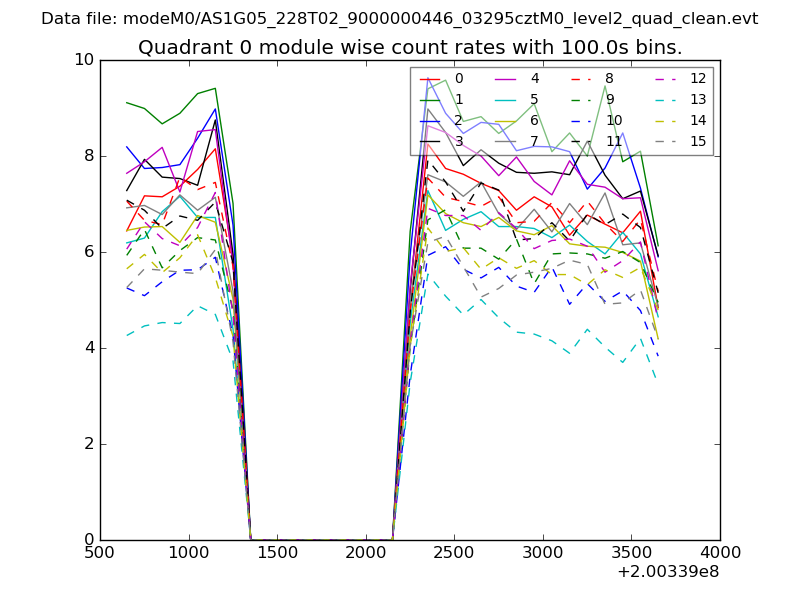 |
 |
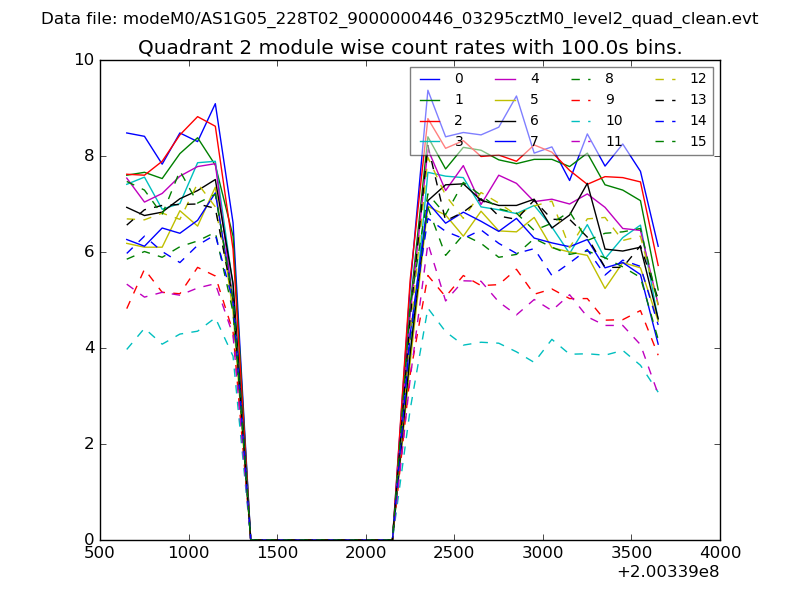
| Module-wise count rates for Quadrant B Data is divided into 100 sec bins |
 |
 |
| Module-wise count rates for Quadrant C Data is divided into 100 sec bins |
 |
 |
| Module-wise count rates for Quadrant D Data is divided into 100 sec bins |
 |
 |
| Parameter | Plot |
|---|---|
| CZT HV Monitor | 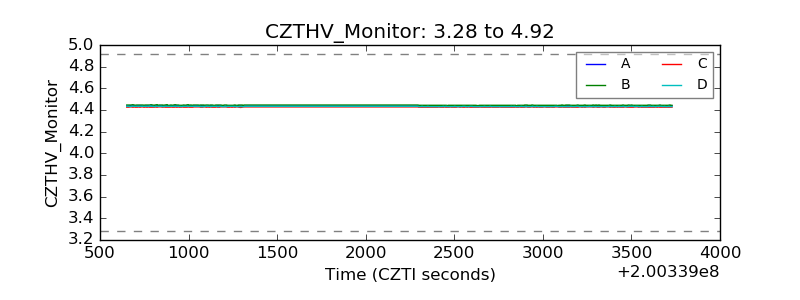 |
| D_VDD |  |
| Temperature 1 | 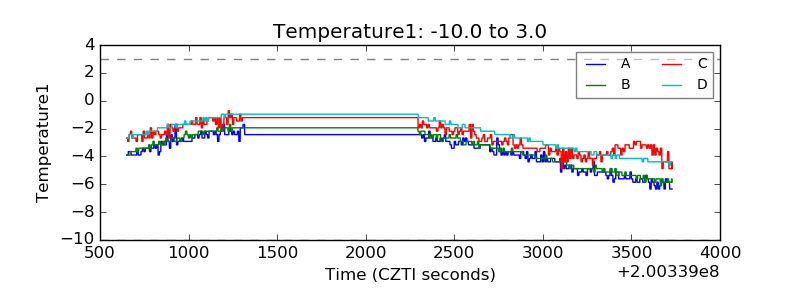 |
| Veto HV Monitor | 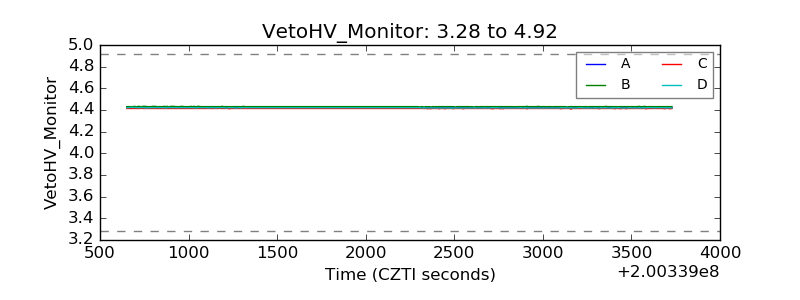 |
| Veto LLD | 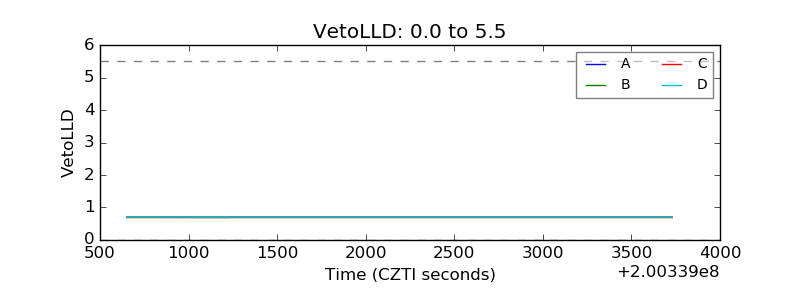 |
| Alpha Counter | 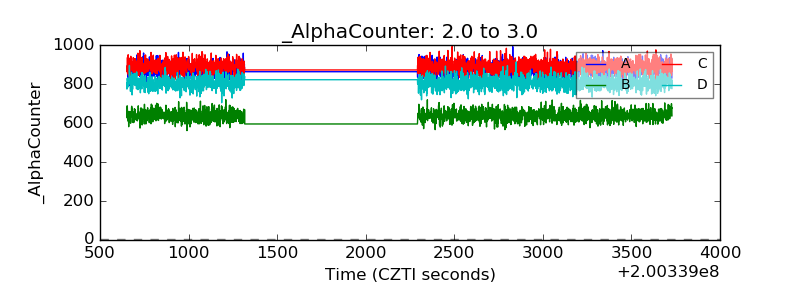 |
| _CPM_Rate | 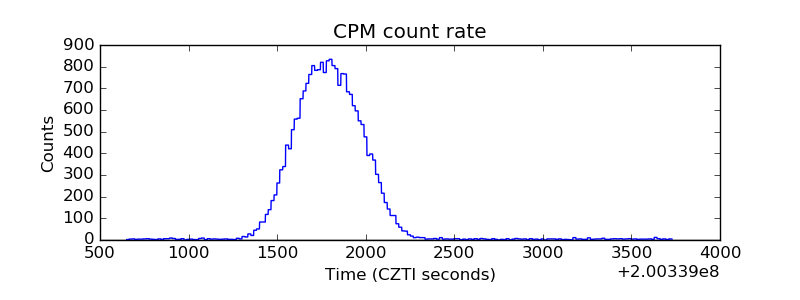 |
| CZT Counter | 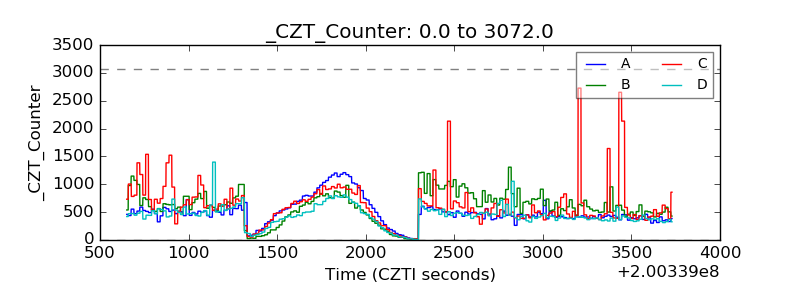 |
| +2.5 Volts monitor |  |
| +5 Volts monitor |  |
| _ROLL_ROT | 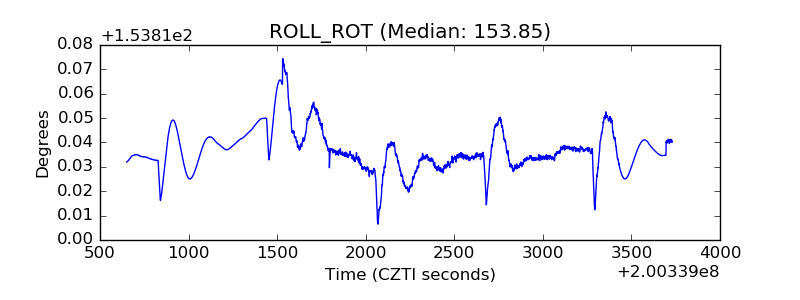 |
| _Roll_DEC | 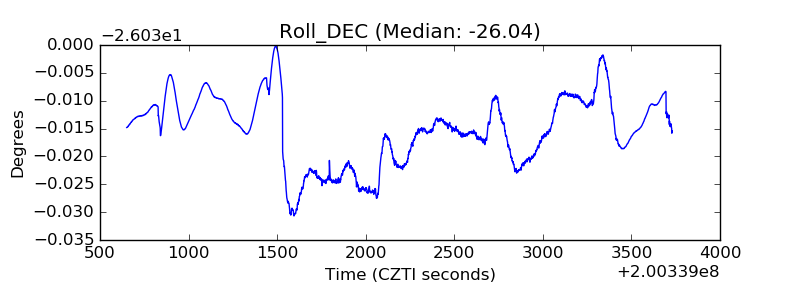 |
| _Roll_RA | 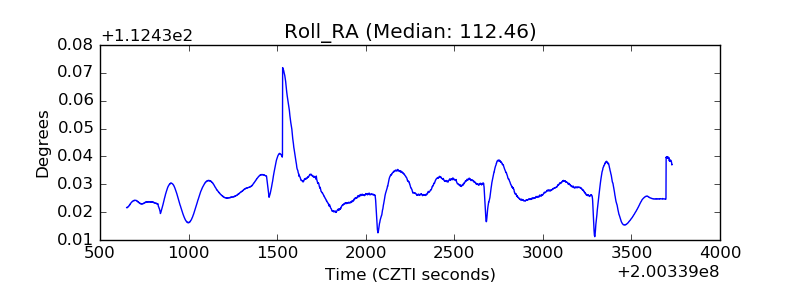 |
| Veto Counter | 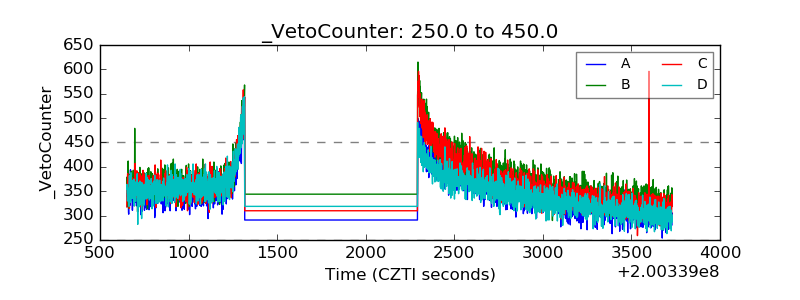 |