| Param | Original file | Final file |
|---|---|---|
| Filename | modeM0/AS1G05_228T02_9000000446_03297cztM0_level2.evt | modeM0/AS1G05_228T02_9000000446_03297cztM0_level2_quad_clean.evt |
| Size (bytes) | 468,529,920 | 72,809,280 |
| Size | 446.8 MB | 69.4 MB |
| Events in quadrant A | 2,944,123 | 443,367 |
| Events in quadrant B | 3,763,532 | 444,559 |
| Events in quadrant C | 3,982,267 | 433,665 |
| Events in quadrant D | 3,055,889 | 427,384 |
| Mode SS | |||
|---|---|---|---|
| Quadrant | BADHDUFLAG | Total packets | Discarded packets |
| A | 0 | 134 | 0 |
| B | 0 | 134 | 0 |
| C | 0 | 134 | 0 |
| D | 0 | 134 | 0 |
| Mode M0 | |||
|---|---|---|---|
| Quadrant | BADHDUFLAG | Total packets | Discarded packets |
| A | 0 | 13362 | 3 |
| B | 0 | 15323 | 2 |
| C | 0 | 16329 | 2 |
| D | 0 | 14051 | 2 |
| Mode M9 | |||
|---|---|---|---|
| Quadrant | BADHDUFLAG | Total packets | Discarded packets |
| A | 0 | 11 | 0 |
| B | 0 | 11 | 0 |
| C | 0 | 11 | 0 |
| D | 0 | 12 | 0 |
| Quadrant | Total seconds | Saturated seconds | Saturation percentage |
|---|---|---|---|
| A | 6527 | 17 | 0.260457% |
| B | 6527 | 40 | 0.612839% |
| C | 6527 | 152 | 2.328788% |
| D | 6527 | 57 | 0.873296% |
Noise dominated data is calculated using 1-second bins in cleaned event files. If a bin has >2000 counts, and if more than 50% of those come from <1% of pixels, then it is considered to be noise-dominated and hence unusable.
| Quadrant | # 1 sec bins | Bins with >0 counts | Bins with >2000 counts | High rate bins dominated by noise | Noise dominated (total time) | Noise dominated (detector-on time) | Marked lightcurve |
|---|---|---|---|---|---|---|---|
| A | 7632 | 6528 | 4 | 4 | 0.05% | 0.06% | 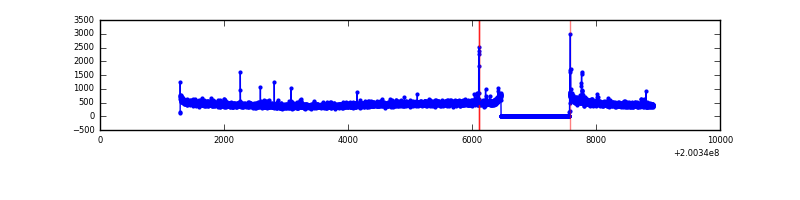 |
| B | 7632 | 6528 | 10 | 10 | 0.13% | 0.15% | 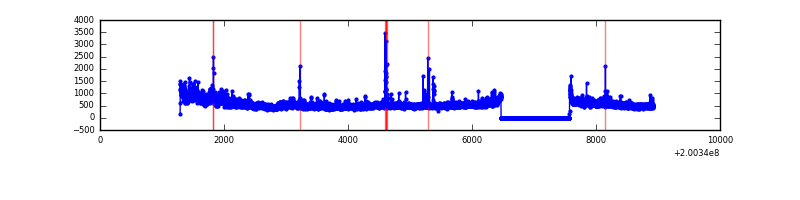 |
| C | 7632 | 6528 | 136 | 136 | 1.78% | 2.08% | 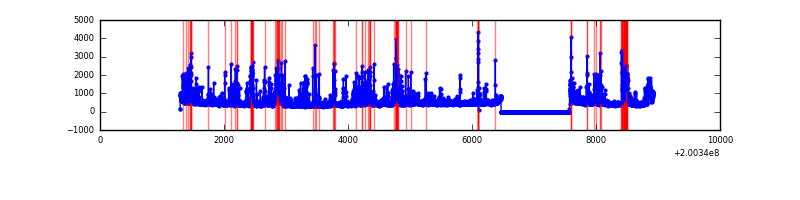 |
| D | 7632 | 6528 | 55 | 55 | 0.72% | 0.84% | 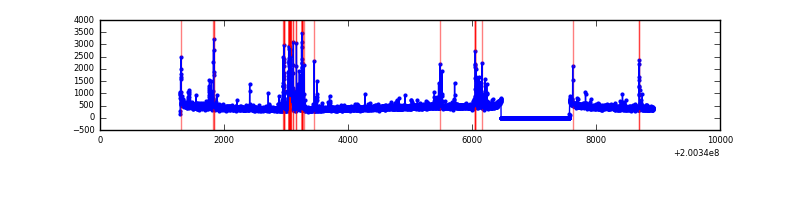 |
Top three noisy pixels from each quadrant. If the there are fewer than three noisy pixels in the level2.evt file, extra rows are filled as -1
| Pixel properties | Quadrant properties | ||||||
|---|---|---|---|---|---|---|---|
| Quadrant | DetID | PixID | Counts | Sigma | Mean | Median | Sigma |
| A | 0 | 118 | 32241 | 204.43 | 749 | 731 | 154.1 |
| A | 0 | 50 | 20744 | 129.84 | 749 | 731 | 154.1 |
| A | 0 | 226 | 10688 | 64.6 | 749 | 731 | 154.1 |
| B | 15 | 204 | 675917 | 4575.67 | 762 | 745 | 147.6 |
| B | 2 | 249 | 65471 | 438.65 | 762 | 745 | 147.6 |
| B | 4 | 81 | 41405 | 275.55 | 762 | 745 | 147.6 |
| C | 1 | 192 | 467152 | 2796.17 | 714 | 719 | 166.8 |
| C | 7 | 220 | 280740 | 1678.67 | 714 | 719 | 166.8 |
| C | 14 | 223 | 238121 | 1423.18 | 714 | 719 | 166.8 |
| D | 13 | 223 | 220396 | 1267.27 | 713 | 691 | 173.4 |
| D | 9 | 82 | 43541 | 247.16 | 713 | 691 | 173.4 |
| D | 1 | 193 | 33089 | 186.87 | 713 | 691 | 173.4 |
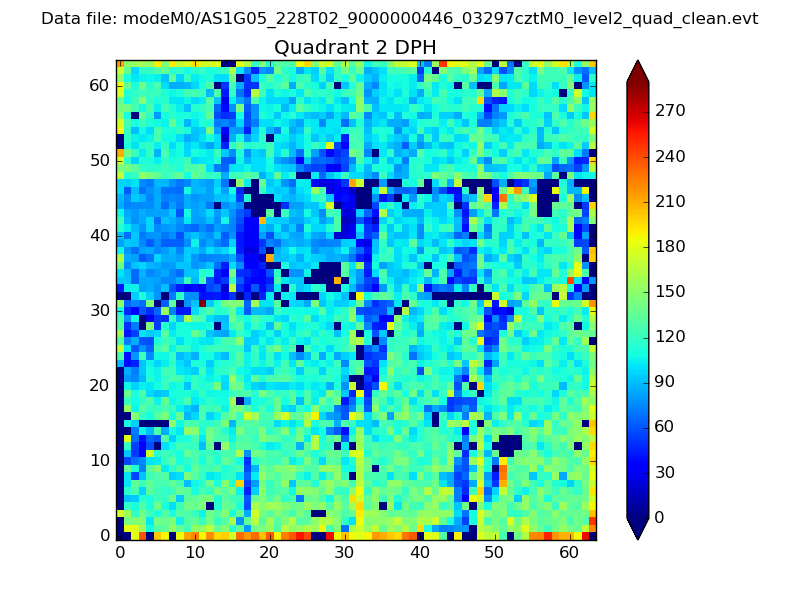
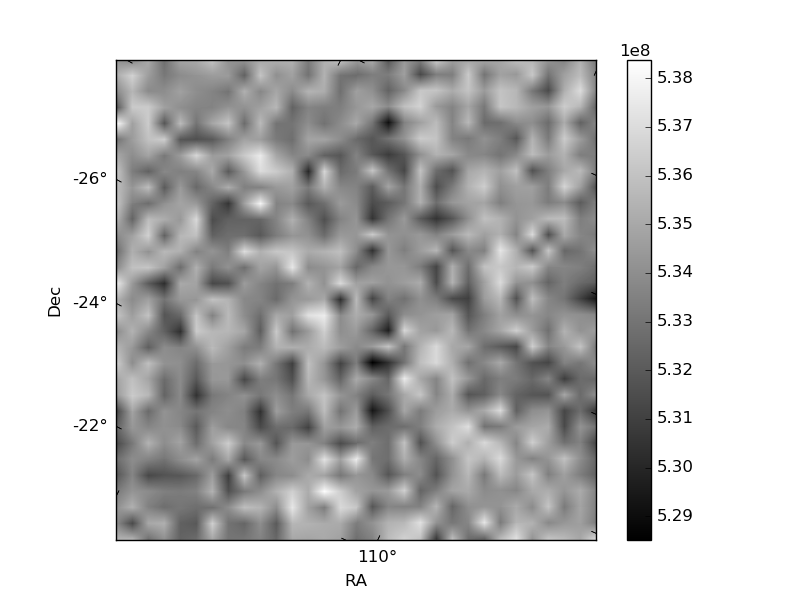
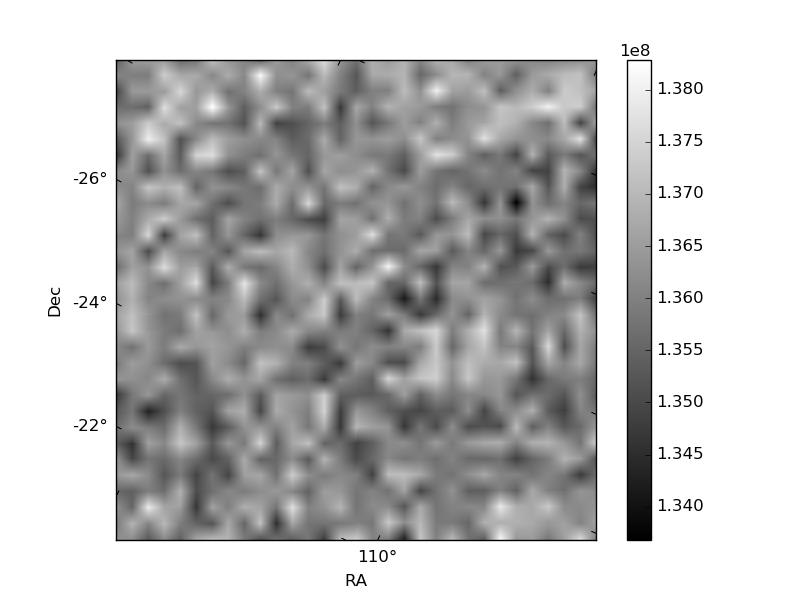
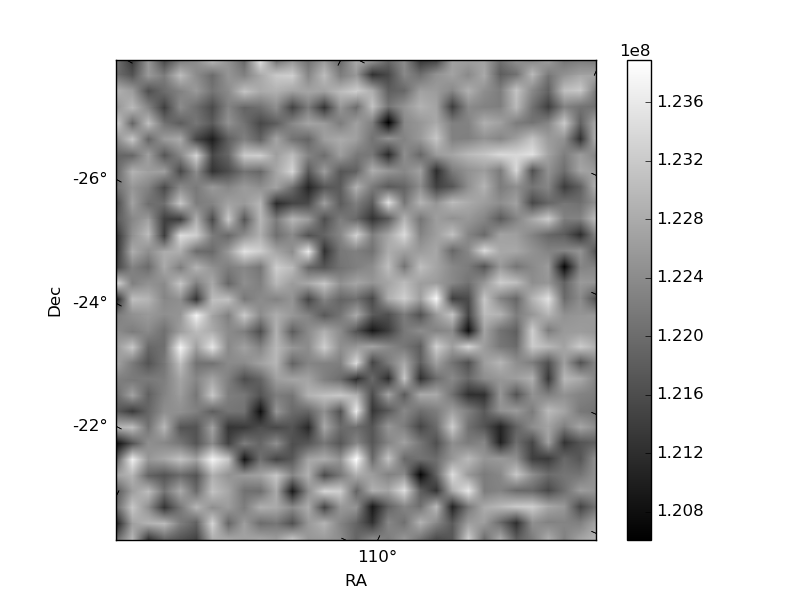
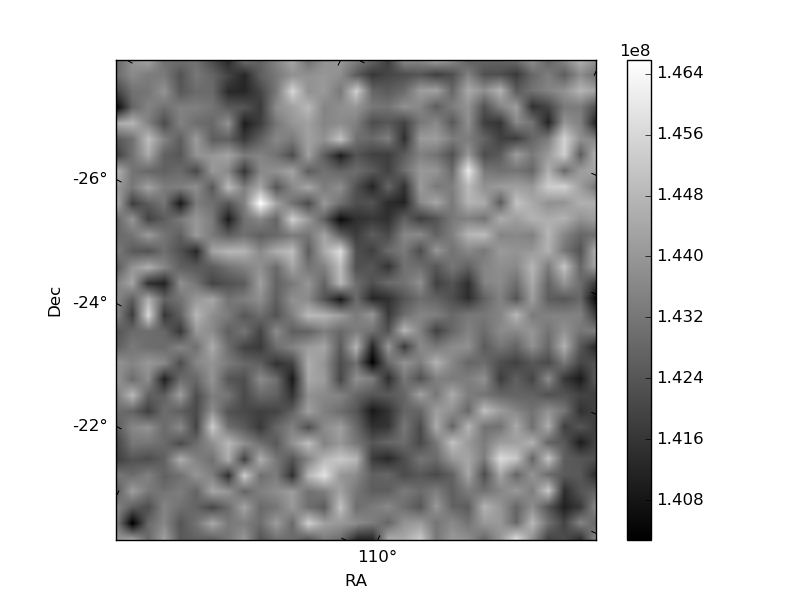
Histogram calculated using DETX and DETY for each event in the final _common_clean file
| Quadrant A | 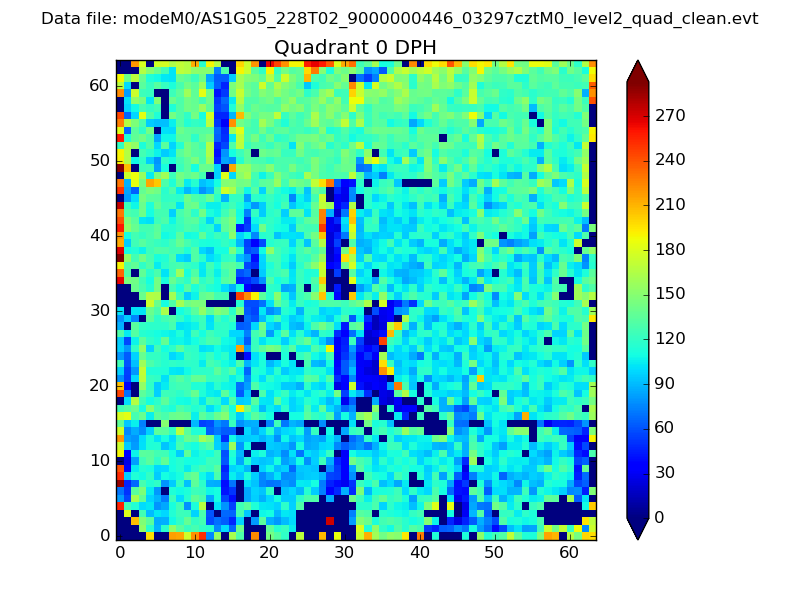 |
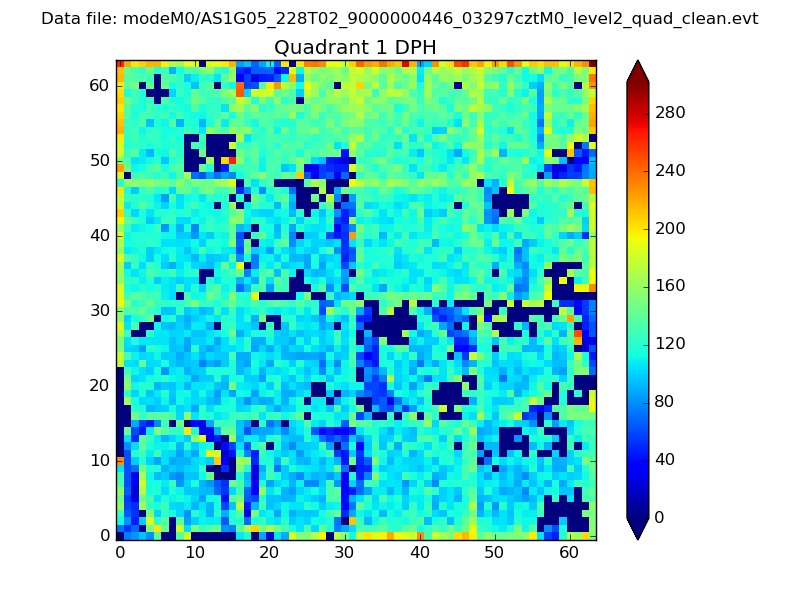 |
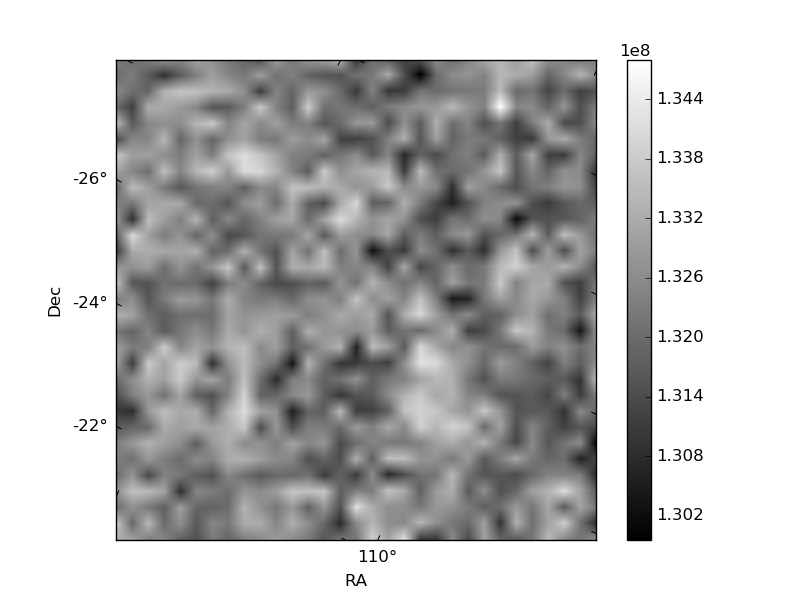
Quadrant B |
|---|---|---|---|
| Quadrant D | 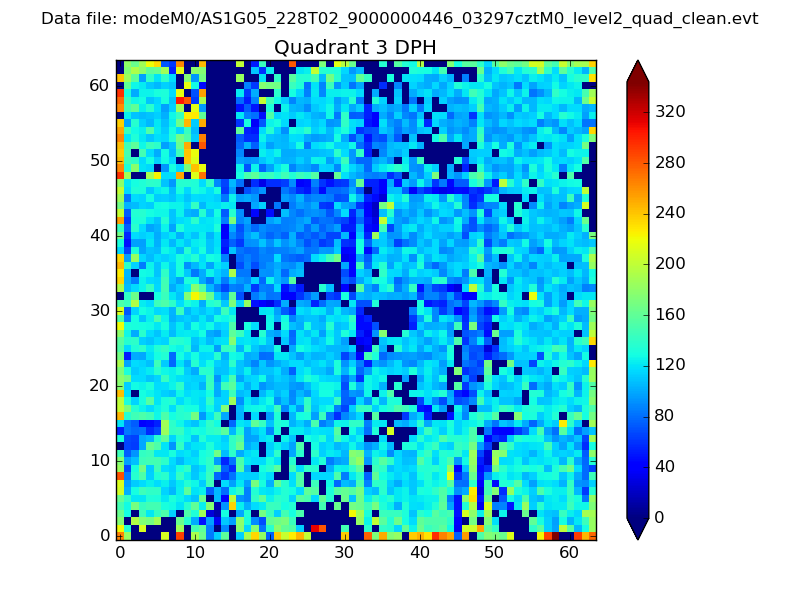 |
 |
Quadrant C |
| Plot type | Count rate plots | Images |
|---|---|---|
| Comparison with Poisson distribution Blue bars denote a histogram of data divided into 1 sec bins. Red curve is a Poisson curve with rate = median count rate of data. |
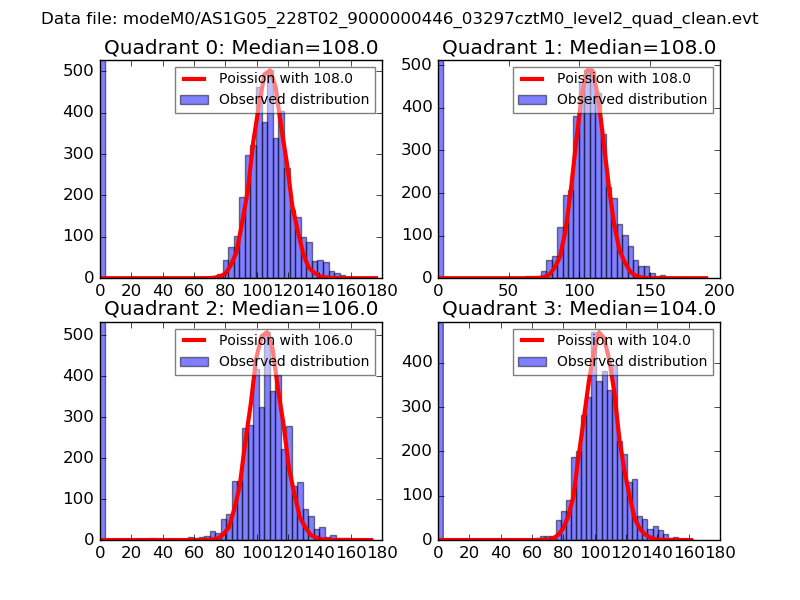 |
 |
| Quadrant-wise count rates Data is divided into 100 sec bins |
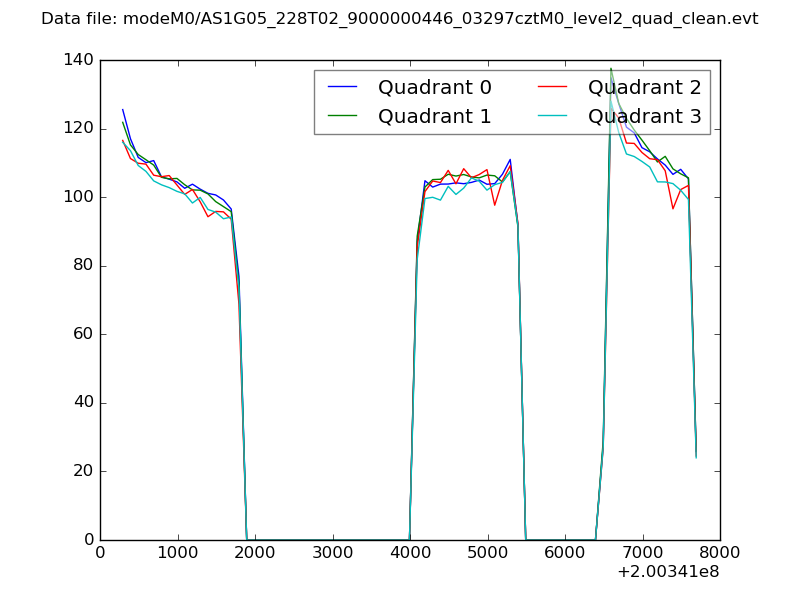 |
|
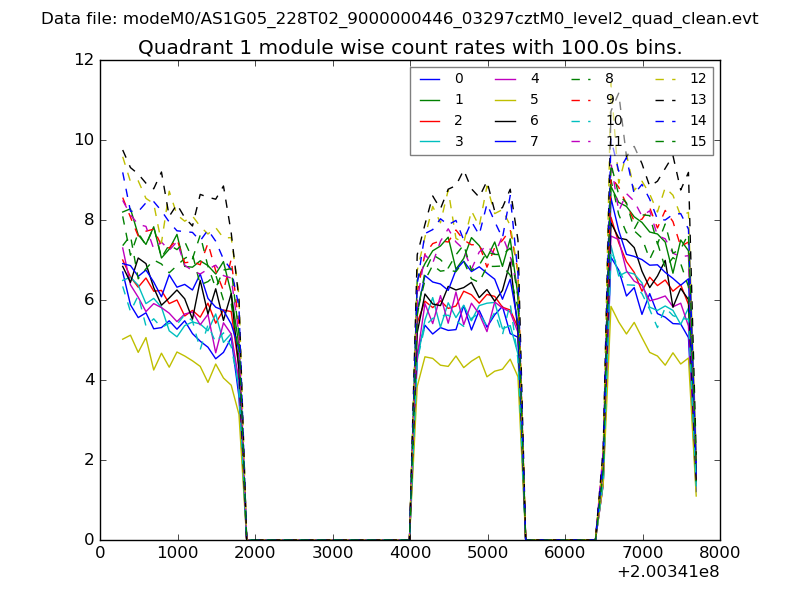
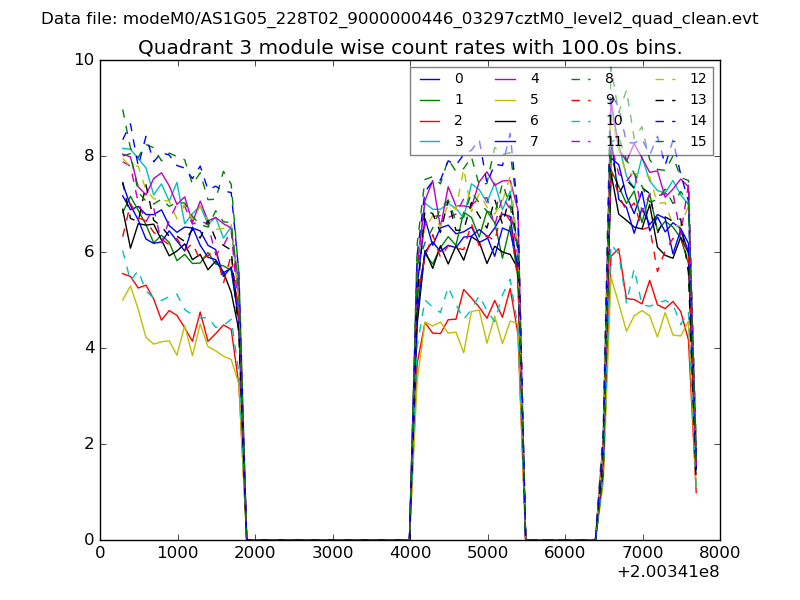
| Module-wise count rates for Quadrant A Data is divided into 100 sec bins |
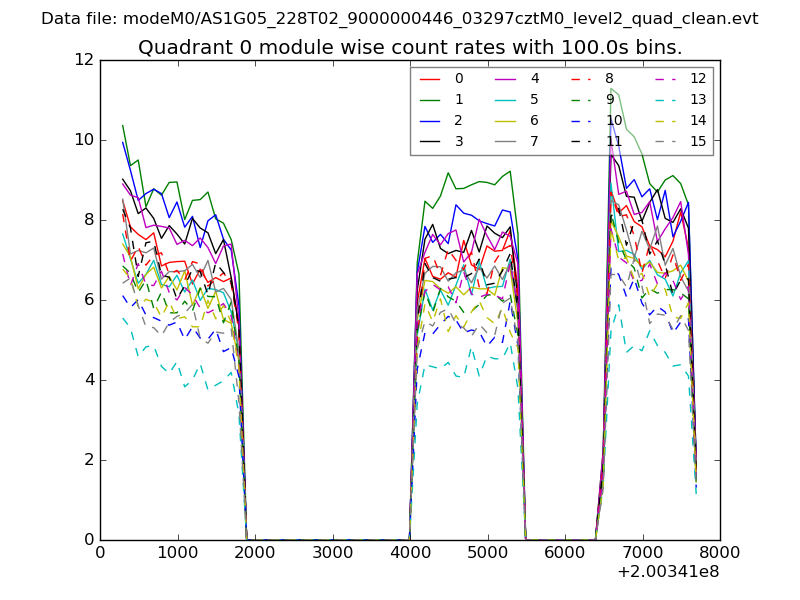 |
 |
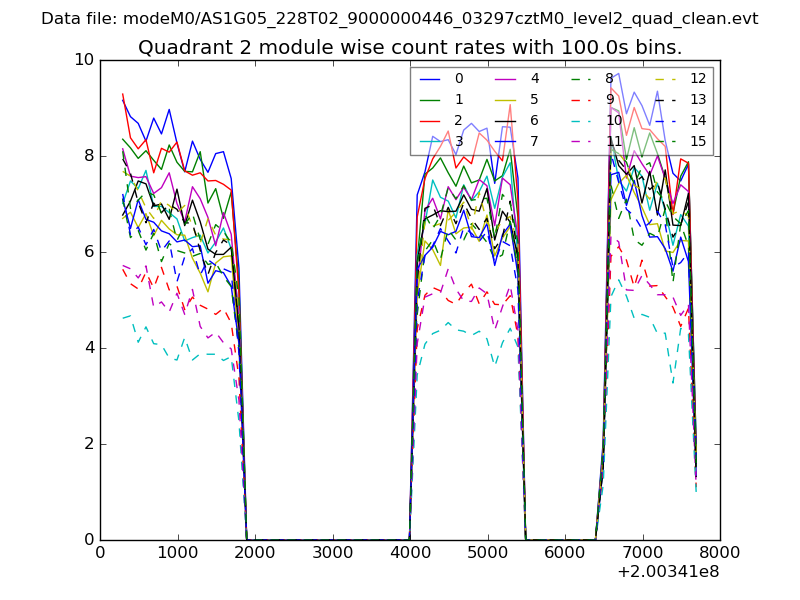
| Module-wise count rates for Quadrant B Data is divided into 100 sec bins |
 |
 |
| Module-wise count rates for Quadrant C Data is divided into 100 sec bins |
 |
 |
| Module-wise count rates for Quadrant D Data is divided into 100 sec bins |
 |
 |
| Parameter | Plot |
|---|---|
| CZT HV Monitor | 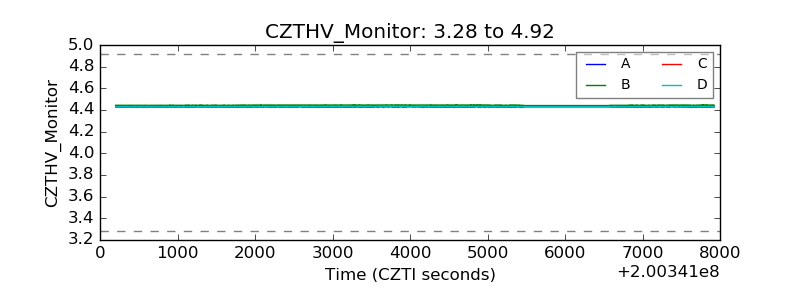 |
| D_VDD | 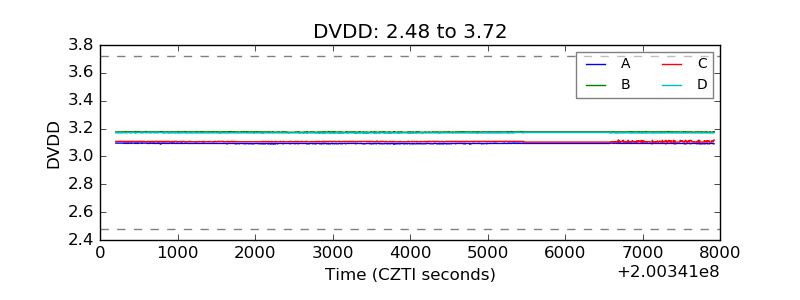 |
| Temperature 1 | 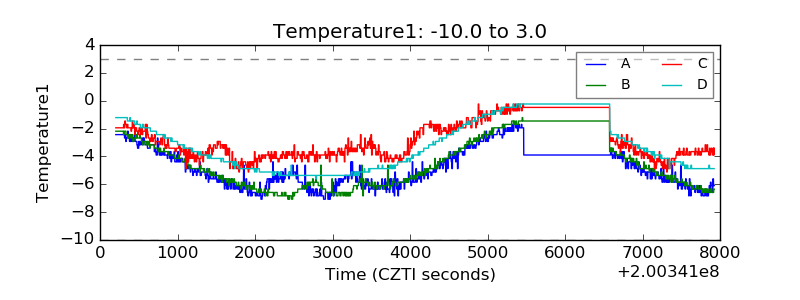 |
| Veto HV Monitor | 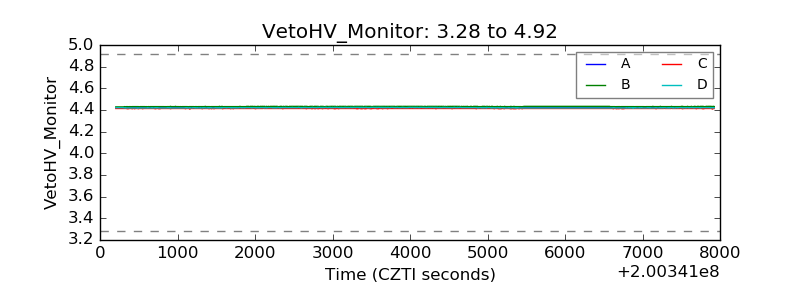 |
| Veto LLD | 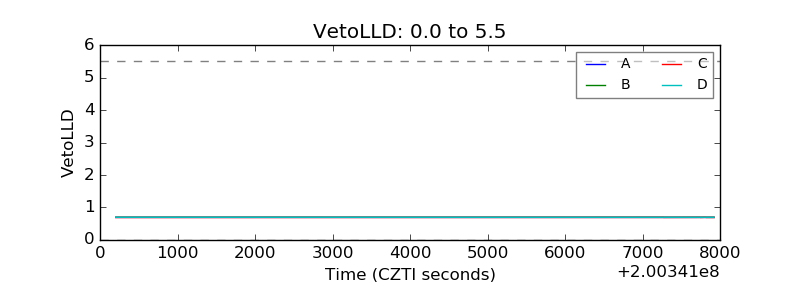 |
| Alpha Counter | 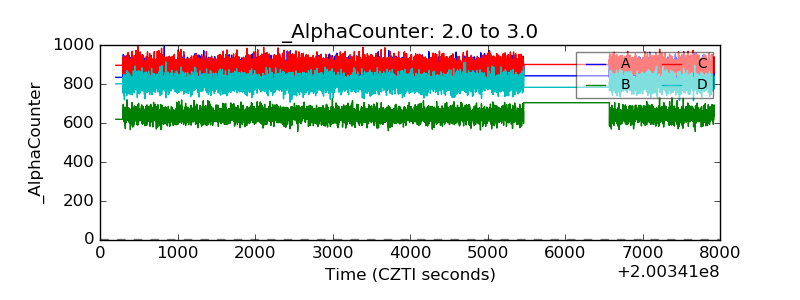 |
| _CPM_Rate | 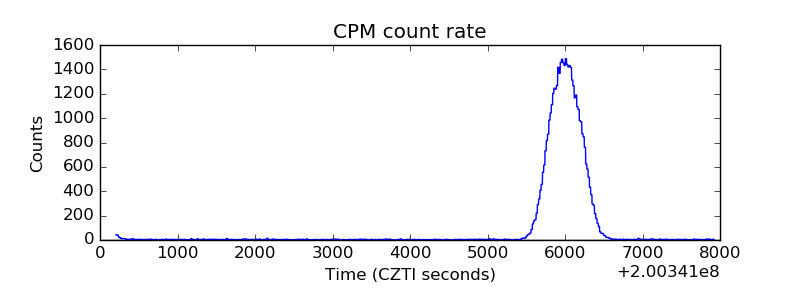 |
| CZT Counter | 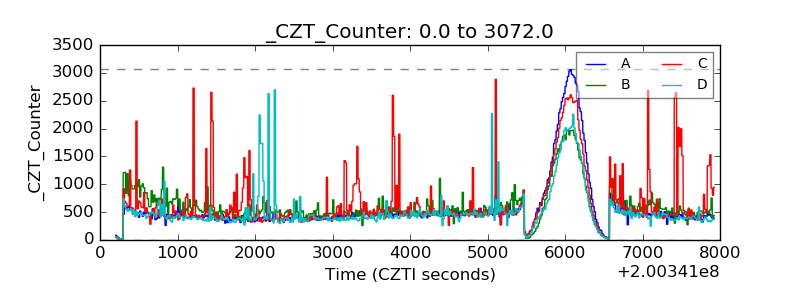 |
| +2.5 Volts monitor |  |
| +5 Volts monitor |  |
| _ROLL_ROT | 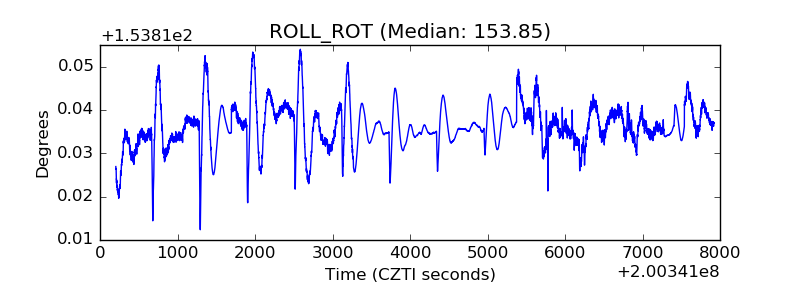 |
| _Roll_DEC | 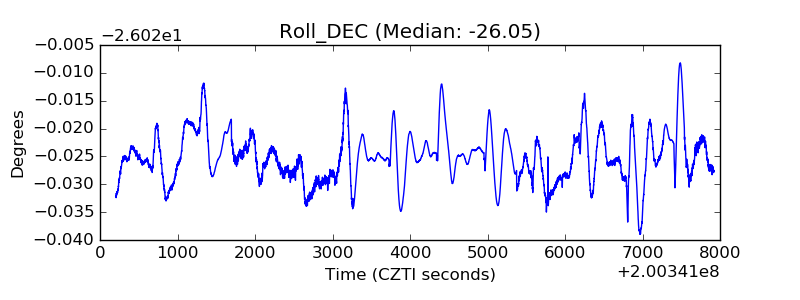 |
| _Roll_RA | 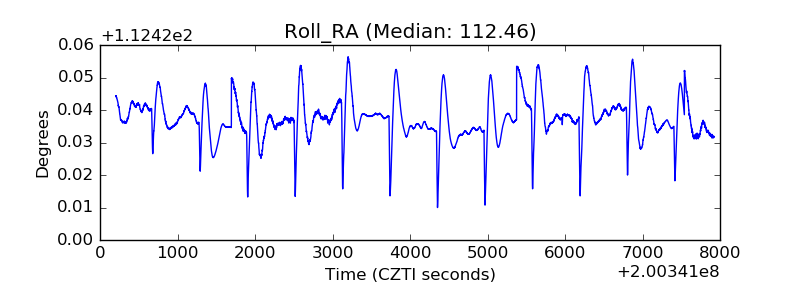 |
| Veto Counter | 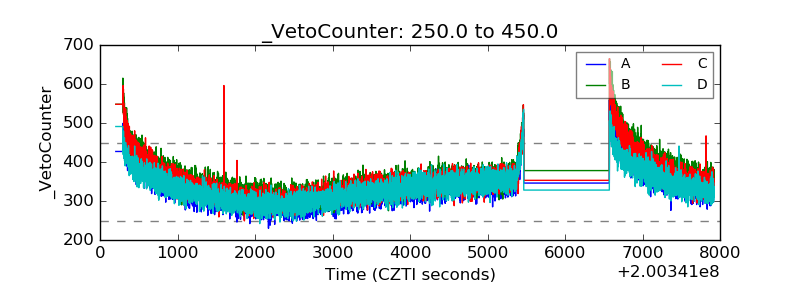 |