| Param | Original file | Final file |
|---|---|---|
| Filename | modeM0/AS1G05_228T02_9000000446_03298cztM0_level2.evt | modeM0/AS1G05_228T02_9000000446_03298cztM0_level2_quad_clean.evt |
| Size (bytes) | 451,512,000 | 68,209,920 |
| Size | 430.6 MB | 65.1 MB |
| Events in quadrant A | 3,061,074 | 407,823 |
| Events in quadrant B | 3,682,289 | 412,066 |
| Events in quadrant C | 3,573,556 | 402,778 |
| Events in quadrant D | 2,918,180 | 391,823 |
| Mode SS | |||
|---|---|---|---|
| Quadrant | BADHDUFLAG | Total packets | Discarded packets |
| A | 0 | 130 | 0 |
| B | 0 | 130 | 0 |
| C | 0 | 130 | 0 |
| D | 0 | 130 | 0 |
| Mode M0 | |||
|---|---|---|---|
| Quadrant | BADHDUFLAG | Total packets | Discarded packets |
| A | 0 | 13518 | 2 |
| B | 0 | 15104 | 1 |
| C | 0 | 14991 | 1 |
| D | 0 | 13463 | 1 |
| Mode M9 | |||
|---|---|---|---|
| Quadrant | BADHDUFLAG | Total packets | Discarded packets |
| A | 0 | 17 | 0 |
| B | 0 | 17 | 0 |
| C | 0 | 17 | 0 |
| D | 0 | 18 | 0 |
| Quadrant | Total seconds | Saturated seconds | Saturation percentage |
|---|---|---|---|
| A | 6466 | 63 | 0.974327% |
| B | 6466 | 72 | 1.113517% |
| C | 6466 | 83 | 1.283637% |
| D | 6466 | 25 | 0.386638% |
Noise dominated data is calculated using 1-second bins in cleaned event files. If a bin has >2000 counts, and if more than 50% of those come from <1% of pixels, then it is considered to be noise-dominated and hence unusable.
| Quadrant | # 1 sec bins | Bins with >0 counts | Bins with >2000 counts | High rate bins dominated by noise | Noise dominated (total time) | Noise dominated (detector-on time) | Marked lightcurve |
|---|---|---|---|---|---|---|---|
| A | 7626 | 6467 | 25 | 25 | 0.33% | 0.39% | 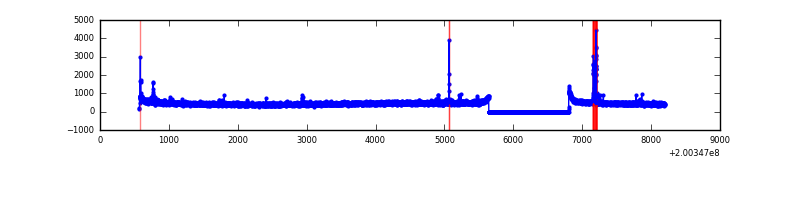 |
| B | 7626 | 6467 | 5 | 5 | 0.07% | 0.08% | 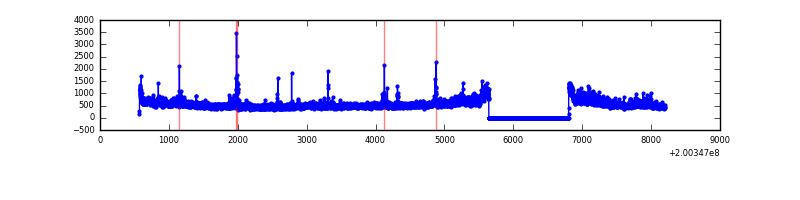 |
| C | 7626 | 6467 | 65 | 65 | 0.85% | 1.01% |  |
| D | 7626 | 6467 | 18 | 18 | 0.24% | 0.28% | 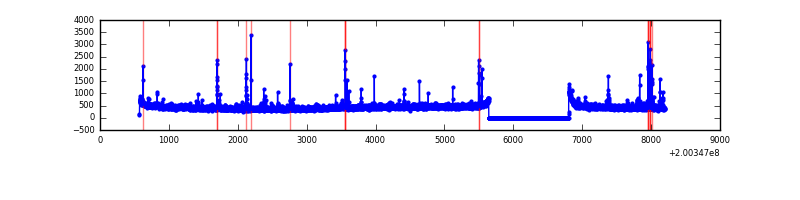 |
Top three noisy pixels from each quadrant. If the there are fewer than three noisy pixels in the level2.evt file, extra rows are filled as -1
| Pixel properties | Quadrant properties | ||||||
|---|---|---|---|---|---|---|---|
| Quadrant | DetID | PixID | Counts | Sigma | Mean | Median | Sigma |
| A | 0 | 50 | 93422 | 588.4 | 762 | 748 | 157.5 |
| A | 0 | 118 | 27152 | 167.64 | 762 | 748 | 157.5 |
| A | 0 | 226 | 10654 | 62.89 | 762 | 748 | 157.5 |
| B | 15 | 204 | 563513 | 3726.2 | 781 | 764 | 151.0 |
| B | 2 | 249 | 55210 | 360.51 | 781 | 764 | 151.0 |
| B | 4 | 81 | 17018 | 107.62 | 781 | 764 | 151.0 |
| C | 1 | 192 | 244345 | 1423.76 | 732 | 737 | 171.1 |
| C | 14 | 223 | 186107 | 1083.39 | 732 | 737 | 171.1 |
| C | 6 | 80 | 94469 | 547.81 | 732 | 737 | 171.1 |
| D | 13 | 223 | 86412 | 484.3 | 729 | 707 | 177.0 |
| D | 2 | 206 | 21773 | 119.04 | 729 | 707 | 177.0 |
| D | 14 | 34 | 15908 | 85.9 | 729 | 707 | 177.0 |
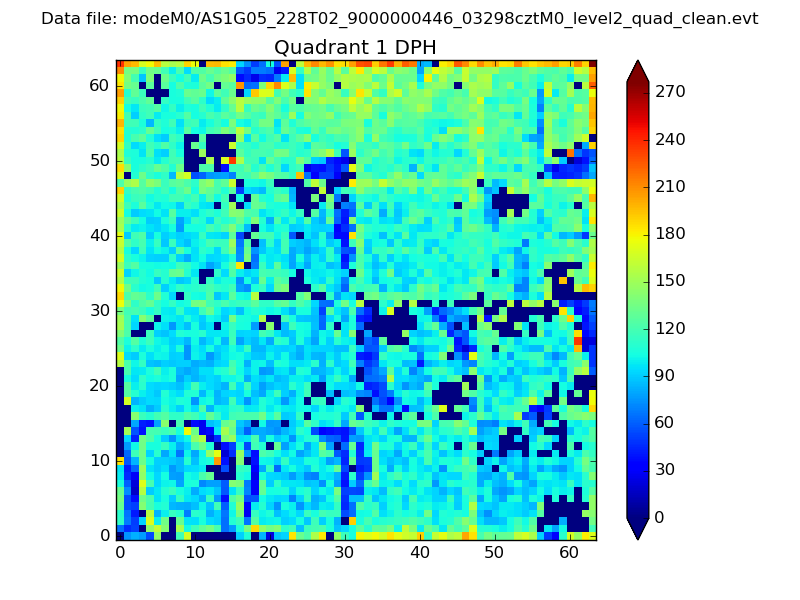
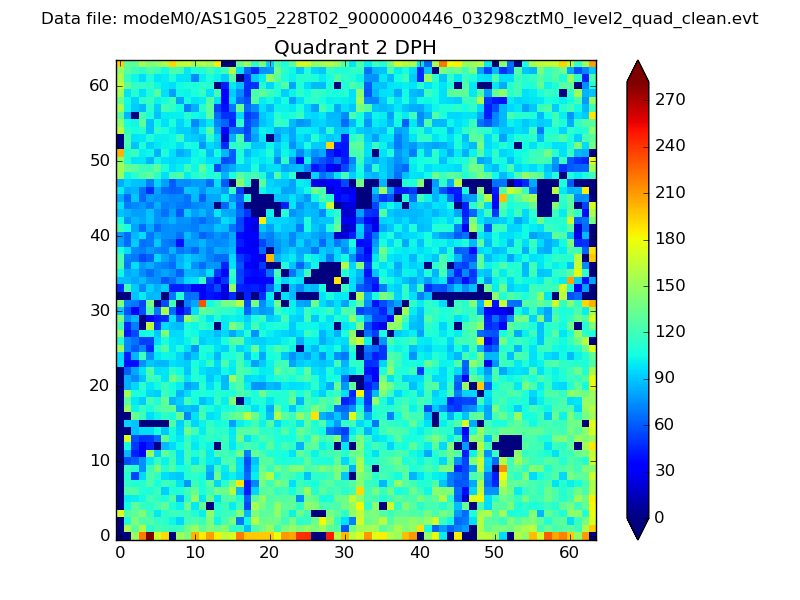
Histogram calculated using DETX and DETY for each event in the final _common_clean file
| Quadrant A | 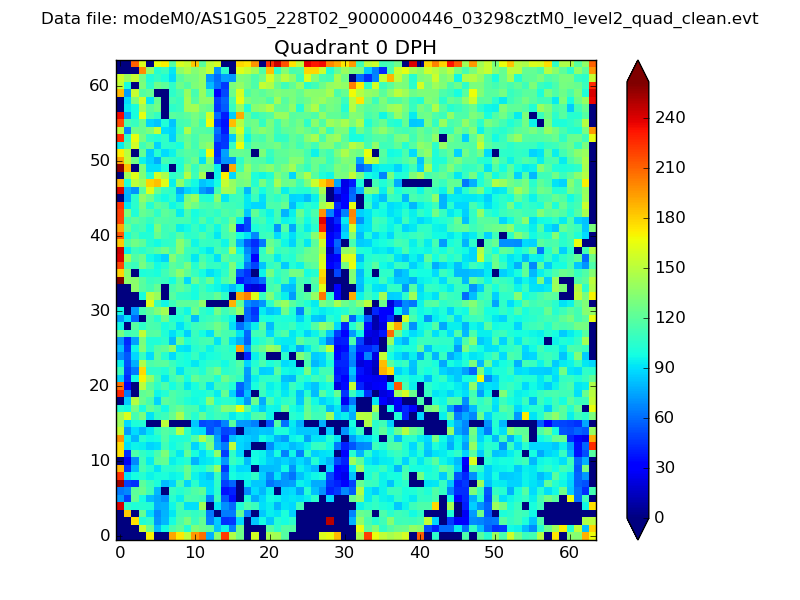 |
 |
Quadrant B |
|---|---|---|---|
| Quadrant D | 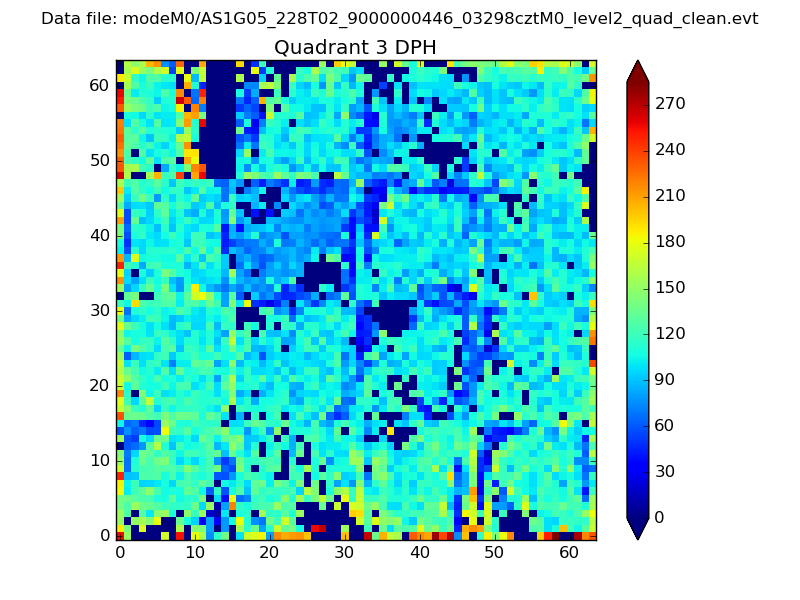 |
 |
Quadrant C |
| Plot type | Count rate plots | Images |
|---|---|---|
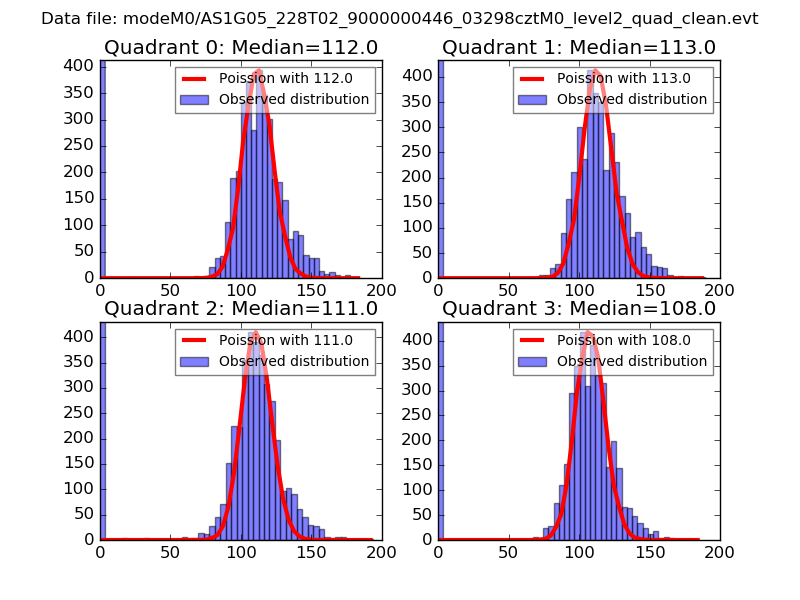
| Comparison with Poisson distribution Blue bars denote a histogram of data divided into 1 sec bins. Red curve is a Poisson curve with rate = median count rate of data. |
 |
 |
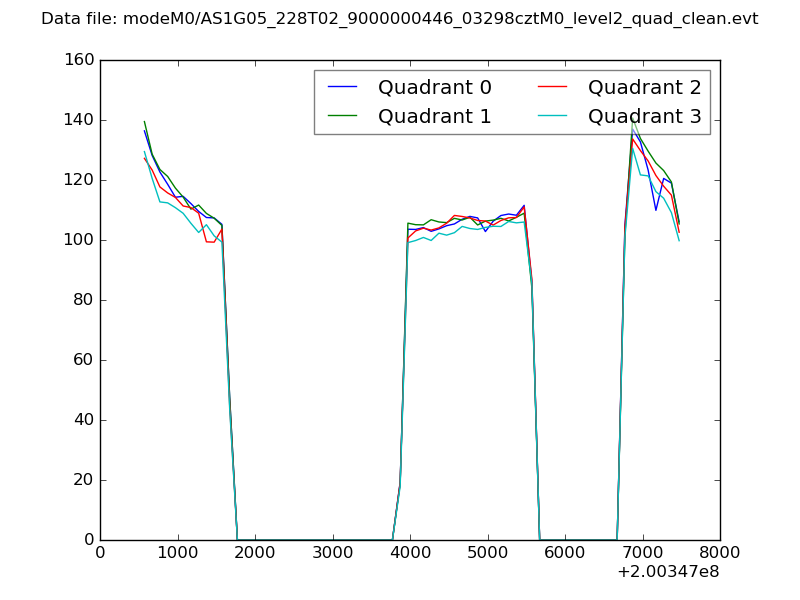
| Quadrant-wise count rates Data is divided into 100 sec bins |
 |
|
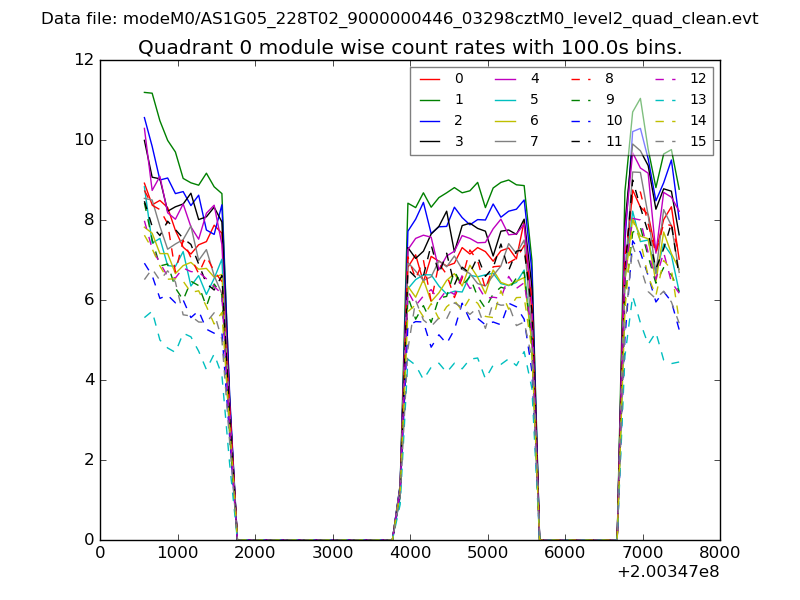
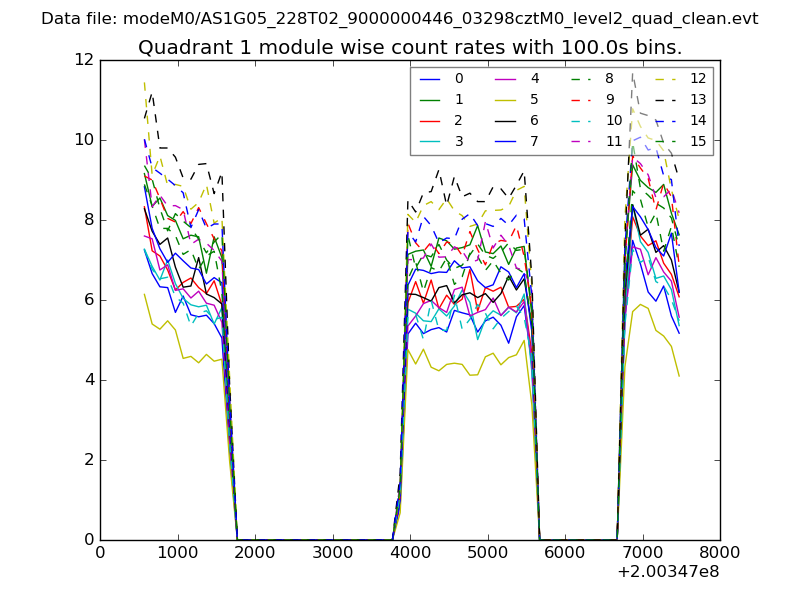
| Module-wise count rates for Quadrant A Data is divided into 100 sec bins |
 |
 |
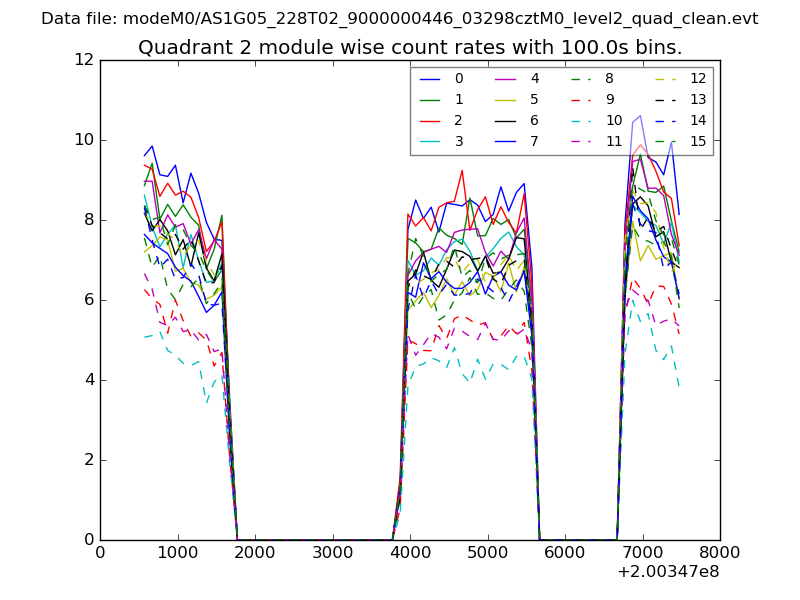
| Module-wise count rates for Quadrant B Data is divided into 100 sec bins |
 |
 |
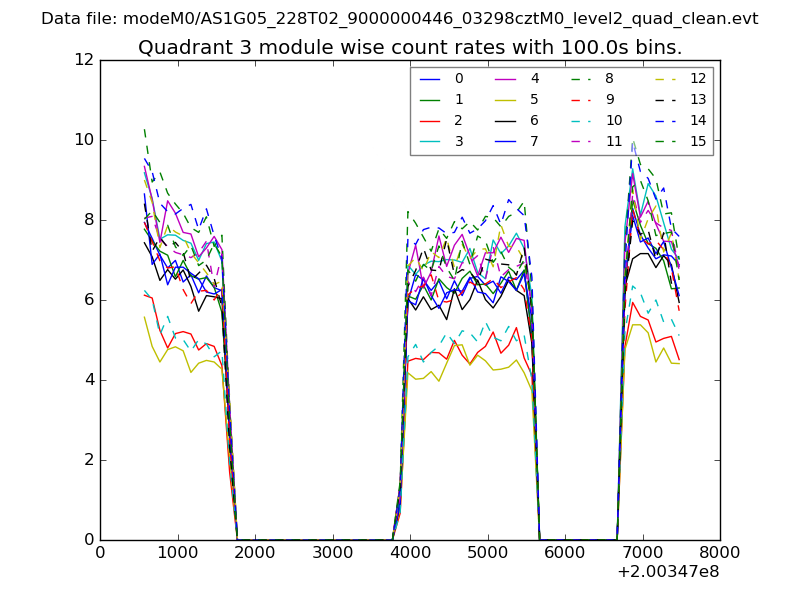
| Module-wise count rates for Quadrant C Data is divided into 100 sec bins |
 |
 |
| Module-wise count rates for Quadrant D Data is divided into 100 sec bins |
 |
 |
| Parameter | Plot |
|---|---|
| CZT HV Monitor | 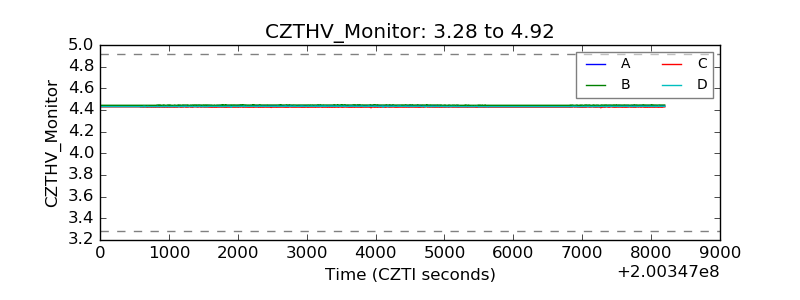 |
| D_VDD | 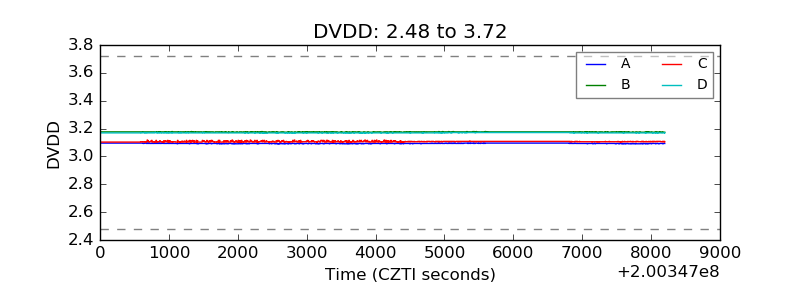 |
| Temperature 1 | 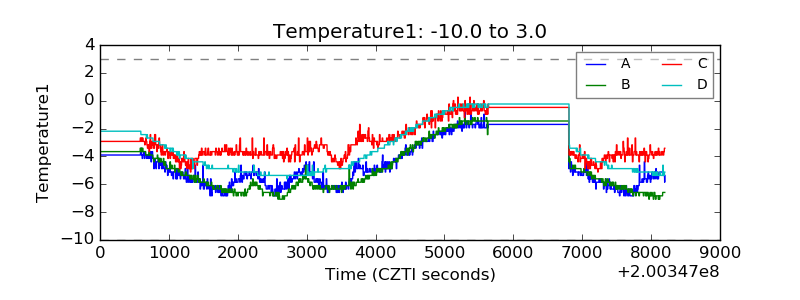 |
| Veto HV Monitor | 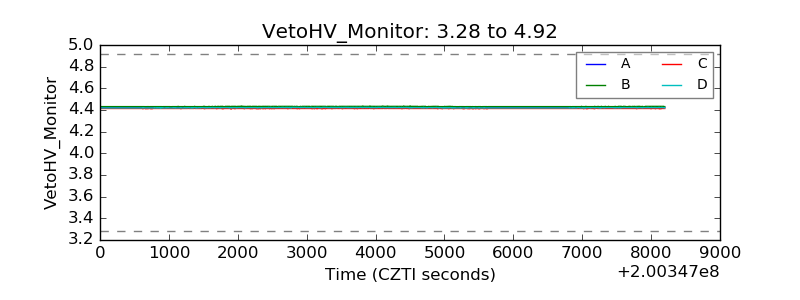 |
| Veto LLD | 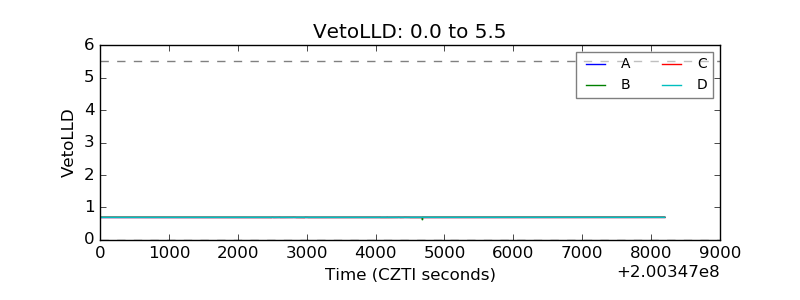 |
| Alpha Counter | 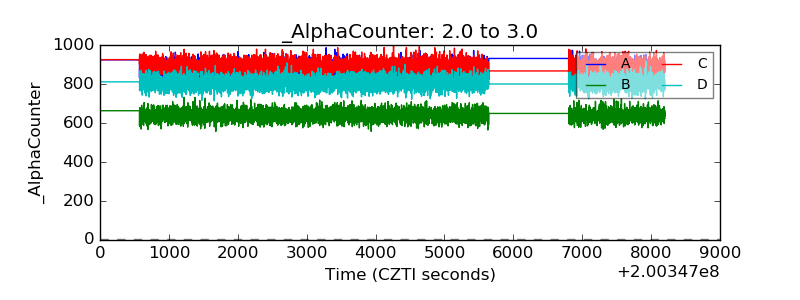 |
| _CPM_Rate | 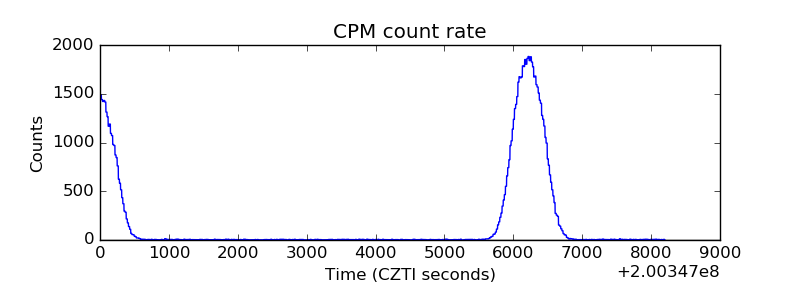 |
| CZT Counter | 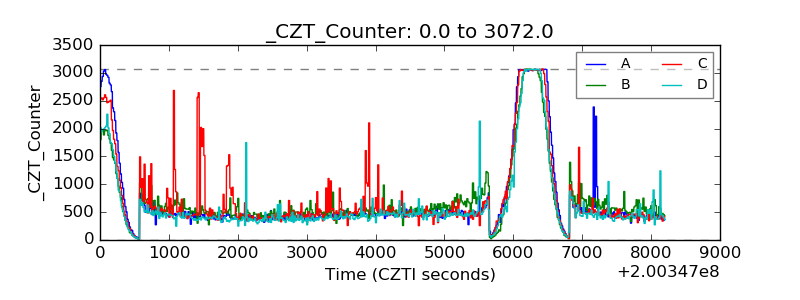 |
| +2.5 Volts monitor |  |
| +5 Volts monitor |  |
| _ROLL_ROT | 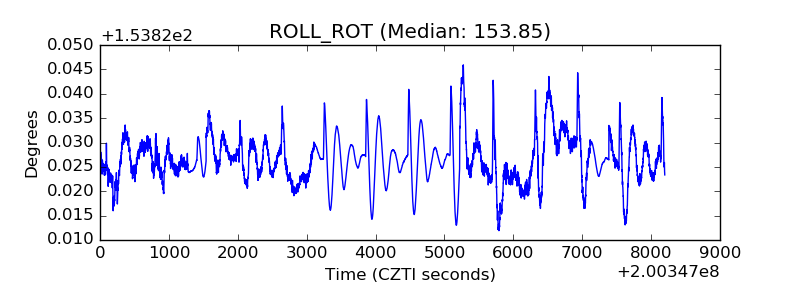 |
| _Roll_DEC | 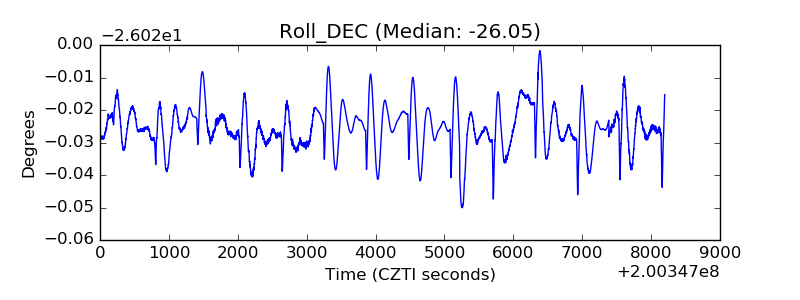 |
| _Roll_RA | 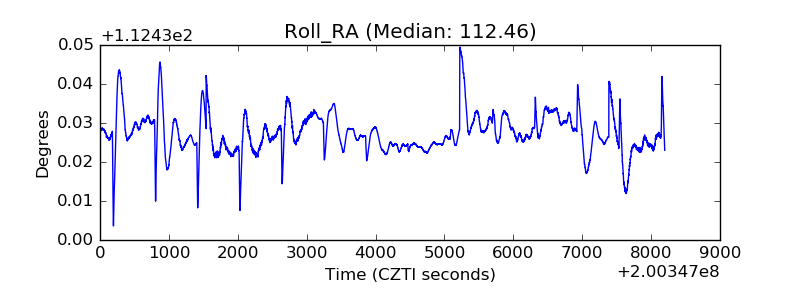 |
| Veto Counter | 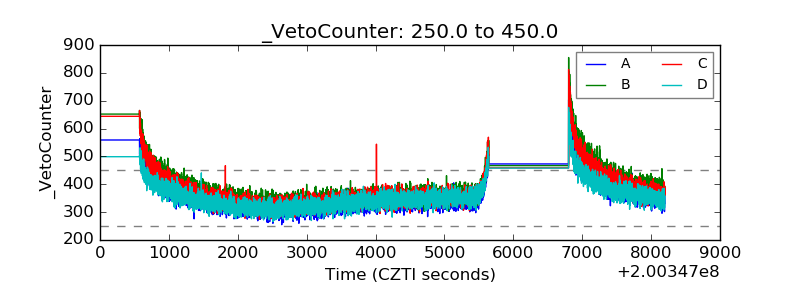 |