| Param | Original file | Final file |
|---|---|---|
| Filename | modeM0/AS1G05_228T02_9000000446_03300cztM0_level2.evt | modeM0/AS1G05_228T02_9000000446_03300cztM0_level2_quad_clean.evt |
| Size (bytes) | 265,720,320 | 33,664,320 |
| Size | 253.4 MB | 32.1 MB |
| Events in quadrant A | 1,820,136 | 187,330 |
| Events in quadrant B | 2,260,015 | 191,920 |
| Events in quadrant C | 1,914,133 | 187,630 |
| Events in quadrant D | 1,789,106 | 179,159 |
| Mode SS | |||
|---|---|---|---|
| Quadrant | BADHDUFLAG | Total packets | Discarded packets |
| A | 0 | 76 | 0 |
| B | 0 | 76 | 0 |
| C | 0 | 76 | 0 |
| D | 0 | 76 | 0 |
| Mode M0 | |||
|---|---|---|---|
| Quadrant | BADHDUFLAG | Total packets | Discarded packets |
| A | 0 | 8051 | 0 |
| B | 0 | 9101 | 0 |
| C | 0 | 8326 | 0 |
| D | 0 | 8136 | 0 |
| Mode M9 | |||
|---|---|---|---|
| Quadrant | BADHDUFLAG | Total packets | Discarded packets |
| A | 0 | 8 | 0 |
| B | 0 | 8 | 0 |
| C | 0 | 8 | 0 |
| D | 0 | 9 | 0 |
| Quadrant | Total seconds | Saturated seconds | Saturation percentage |
|---|---|---|---|
| A | 3865 | 45 | 1.164295% |
| B | 3865 | 46 | 1.190168% |
| C | 3865 | 28 | 0.724450% |
| D | 3865 | 24 | 0.620957% |
Noise dominated data is calculated using 1-second bins in cleaned event files. If a bin has >2000 counts, and if more than 50% of those come from <1% of pixels, then it is considered to be noise-dominated and hence unusable.
| Quadrant | # 1 sec bins | Bins with >0 counts | Bins with >2000 counts | High rate bins dominated by noise | Noise dominated (total time) | Noise dominated (detector-on time) | Marked lightcurve |
|---|---|---|---|---|---|---|---|
| A | 3865 | 3865 | 22 | 22 | 0.57% | 0.57% | 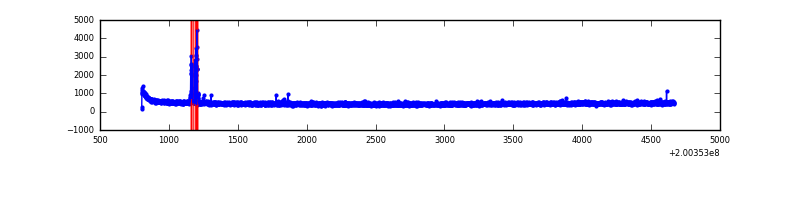 |
| B | 3865 | 3865 | 14 | 14 | 0.36% | 0.36% | 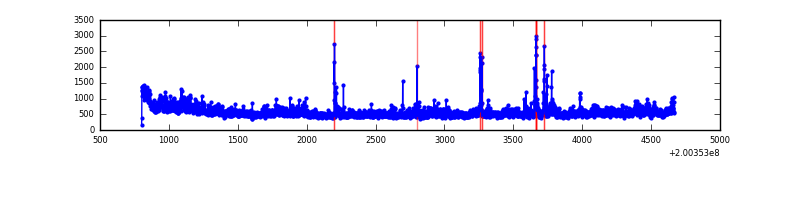 |
| C | 3865 | 3865 | 16 | 16 | 0.41% | 0.41% | 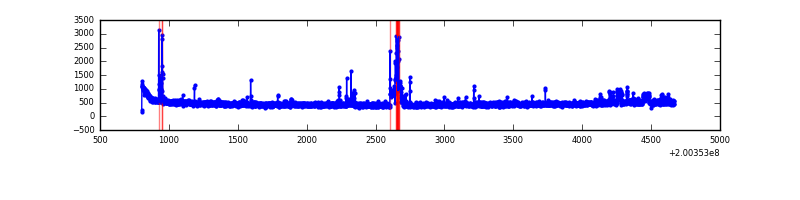 |
| D | 3865 | 3865 | 19 | 19 | 0.49% | 0.49% | 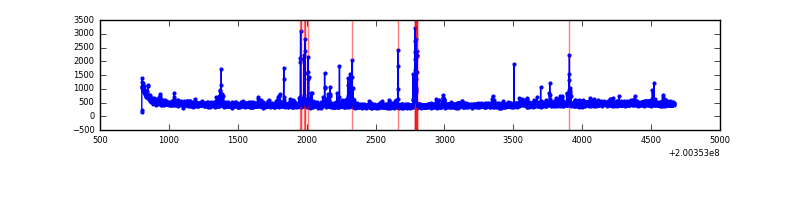 |
Top three noisy pixels from each quadrant. If the there are fewer than three noisy pixels in the level2.evt file, extra rows are filled as -1
| Pixel properties | Quadrant properties | ||||||
|---|---|---|---|---|---|---|---|
| Quadrant | DetID | PixID | Counts | Sigma | Mean | Median | Sigma |
| A | 0 | 50 | 67730 | 716.91 | 453 | 444 | 93.9 |
| A | 0 | 118 | 5165 | 50.3 | 453 | 444 | 93.9 |
| A | 0 | 226 | 5126 | 49.88 | 453 | 444 | 93.9 |
| B | 15 | 204 | 364393 | 4023.47 | 465 | 455 | 90.5 |
| B | 2 | 249 | 85209 | 936.99 | 465 | 455 | 90.5 |
| B | 4 | 81 | 6463 | 66.42 | 465 | 455 | 90.5 |
| C | 1 | 16 | 86407 | 835.0 | 439 | 442 | 103.0 |
| C | 8 | 208 | 55522 | 535.01 | 439 | 442 | 103.0 |
| C | 6 | 80 | 28777 | 275.23 | 439 | 442 | 103.0 |
| D | 13 | 223 | 80442 | 760.88 | 432 | 419 | 105.2 |
| D | 13 | 239 | 34677 | 325.74 | 432 | 419 | 105.2 |
| D | 2 | 206 | 19776 | 184.05 | 432 | 419 | 105.2 |
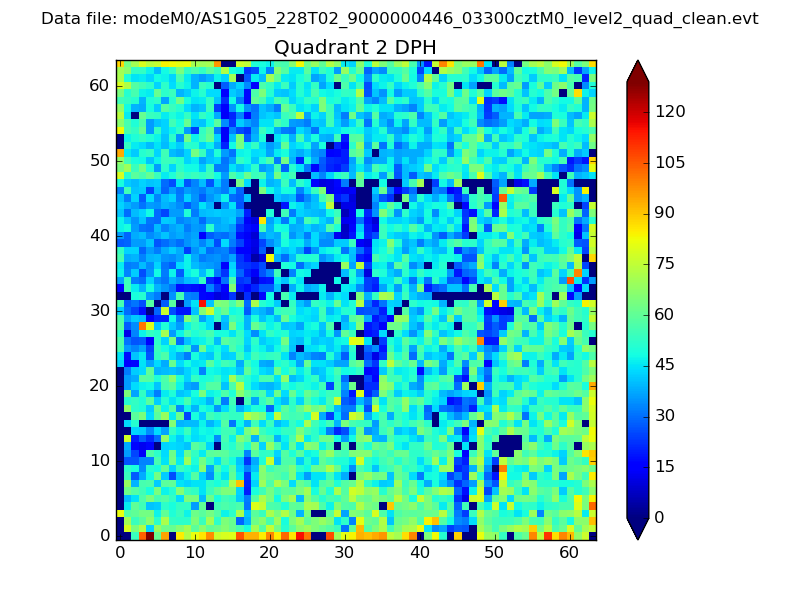
Histogram calculated using DETX and DETY for each event in the final _common_clean file
| Quadrant A | 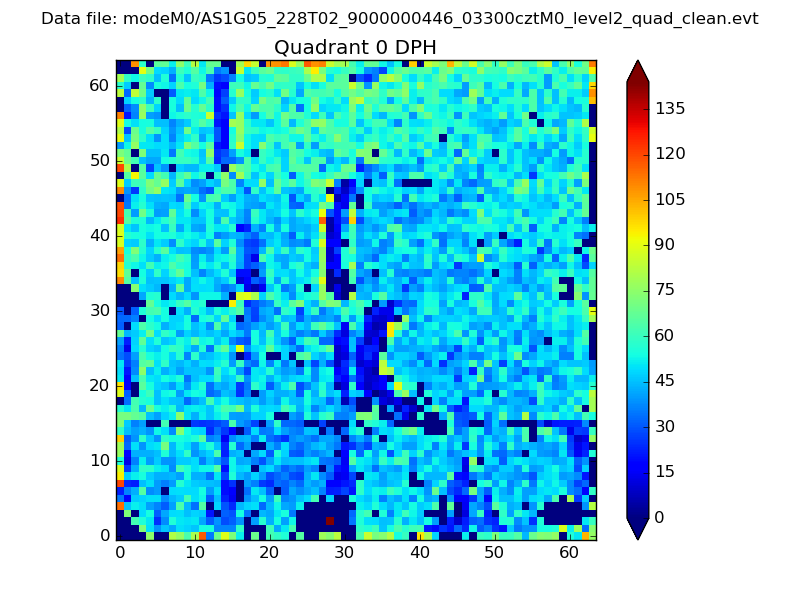 |
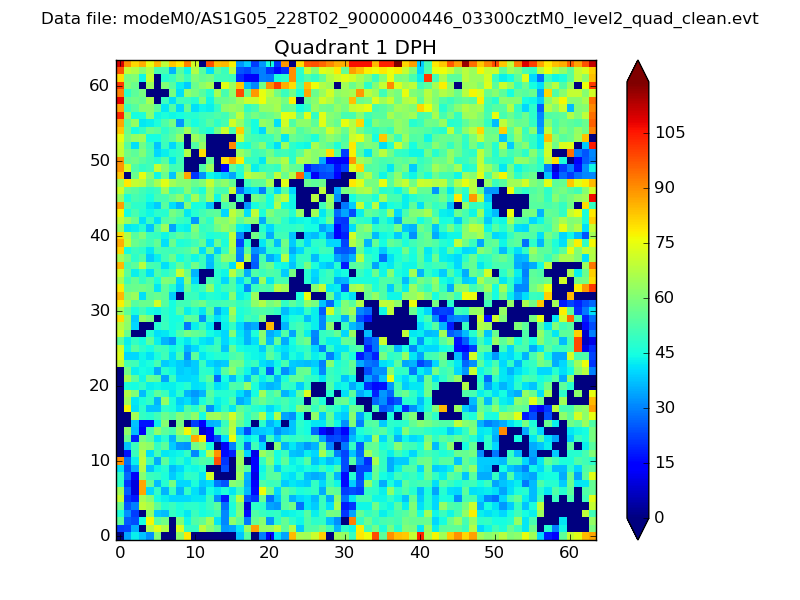 |
Quadrant B |
|---|---|---|---|
| Quadrant D | 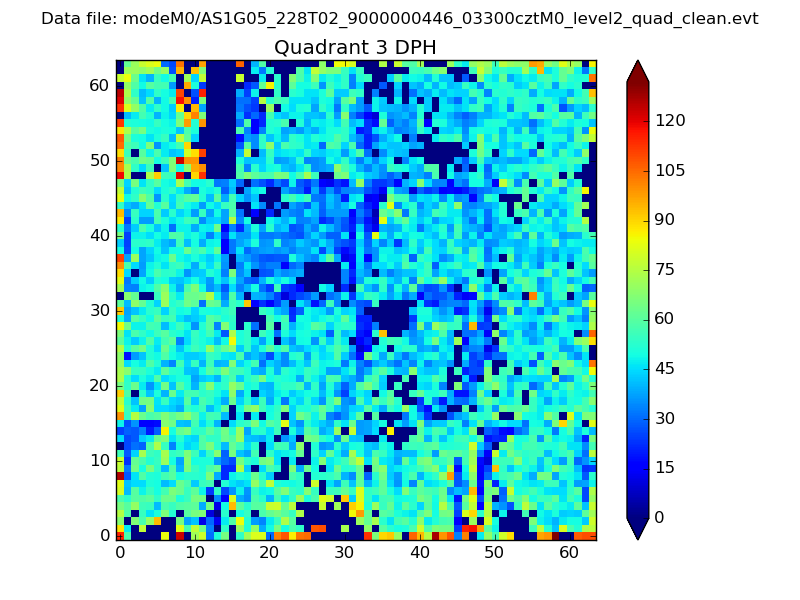 |
 |
Quadrant C |
| Plot type | Count rate plots | Images |
|---|---|---|
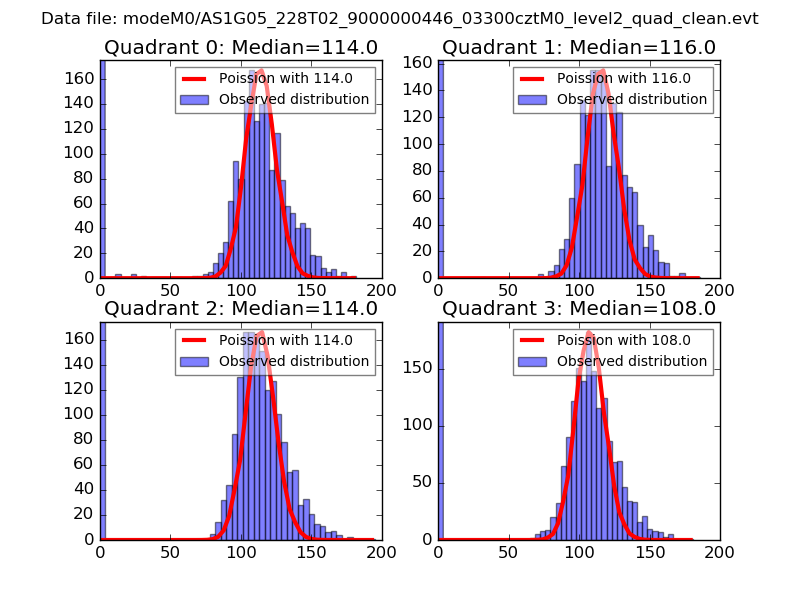
| Comparison with Poisson distribution Blue bars denote a histogram of data divided into 1 sec bins. Red curve is a Poisson curve with rate = median count rate of data. |
 |
 |
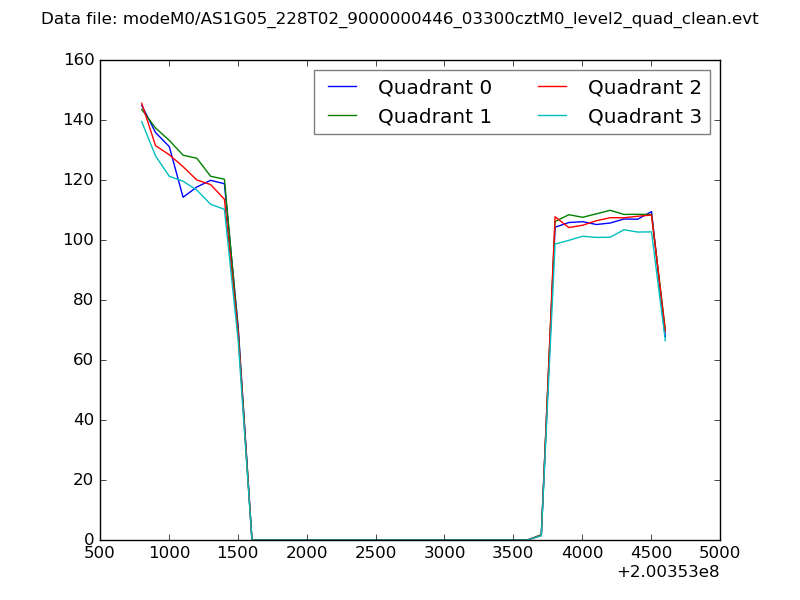
| Quadrant-wise count rates Data is divided into 100 sec bins |
 |
|
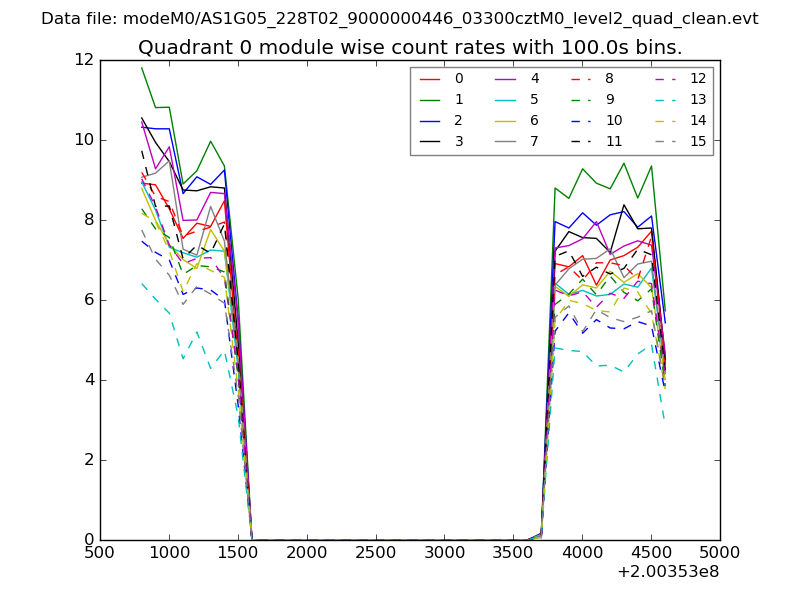
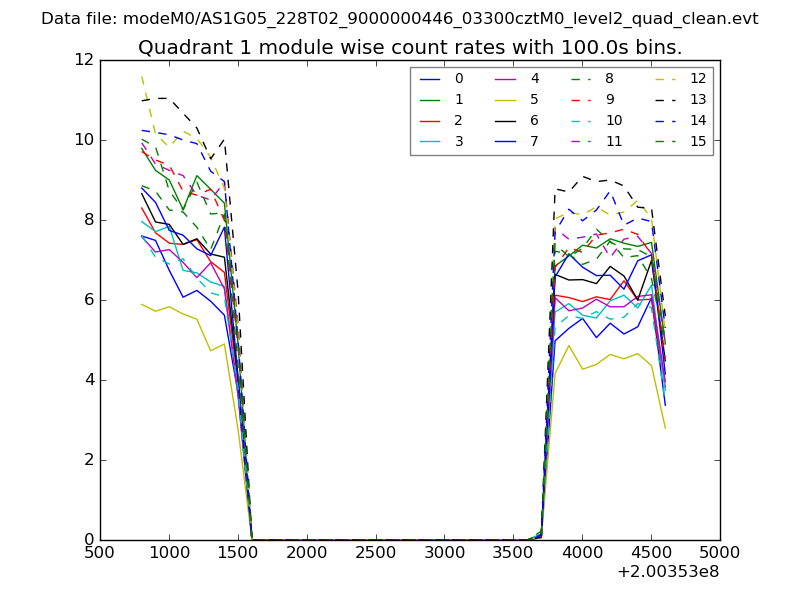
| Module-wise count rates for Quadrant A Data is divided into 100 sec bins |
 |
 |
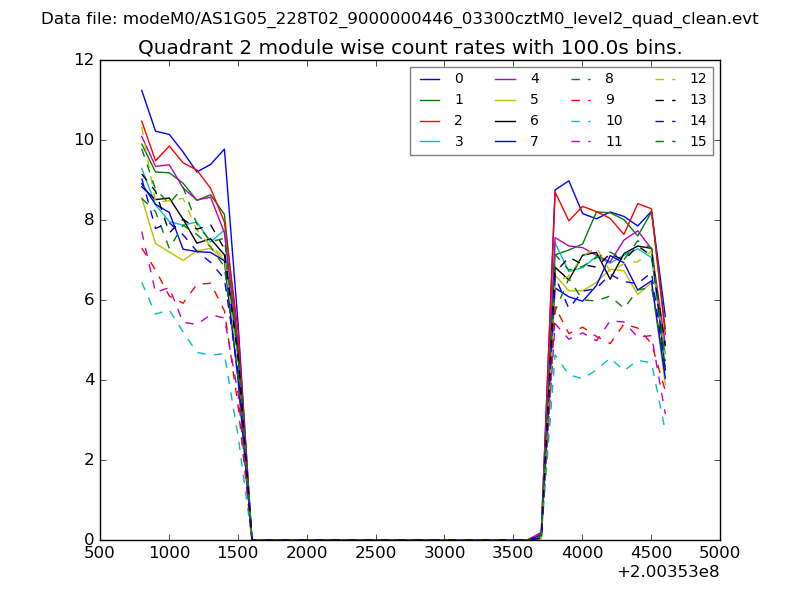
| Module-wise count rates for Quadrant B Data is divided into 100 sec bins |
 |
 |
| Module-wise count rates for Quadrant C Data is divided into 100 sec bins |
 |
 |
| Module-wise count rates for Quadrant D Data is divided into 100 sec bins |
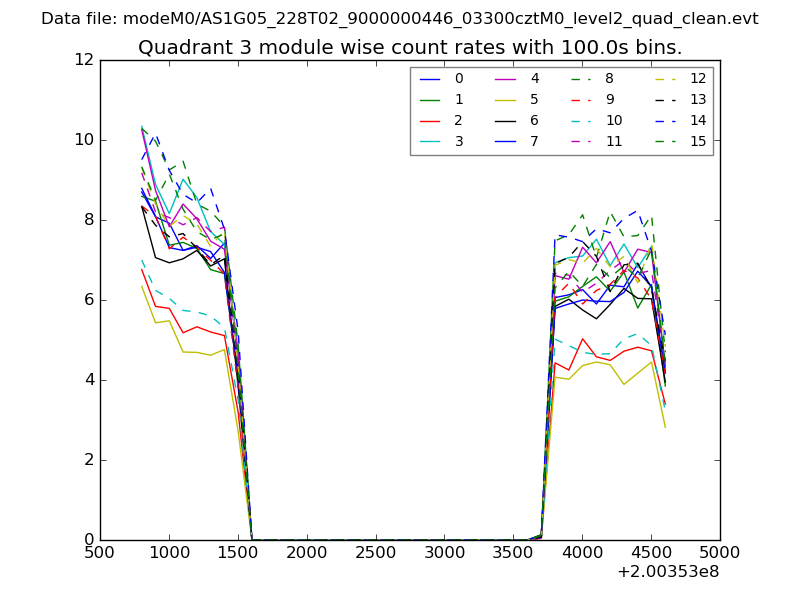 |
 |
| Parameter | Plot |
|---|---|
| CZT HV Monitor | 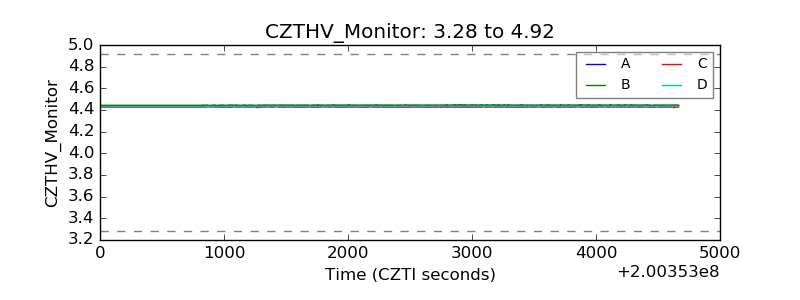 |
| D_VDD | 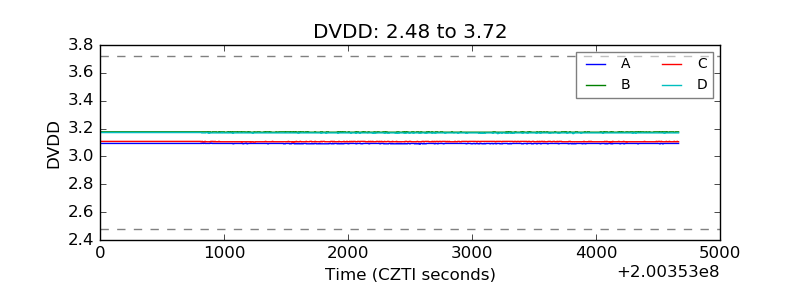 |
| Temperature 1 | 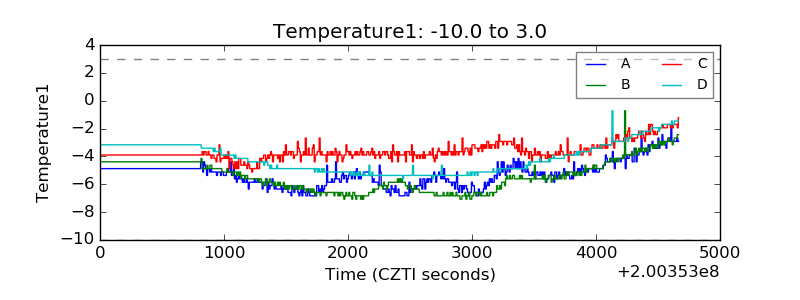 |
| Veto HV Monitor | 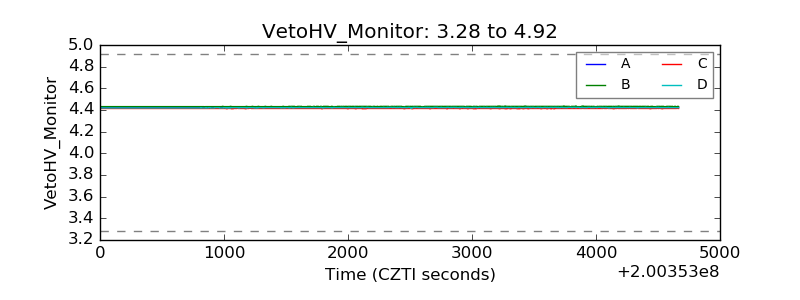 |
| Veto LLD | 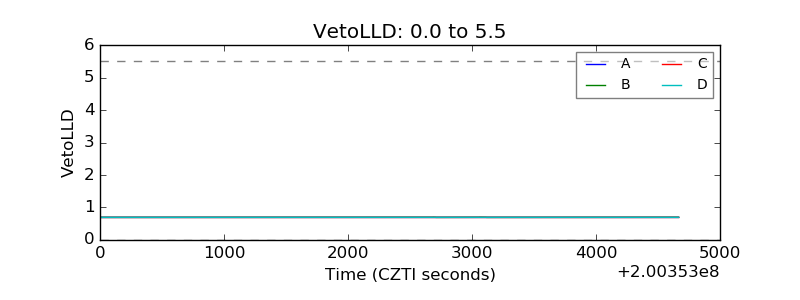 |
| Alpha Counter | 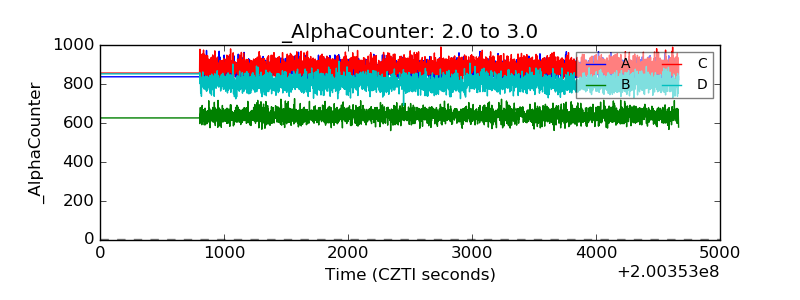 |
| _CPM_Rate | 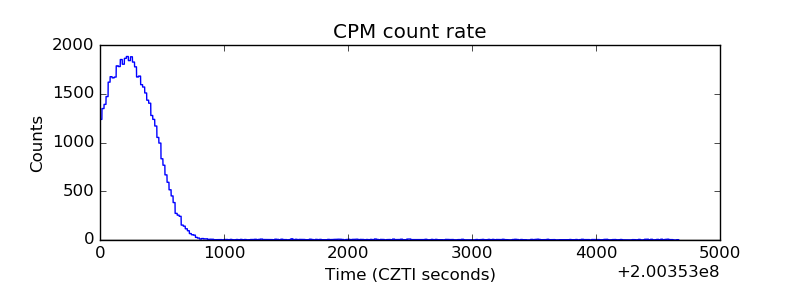 |
| CZT Counter | 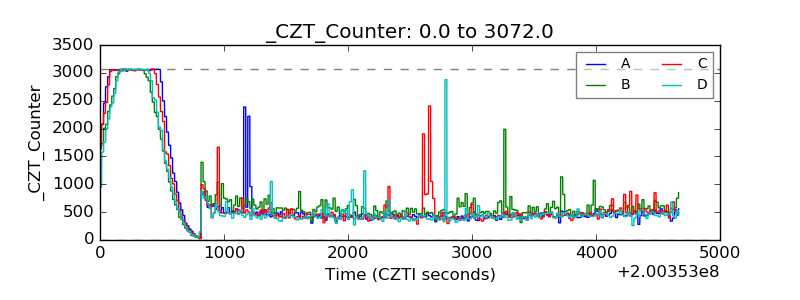 |
| +2.5 Volts monitor |  |
| +5 Volts monitor | 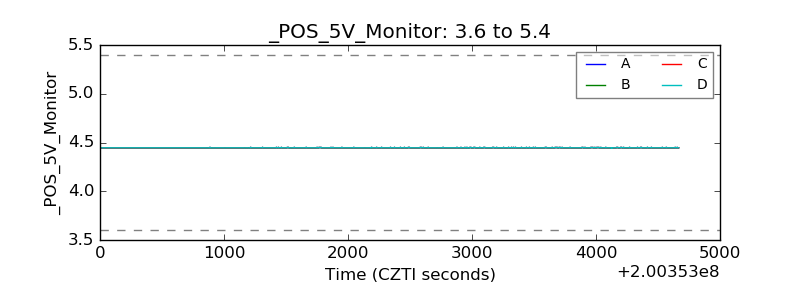 |
| _ROLL_ROT | 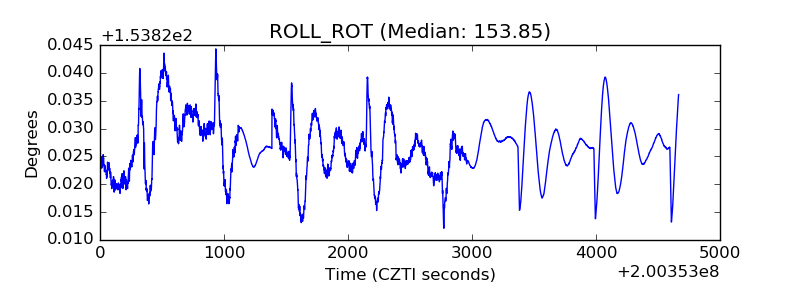 |
| _Roll_DEC | 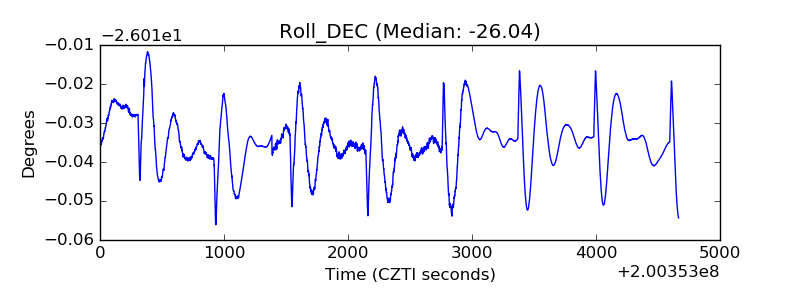 |
| _Roll_RA | 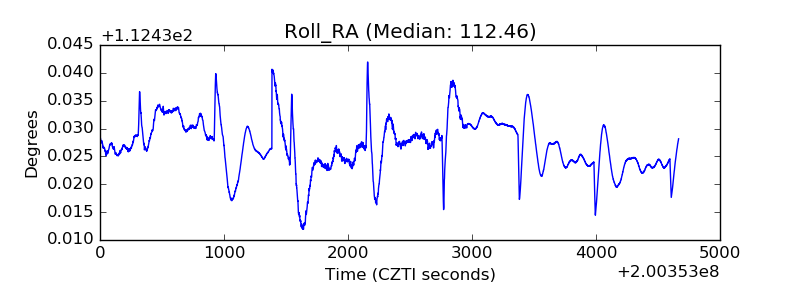 |
| Veto Counter | 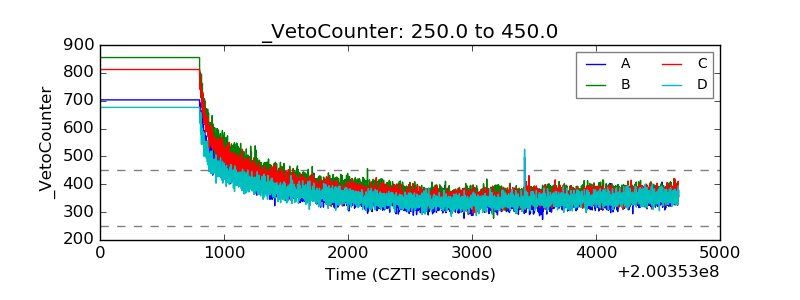 |