| Param | Original file | Final file |
|---|---|---|
| Filename | modeM0/AS1G05_241T02_9000000448cztM0_level2.fits | modeM0/AS1G05_241T02_9000000448cztM0_level2_quad_clean.evt |
| Size (bytes) | 1,021,674,240 | 1,046,707,200 |
| Size | 974.3 MB | 998.2 MB |
| Events in quadrant A | 6,074,970 | 6,177,743 |
| Events in quadrant B | 5,841,836 | 6,228,683 |
| Events in quadrant C | 6,041,018 | 5,998,784 |
| Events in quadrant D | 5,195,076 | 5,510,321 |
| Mode M0 | |||
|---|---|---|---|
| Quadrant | BADHDUFLAG | Total packets | Discarded packets |
| A | 0 | 242220 | 0 |
| B | 0 | 302676 | 0 |
| C | 0 | 243504 | 0 |
| D | 0 | 251279 | 0 |
| Mode SS | |||
|---|---|---|---|
| Quadrant | BADHDUFLAG | Total packets | Discarded packets |
| A | 0 | 2310 | 0 |
| B | 0 | 2310 | 0 |
| C | 0 | 2310 | 0 |
| D | 0 | 2310 | 0 |
| Mode M9 | |||
|---|---|---|---|
| Quadrant | BADHDUFLAG | Total packets | Discarded packets |
| A | 0 | 150 | 0 |
| B | 0 | 150 | 0 |
| C | 0 | 150 | 0 |
| D | 0 | 150 | 0 |
| Quadrant | Total seconds | Saturated seconds | Saturation percentage |
|---|---|---|---|
| A | 113592 | 2603 | 2.291535% |
| B | 113592 | 3564 | 3.137545% |
| C | 113592 | 1915 | 1.685858% |
| D | 113590 | 2639 | 2.323268% |
Noise dominated data is calculated using 1-second bins in cleaned event files. If a bin has >2000 counts, and if more than 50% of those come from <1% of pixels, then it is considered to be noise-dominated and hence unusable.
| Quadrant | # 1 sec bins | Bins with >0 counts | Bins with >2000 counts | High rate bins dominated by noise | Noise dominated (total time) | Noise dominated (detector-on time) | Marked lightcurve |
|---|---|---|---|---|---|---|---|
| A | 131175 | 113589 | 0 | 0 | 0.00% | 0.00% | 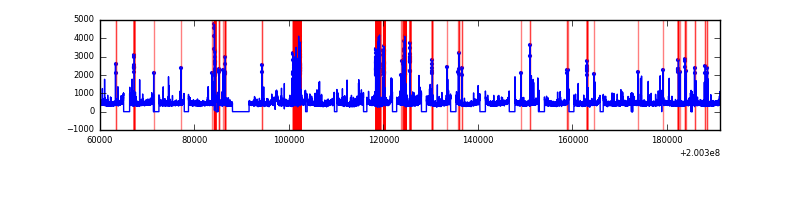 |
| B | 131175 | 113592 | 0 | 0 | 0.00% | 0.00% | 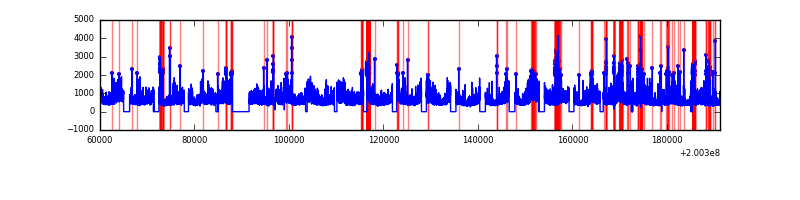 |
| C | 131175 | 113579 | 0 | 0 | 0.00% | 0.00% | 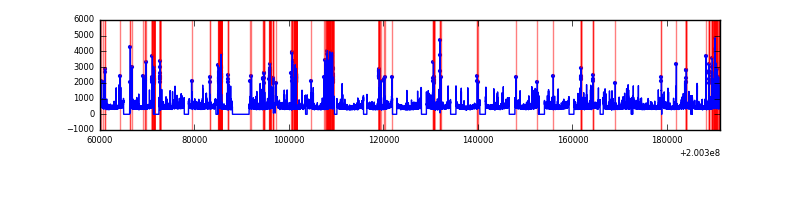 |
| D | 131175 | 113570 | 0 | 0 | 0.00% | 0.00% | 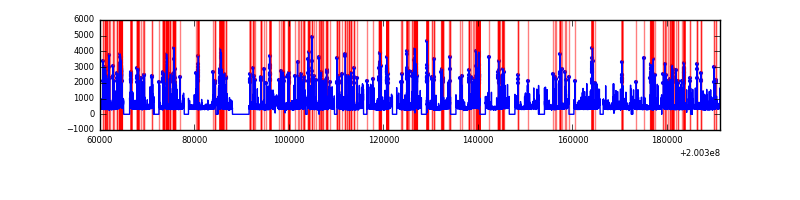 |
Top three noisy pixels from each quadrant. If the there are fewer than three noisy pixels in the level2.evt file, extra rows are filled as -1
| Pixel properties | Quadrant properties | ||||||
|---|---|---|---|---|---|---|---|
| Quadrant | DetID | PixID | Counts | Sigma | Mean | Median | Sigma |
| A | 14 | 188 | 5866 | 10.73 | 1574 | 1457 | 411.1 |
| A | 0 | 29 | 5845 | 10.67 | 1574 | 1457 | 411.1 |
| A | 7 | 110 | 5288 | 9.32 | 1574 | 1457 | 411.1 |
| B | 2 | 9 | 5021 | 11.25 | 1540 | 1452 | 317.1 |
| B | 12 | 226 | 4383 | 9.24 | 1540 | 1452 | 317.1 |
| B | 14 | 254 | 4031 | 8.13 | 1540 | 1452 | 317.1 |
| C | 1 | 80 | 4424 | 6.94 | 1595 | 1470 | 425.5 |
| C | 1 | 81 | 4417 | 6.93 | 1595 | 1470 | 425.5 |
| C | 12 | 241 | 4261 | 6.56 | 1595 | 1470 | 425.5 |
| D | 3 | 14 | 3904 | 6.43 | 1482 | 1341 | 398.4 |
| D | 4 | 160 | 3887 | 6.39 | 1482 | 1341 | 398.4 |
| D | 3 | 31 | 3843 | 6.28 | 1482 | 1341 | 398.4 |
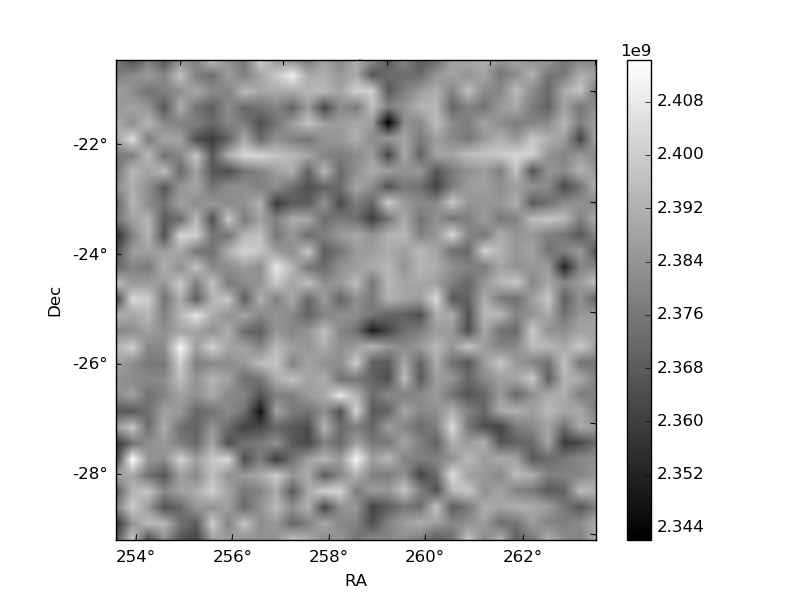
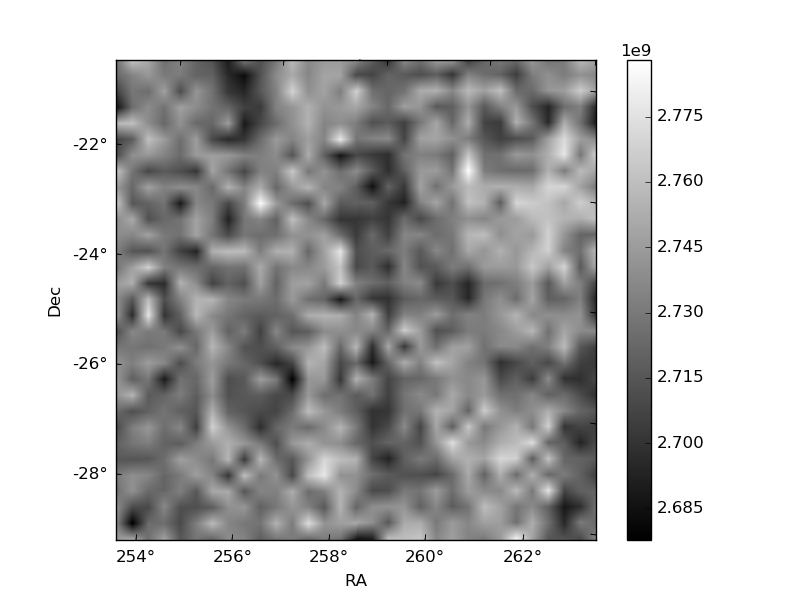
Histogram calculated using DETX and DETY for each event in the final _common_clean file
| Quadrant A | 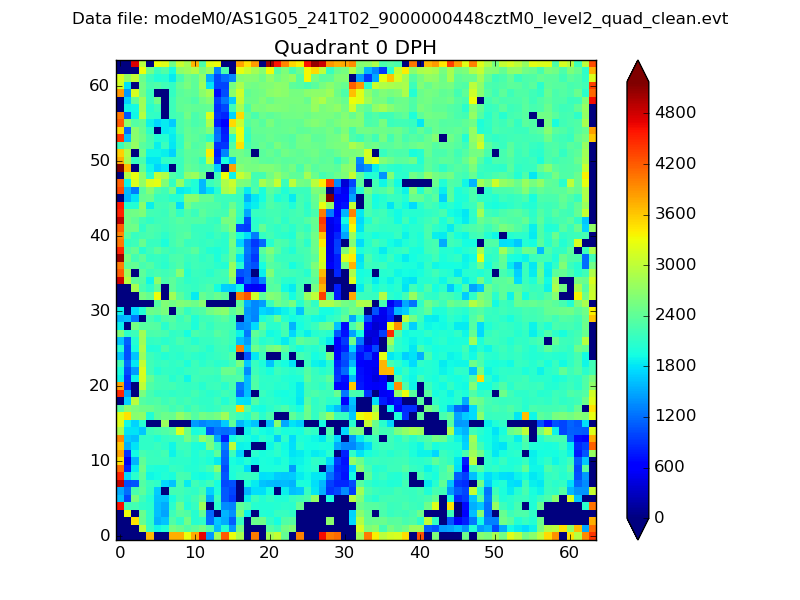 |
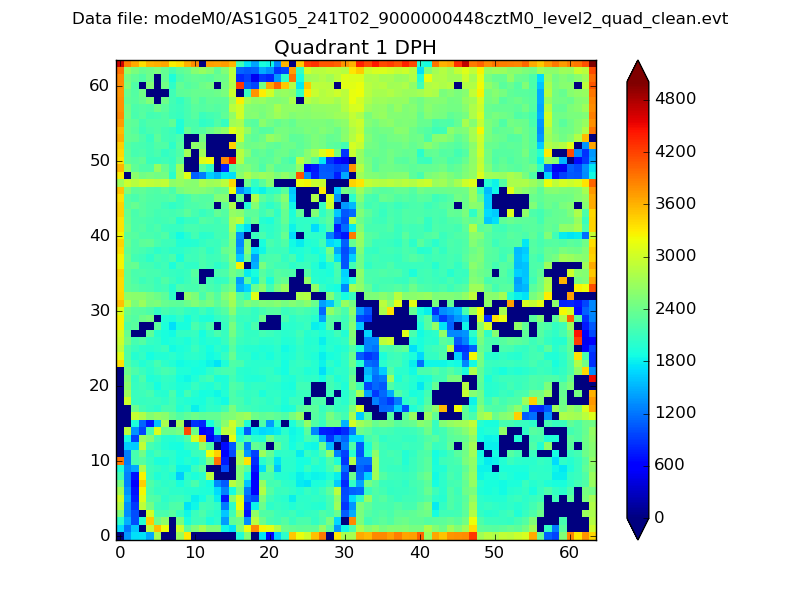 |
Quadrant B |
|---|---|---|---|
| Quadrant D | 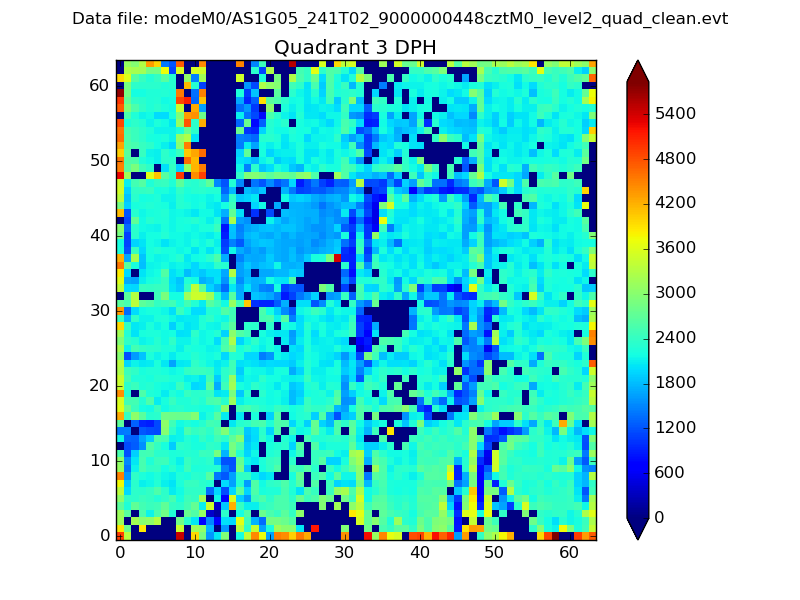 |
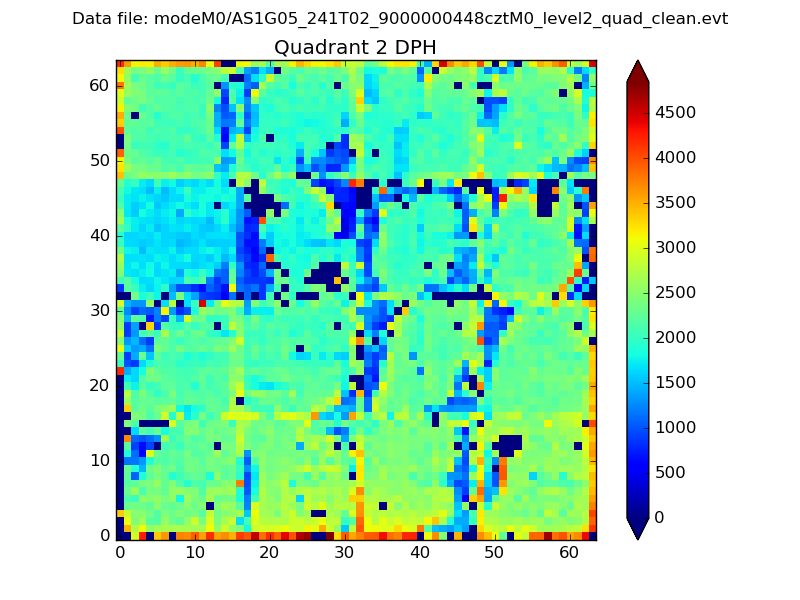 |
Quadrant C |
| Plot type | Count rate plots | Images |
|---|---|---|
| Comparison with Poisson distribution Blue bars denote a histogram of data divided into 1 sec bins. Red curve is a Poisson curve with rate = median count rate of data. |
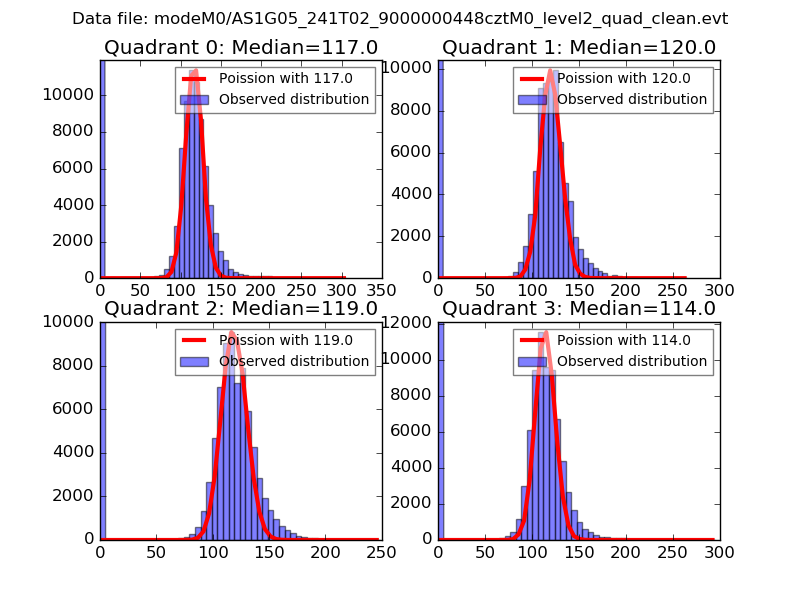 |
 |
| Quadrant-wise count rates Data is divided into 100 sec bins |
 |
|
| Module-wise count rates for Quadrant A Data is divided into 100 sec bins |
 |
 |
| Module-wise count rates for Quadrant B Data is divided into 100 sec bins |
 |
 |
| Module-wise count rates for Quadrant C Data is divided into 100 sec bins |
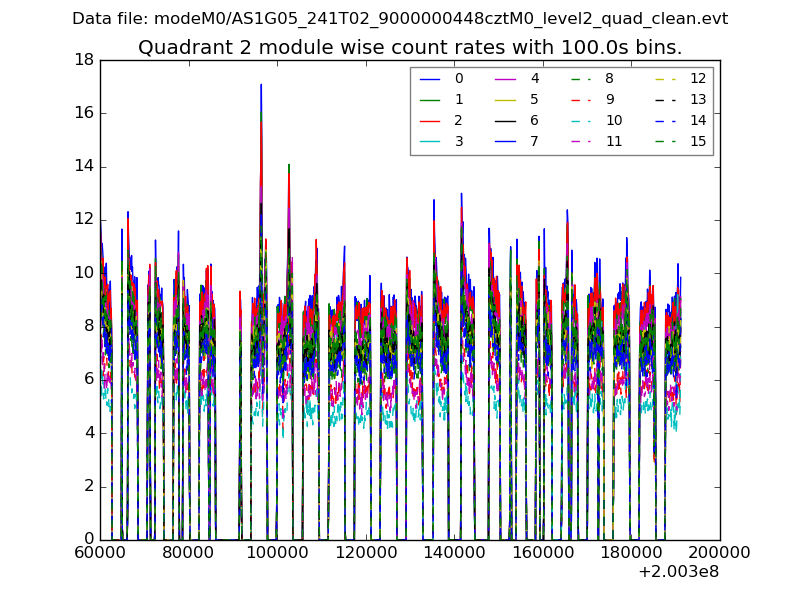 |
 |
| Module-wise count rates for Quadrant D Data is divided into 100 sec bins |
 |
 |
| Parameter | Plot |
|---|---|
| CZT HV Monitor | 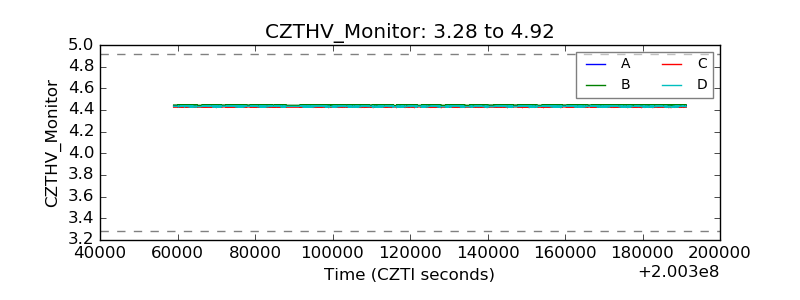 |
| D_VDD | 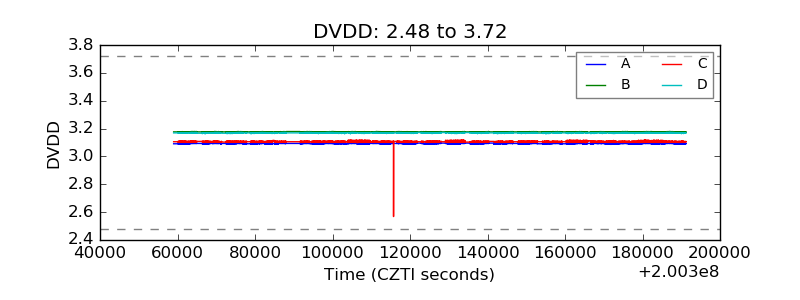 |
| Temperature 1 | 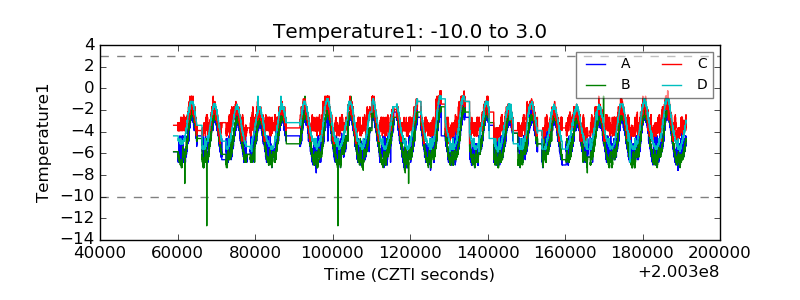 |
| Veto HV Monitor | 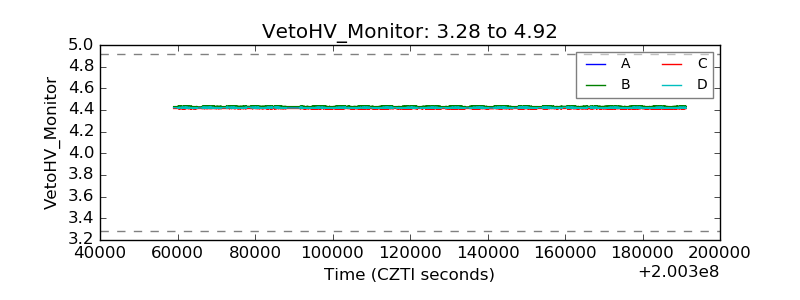 |
| Veto LLD | 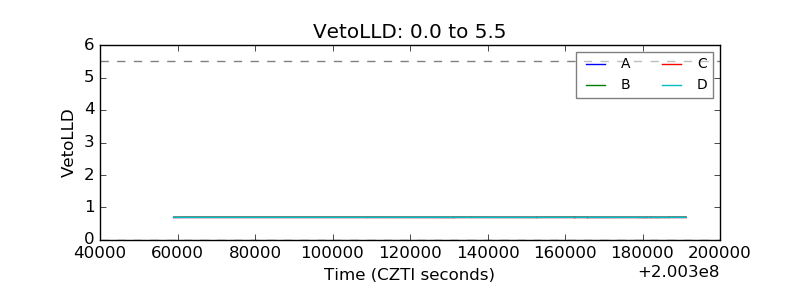 |
| Alpha Counter | 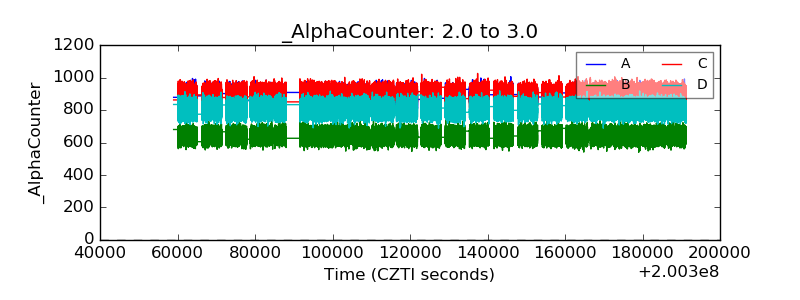 |
| _CPM_Rate | 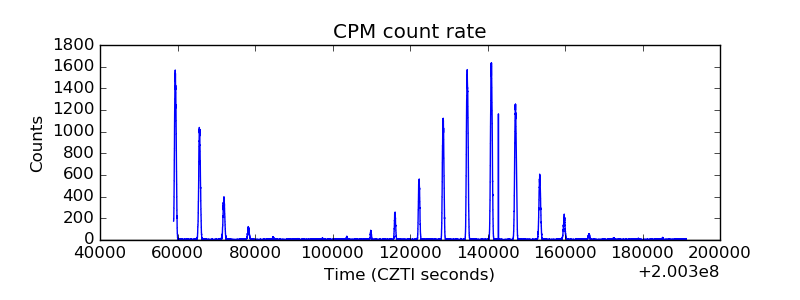 |
| CZT Counter | 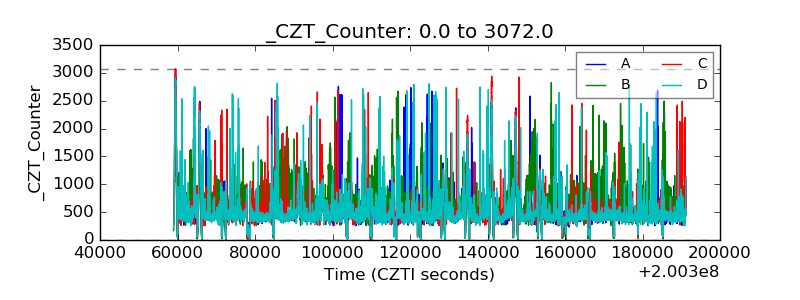 |
| +2.5 Volts monitor | 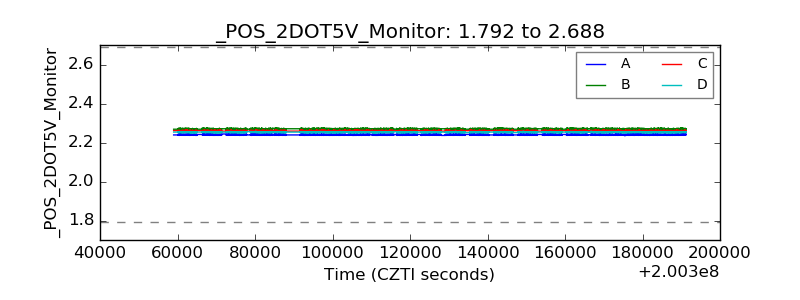 |
| +5 Volts monitor | 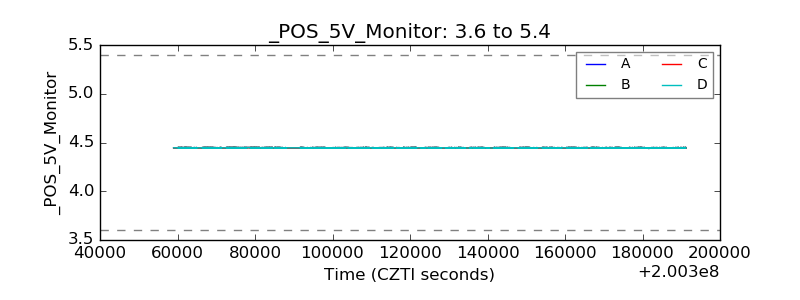 |
| _ROLL_ROT | 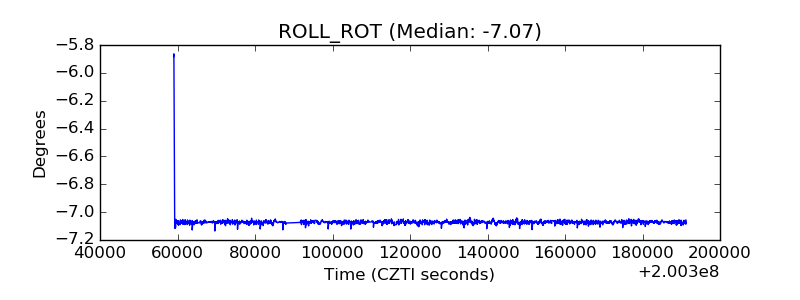 |
| _Roll_DEC | 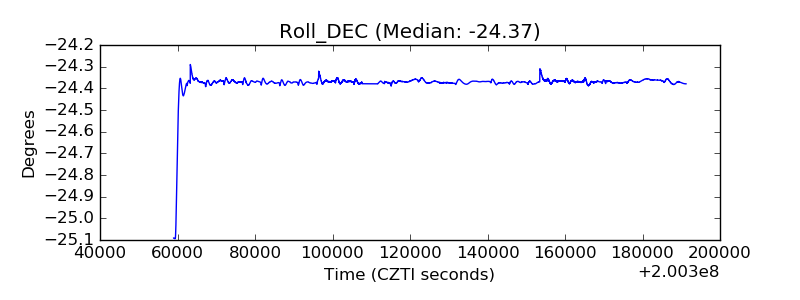 |
| _Roll_RA | 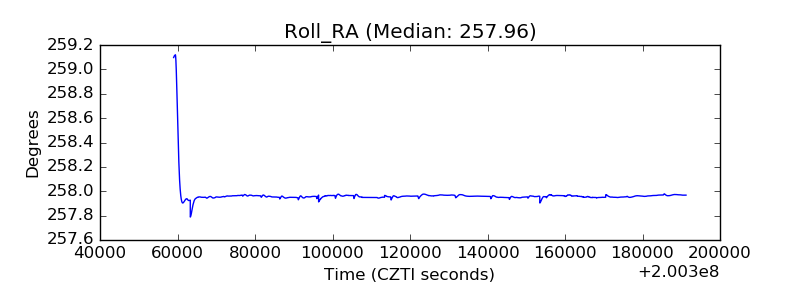 |
| Veto Counter | 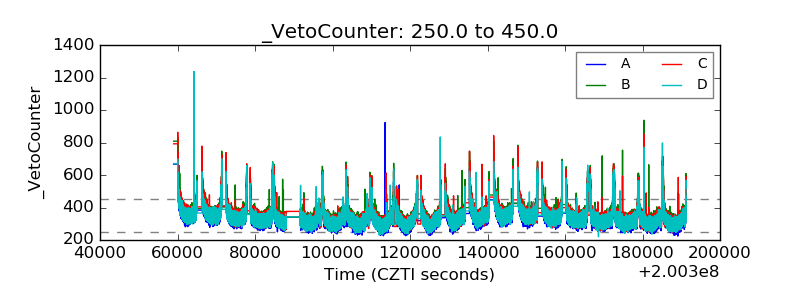 |