| Param | Original file | Final file |
|---|---|---|
| Filename | modeM0/AS1G05_241T02_9000000448_03301cztM0_level2.evt | modeM0/AS1G05_241T02_9000000448_03301cztM0_level2_quad_clean.evt |
| Size (bytes) | 452,301,120 | 73,992,960 |
| Size | 431.3 MB | 70.6 MB |
| Events in quadrant A | 2,968,059 | 451,481 |
| Events in quadrant B | 3,836,939 | 459,570 |
| Events in quadrant C | 3,164,531 | 454,919 |
| Events in quadrant D | 3,299,524 | 434,033 |
| Mode M0 | |||
|---|---|---|---|
| Quadrant | BADHDUFLAG | Total packets | Discarded packets |
| A | 0 | 13139 | 3 |
| B | 0 | 15520 | 2 |
| C | 0 | 13690 | 2 |
| D | 0 | 14322 | 2 |
| Mode SS | |||
|---|---|---|---|
| Quadrant | BADHDUFLAG | Total packets | Discarded packets |
| A | 0 | 130 | 0 |
| B | 0 | 130 | 0 |
| C | 0 | 130 | 0 |
| D | 0 | 130 | 0 |
| Mode M9 | |||
|---|---|---|---|
| Quadrant | BADHDUFLAG | Total packets | Discarded packets |
| A | 0 | 11 | 0 |
| B | 0 | 11 | 0 |
| C | 0 | 11 | 0 |
| D | 0 | 11 | 0 |
| Quadrant | Total seconds | Saturated seconds | Saturation percentage |
|---|---|---|---|
| A | 6305 | 88 | 1.395718% |
| B | 6305 | 118 | 1.871531% |
| C | 6305 | 104 | 1.649485% |
| D | 6305 | 105 | 1.665345% |
Noise dominated data is calculated using 1-second bins in cleaned event files. If a bin has >2000 counts, and if more than 50% of those come from <1% of pixels, then it is considered to be noise-dominated and hence unusable.
| Quadrant | # 1 sec bins | Bins with >0 counts | Bins with >2000 counts | High rate bins dominated by noise | Noise dominated (total time) | Noise dominated (detector-on time) | Marked lightcurve |
|---|---|---|---|---|---|---|---|
| A | 7430 | 6307 | 10 | 10 | 0.13% | 0.16% | 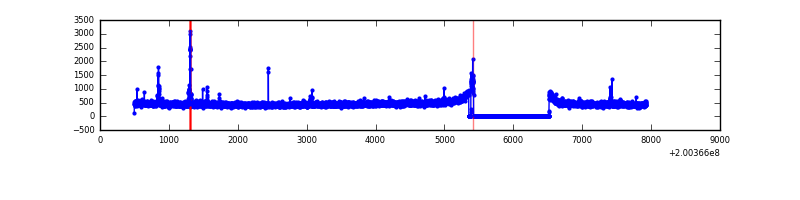 |
| B | 7430 | 6307 | 28 | 28 | 0.38% | 0.44% | 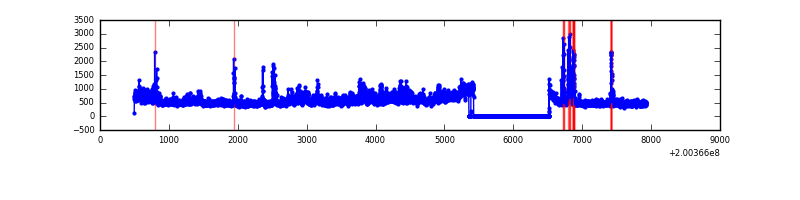 |
| C | 7430 | 6307 | 39 | 39 | 0.52% | 0.62% |  |
| D | 7430 | 6307 | 46 | 46 | 0.62% | 0.73% | 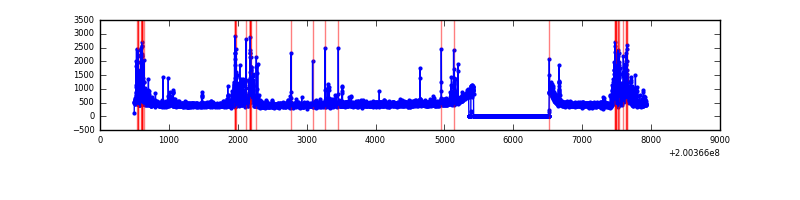 |
Top three noisy pixels from each quadrant. If the there are fewer than three noisy pixels in the level2.evt file, extra rows are filled as -1
| Pixel properties | Quadrant properties | ||||||
|---|---|---|---|---|---|---|---|
| Quadrant | DetID | PixID | Counts | Sigma | Mean | Median | Sigma |
| A | 0 | 118 | 42290 | 272.36 | 747 | 731 | 152.6 |
| A | 7 | 16 | 26049 | 165.92 | 747 | 731 | 152.6 |
| A | 0 | 226 | 13413 | 83.11 | 747 | 731 | 152.6 |
| B | 15 | 204 | 635104 | 4345.57 | 757 | 741 | 146.0 |
| B | 2 | 249 | 206921 | 1412.39 | 757 | 741 | 146.0 |
| B | 14 | 167 | 70116 | 475.24 | 757 | 741 | 146.0 |
| C | 1 | 192 | 150022 | 873.38 | 730 | 735 | 170.9 |
| C | 14 | 223 | 133852 | 778.78 | 730 | 735 | 170.9 |
| C | 8 | 208 | 9773 | 52.87 | 730 | 735 | 170.9 |
| D | 13 | 223 | 230710 | 1298.74 | 731 | 710 | 177.1 |
| D | 12 | 1 | 214770 | 1208.73 | 731 | 710 | 177.1 |
| D | 2 | 31 | 36816 | 203.88 | 731 | 710 | 177.1 |
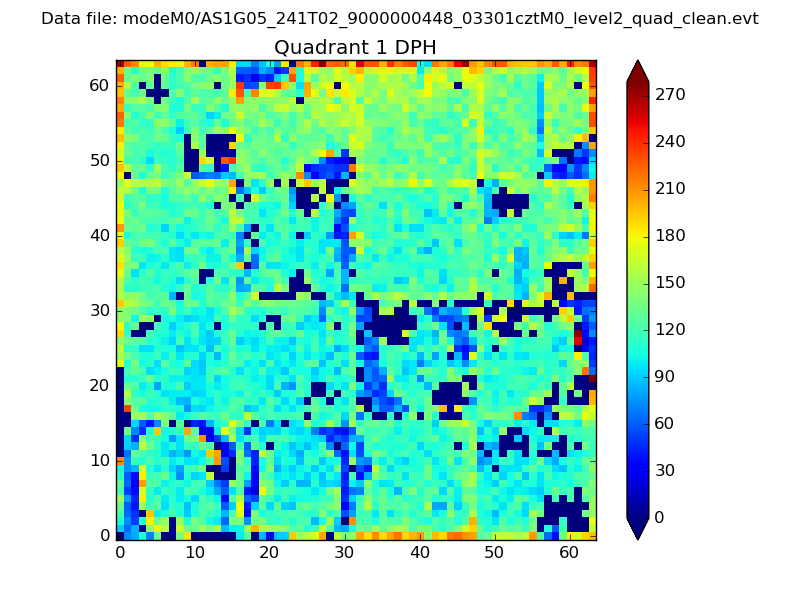
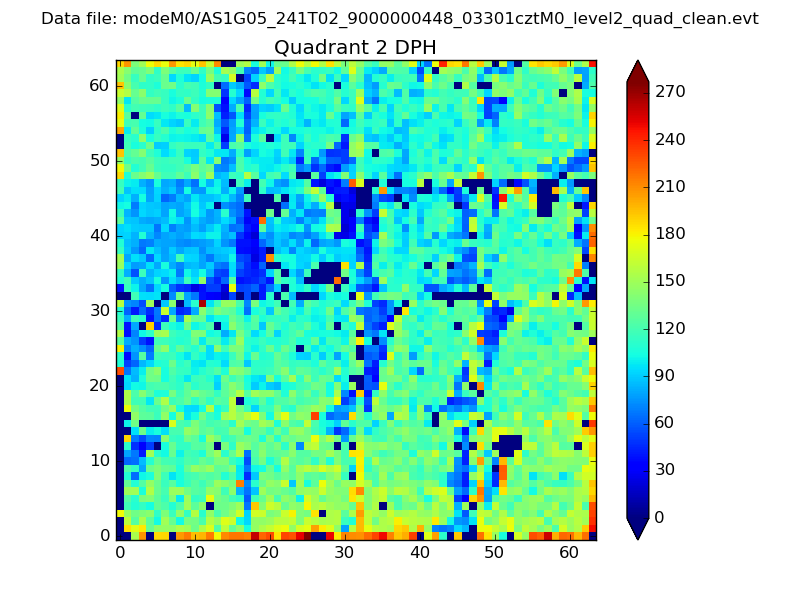
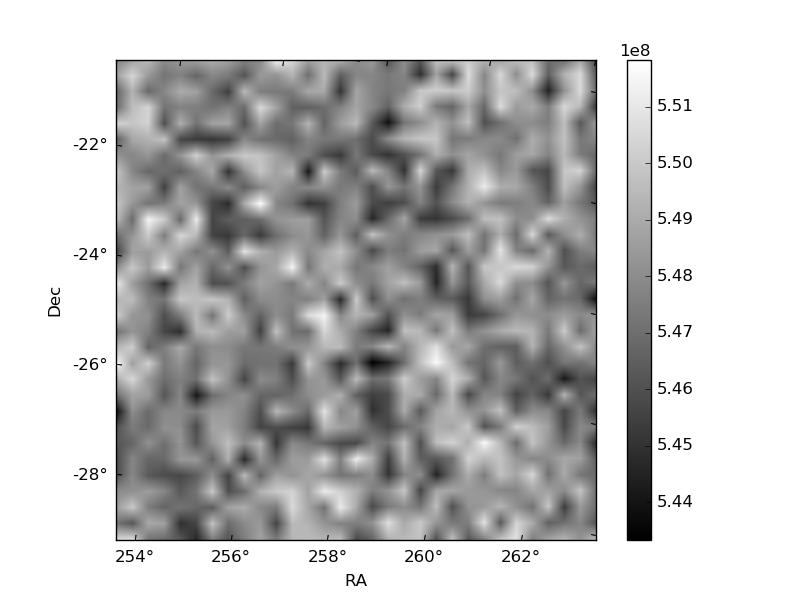
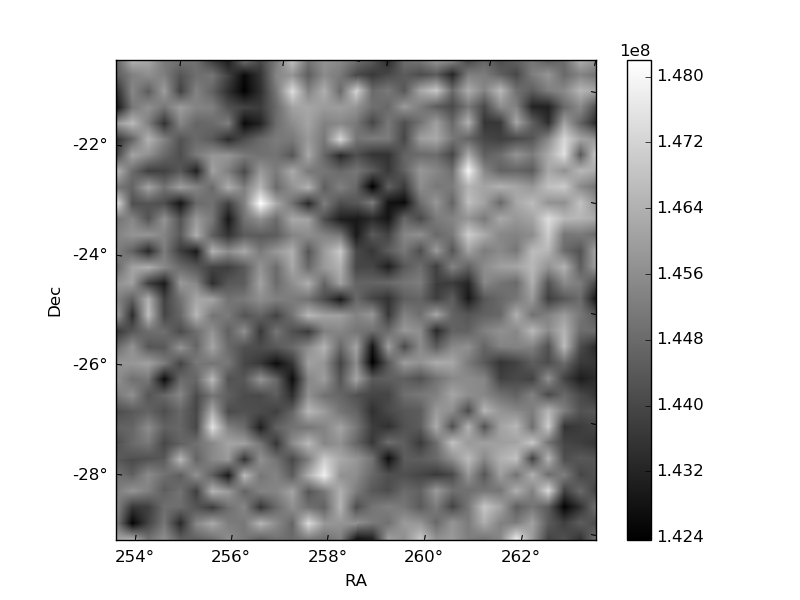
Histogram calculated using DETX and DETY for each event in the final _common_clean file
| Quadrant A | 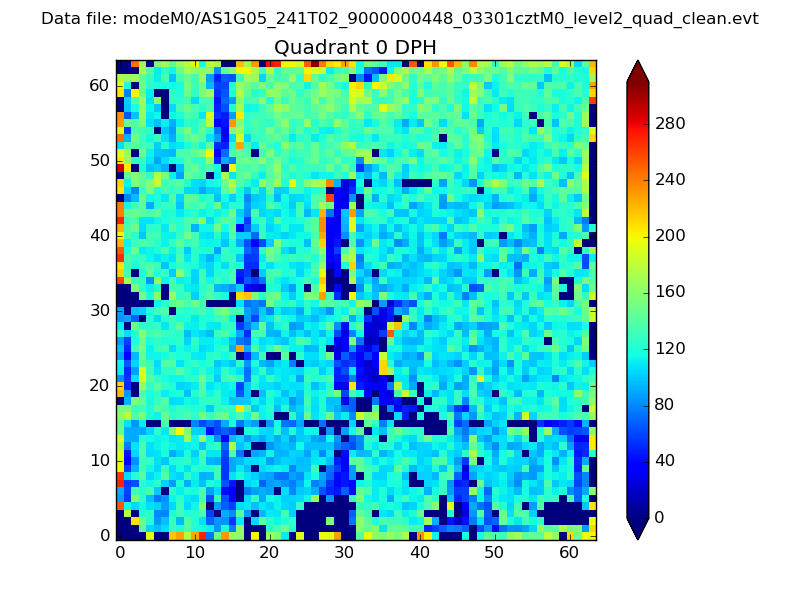 |
 |
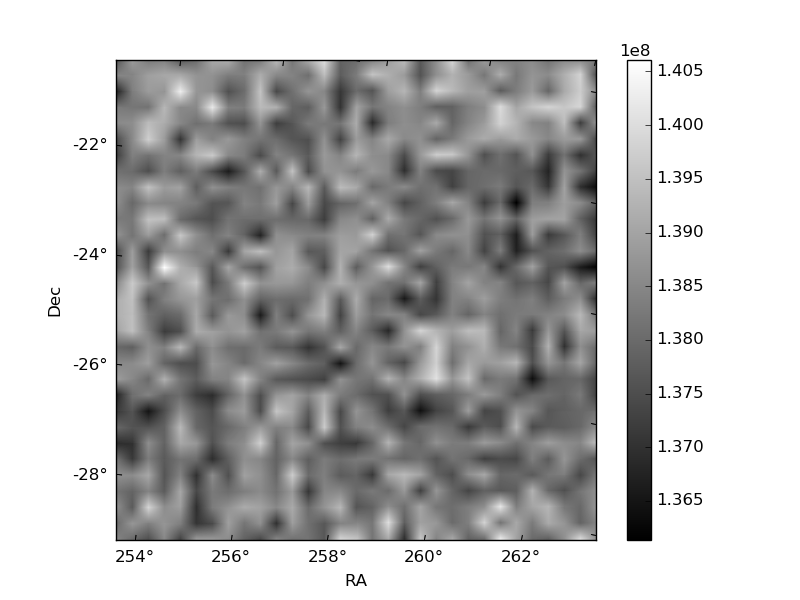
Quadrant B |
|---|---|---|---|
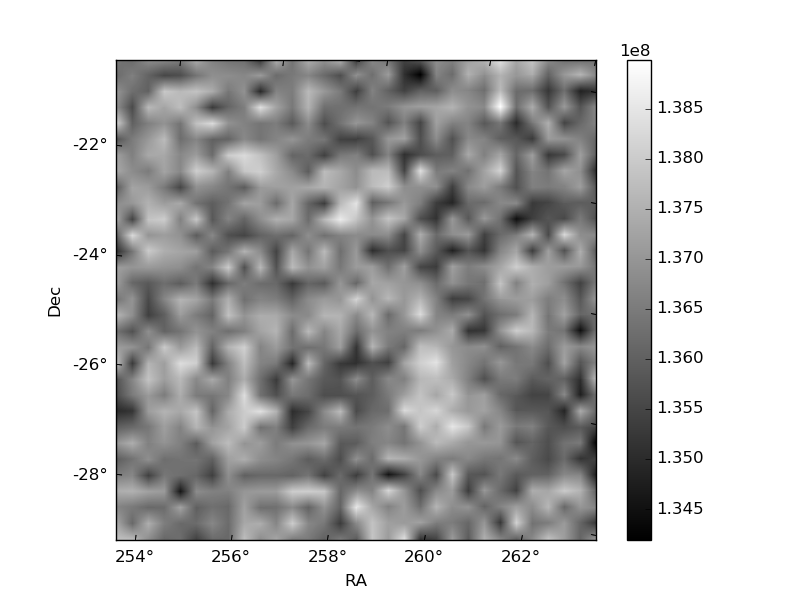
| Quadrant D | 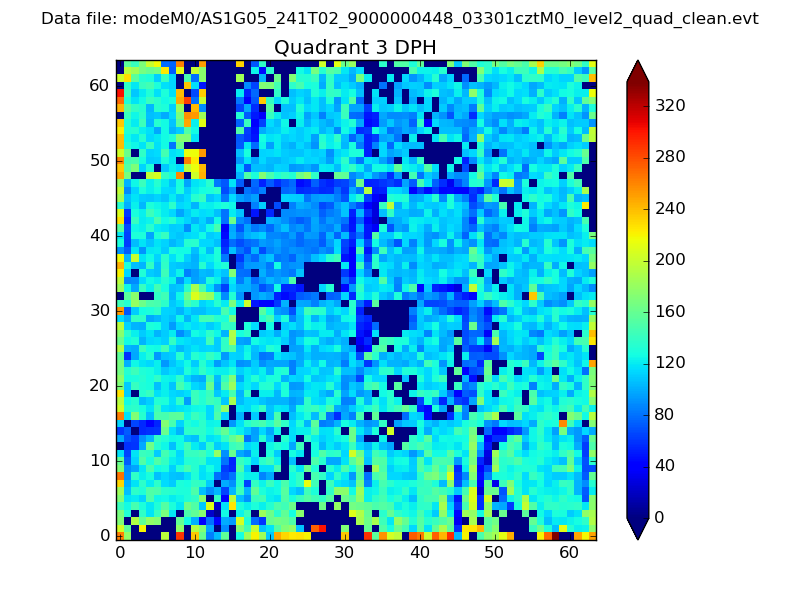 |
 |
Quadrant C |
| Plot type | Count rate plots | Images |
|---|---|---|
| Comparison with Poisson distribution Blue bars denote a histogram of data divided into 1 sec bins. Red curve is a Poisson curve with rate = median count rate of data. |
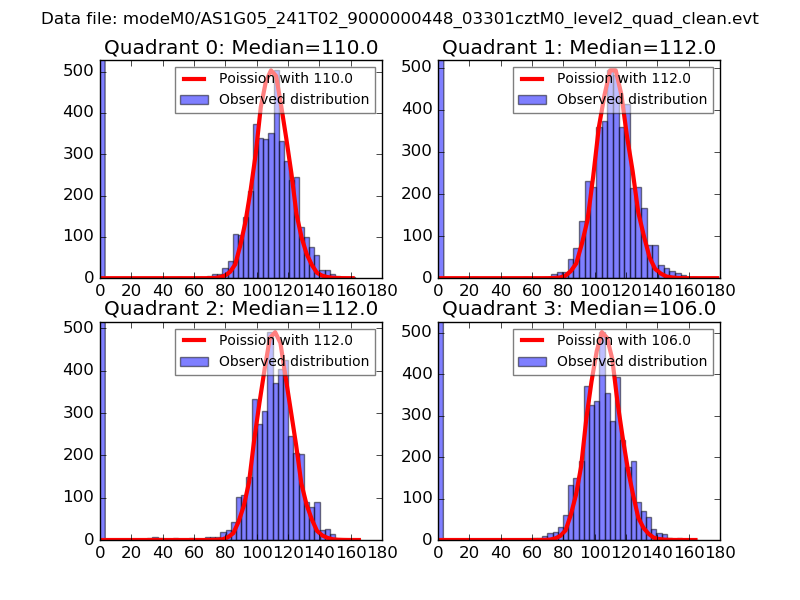 |
 |
| Quadrant-wise count rates Data is divided into 100 sec bins |
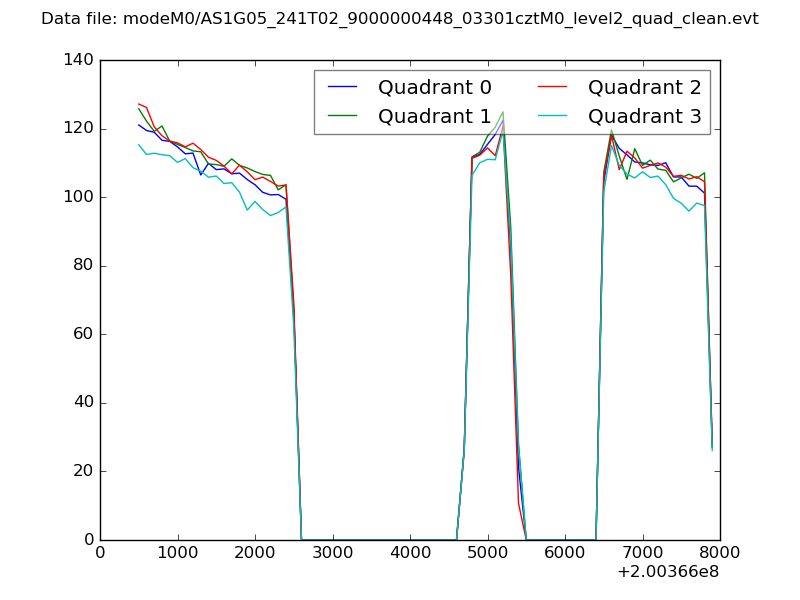 |
|
| Module-wise count rates for Quadrant A Data is divided into 100 sec bins |
 |
 |
| Module-wise count rates for Quadrant B Data is divided into 100 sec bins |
 |
 |
| Module-wise count rates for Quadrant C Data is divided into 100 sec bins |
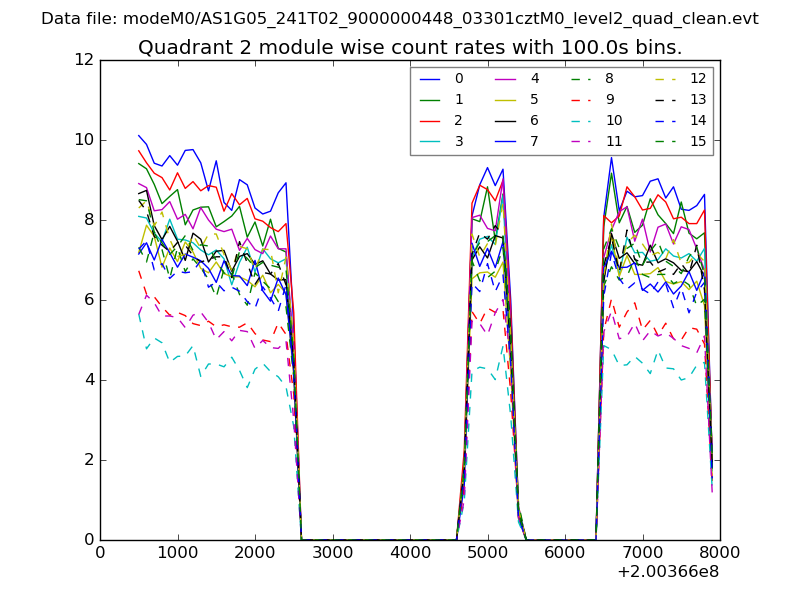 |
 |
| Module-wise count rates for Quadrant D Data is divided into 100 sec bins |
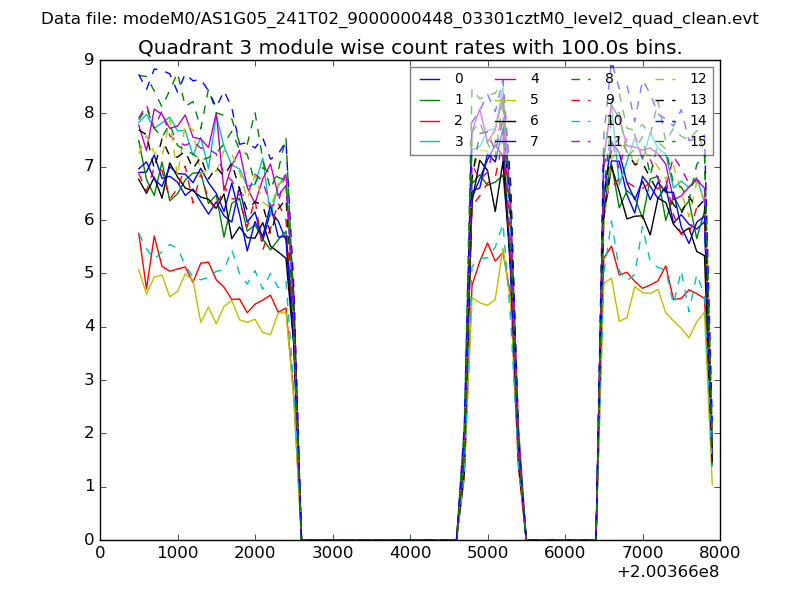 |
 |
| Parameter | Plot |
|---|---|
| CZT HV Monitor | 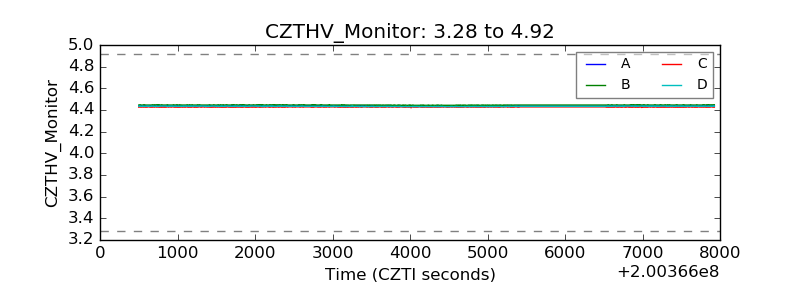 |
| D_VDD | 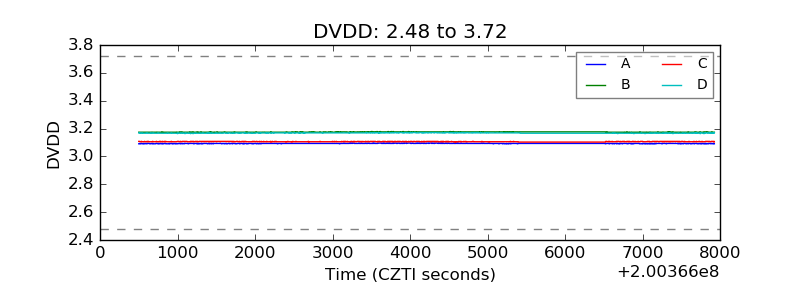 |
| Temperature 1 | 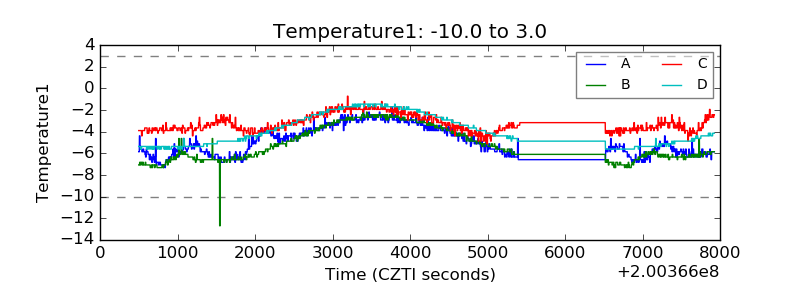 |
| Veto HV Monitor | 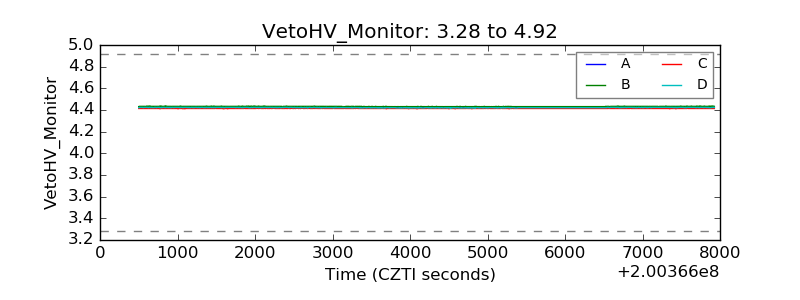 |
| Veto LLD | 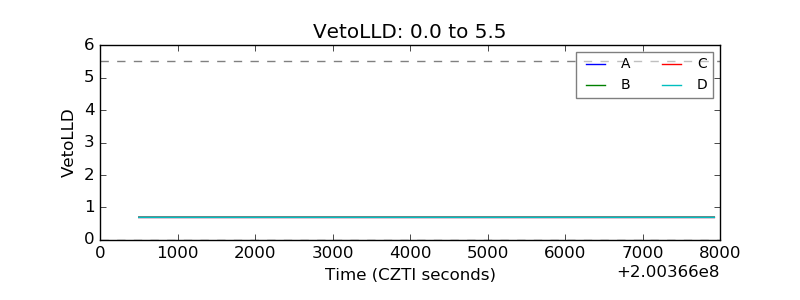 |
| Alpha Counter | 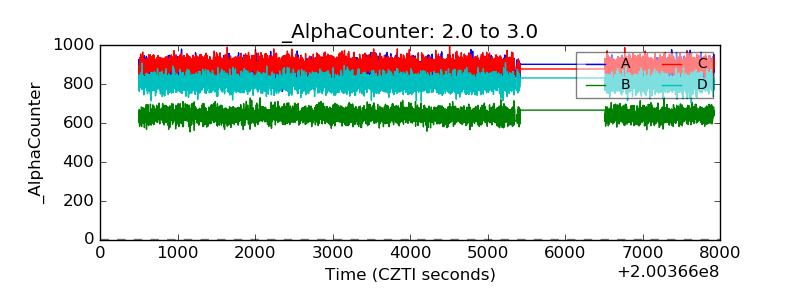 |
| _CPM_Rate | 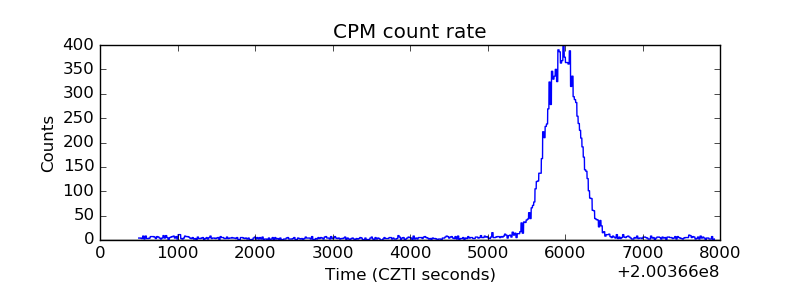 |
| CZT Counter | 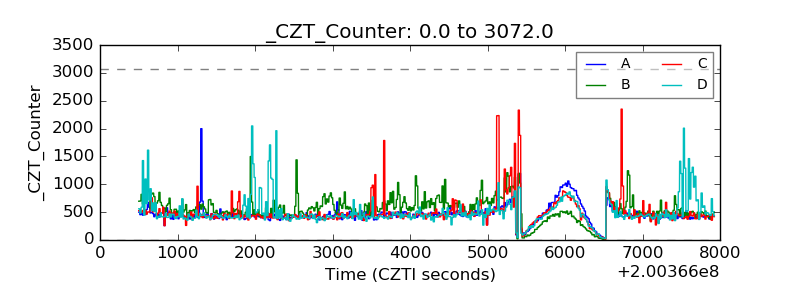 |
| +2.5 Volts monitor |  |
| +5 Volts monitor |  |
| _ROLL_ROT | 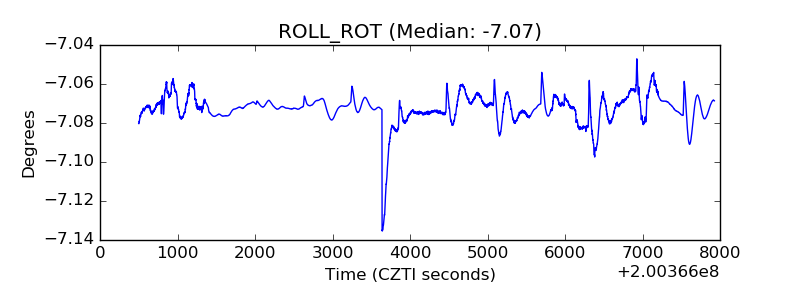 |
| _Roll_DEC | 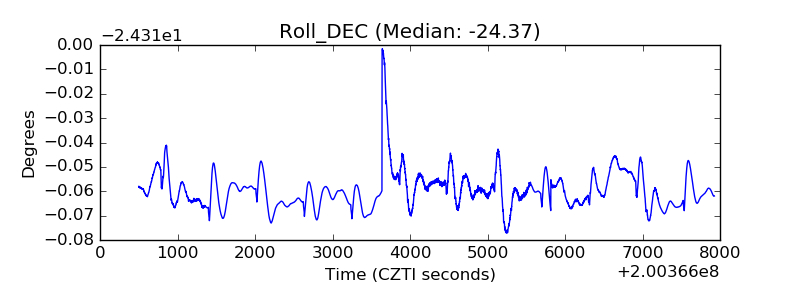 |
| _Roll_RA | 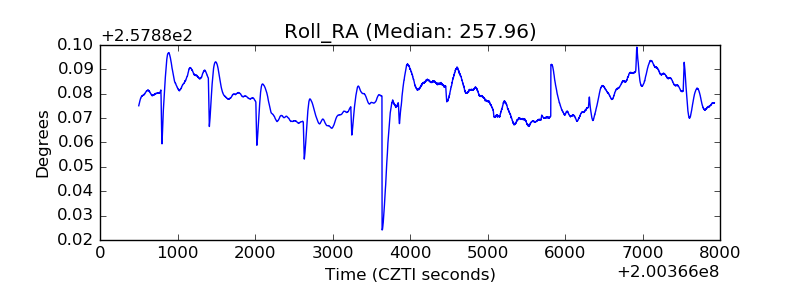 |
| Veto Counter | 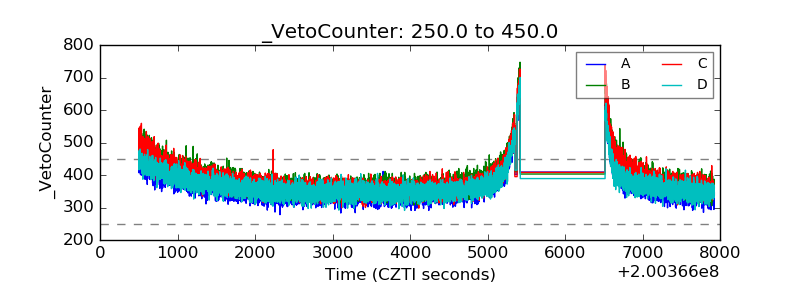 |