| Param | Original file | Final file |
|---|---|---|
| Filename | modeM0/AS1G05_241T02_9000000448_03302cztM0_level2.evt | modeM0/AS1G05_241T02_9000000448_03302cztM0_level2_quad_clean.evt |
| Size (bytes) | 493,027,200 | 80,807,040 |
| Size | 470.2 MB | 77.1 MB |
| Events in quadrant A | 3,144,385 | 494,971 |
| Events in quadrant B | 4,252,447 | 501,939 |
| Events in quadrant C | 3,377,657 | 500,870 |
| Events in quadrant D | 3,692,531 | 472,618 |
| Mode M0 | |||
|---|---|---|---|
| Quadrant | BADHDUFLAG | Total packets | Discarded packets |
| A | 0 | 14117 | 3 |
| B | 0 | 17092 | 2 |
| C | 0 | 14713 | 2 |
| D | 0 | 15903 | 2 |
| Mode SS | |||
|---|---|---|---|
| Quadrant | BADHDUFLAG | Total packets | Discarded packets |
| A | 0 | 138 | 0 |
| B | 0 | 138 | 0 |
| C | 0 | 138 | 0 |
| D | 0 | 138 | 0 |
| Mode M9 | |||
|---|---|---|---|
| Quadrant | BADHDUFLAG | Total packets | Discarded packets |
| A | 0 | 13 | 0 |
| B | 0 | 13 | 0 |
| C | 0 | 13 | 0 |
| D | 0 | 14 | 0 |
| Quadrant | Total seconds | Saturated seconds | Saturation percentage |
|---|---|---|---|
| A | 6838 | 114 | 1.667154% |
| B | 6838 | 145 | 2.120503% |
| C | 6838 | 80 | 1.169933% |
| D | 6838 | 222 | 3.246563% |
Noise dominated data is calculated using 1-second bins in cleaned event files. If a bin has >2000 counts, and if more than 50% of those come from <1% of pixels, then it is considered to be noise-dominated and hence unusable.
| Quadrant | # 1 sec bins | Bins with >0 counts | Bins with >2000 counts | High rate bins dominated by noise | Noise dominated (total time) | Noise dominated (detector-on time) | Marked lightcurve |
|---|---|---|---|---|---|---|---|
| A | 7743 | 6839 | 1 | 1 | 0.01% | 0.01% | 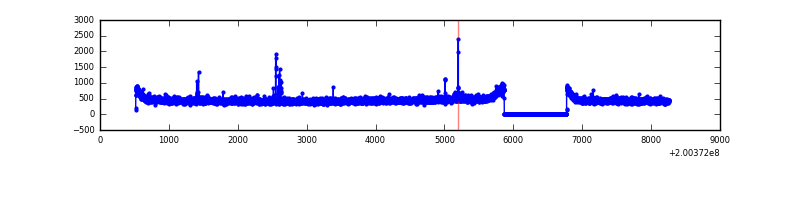 |
| B | 7743 | 6839 | 29 | 29 | 0.37% | 0.42% | 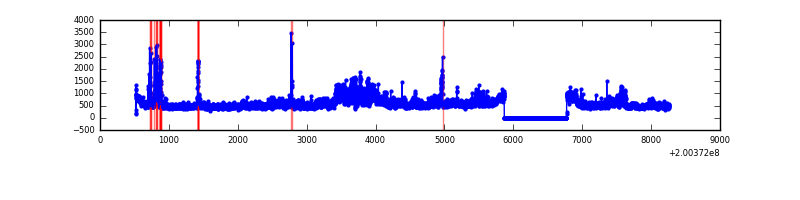 |
| C | 7743 | 6839 | 9 | 9 | 0.12% | 0.13% | 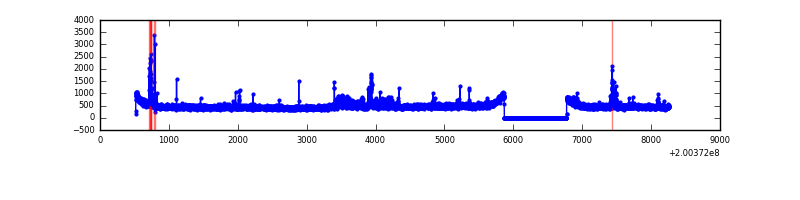 |
| D | 7743 | 6839 | 114 | 114 | 1.47% | 1.67% | 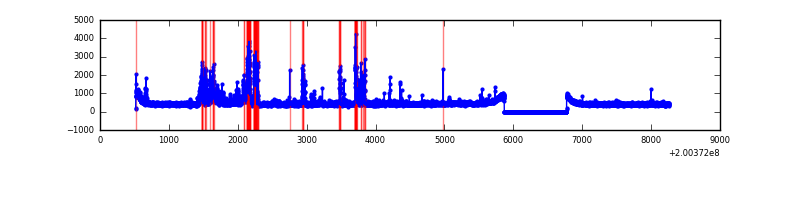 |
Top three noisy pixels from each quadrant. If the there are fewer than three noisy pixels in the level2.evt file, extra rows are filled as -1
| Pixel properties | Quadrant properties | ||||||
|---|---|---|---|---|---|---|---|
| Quadrant | DetID | PixID | Counts | Sigma | Mean | Median | Sigma |
| A | 0 | 50 | 31211 | 181.94 | 804 | 784 | 167.2 |
| A | 7 | 16 | 13099 | 73.64 | 804 | 784 | 167.2 |
| A | 0 | 226 | 8741 | 47.58 | 804 | 784 | 167.2 |
| B | 15 | 204 | 947426 | 6010.11 | 812 | 793 | 157.5 |
| B | 2 | 249 | 144268 | 910.91 | 812 | 793 | 157.5 |
| B | 14 | 167 | 13955 | 83.56 | 812 | 793 | 157.5 |
| C | 1 | 192 | 192725 | 1027.34 | 790 | 792 | 186.8 |
| C | 14 | 223 | 47644 | 250.78 | 790 | 792 | 186.8 |
| C | 12 | 4 | 36201 | 189.53 | 790 | 792 | 186.8 |
| D | 13 | 223 | 622295 | 3265.2 | 781 | 757 | 190.4 |
| D | 10 | 34 | 42410 | 218.82 | 781 | 757 | 190.4 |
| D | 14 | 34 | 25417 | 129.55 | 781 | 757 | 190.4 |
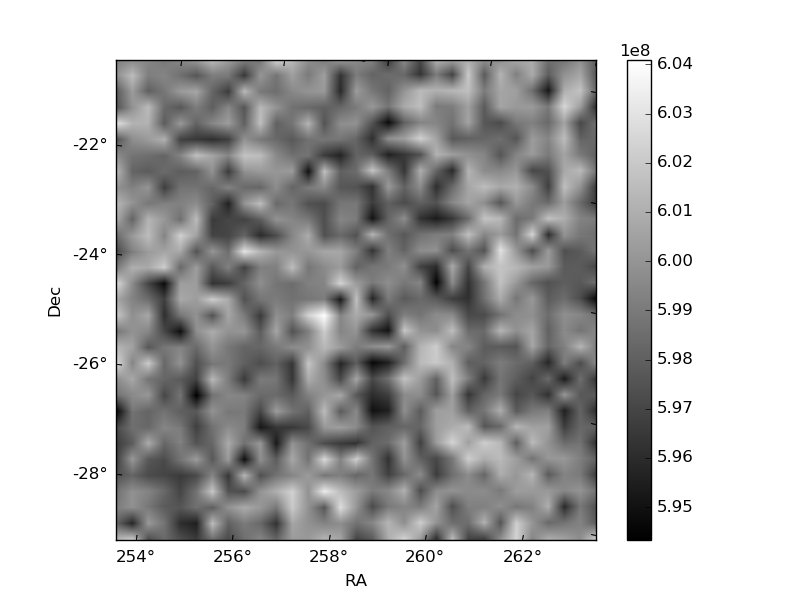
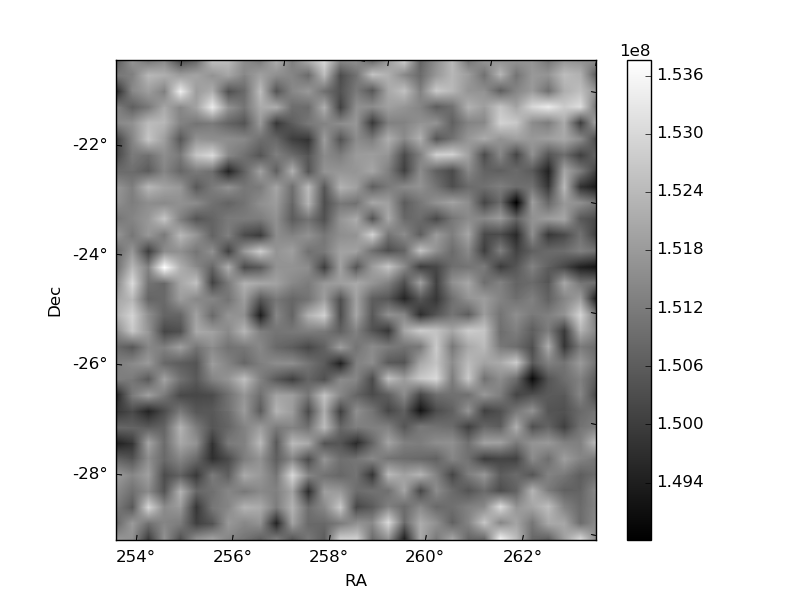
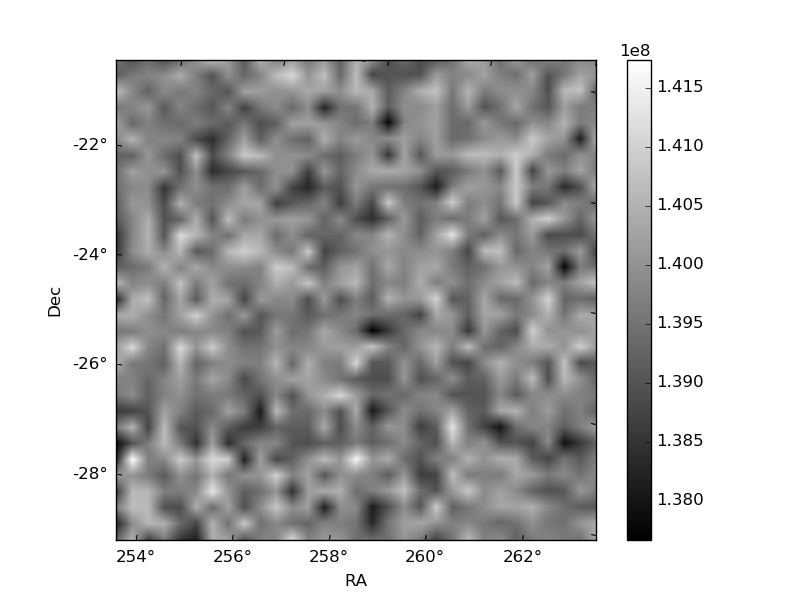
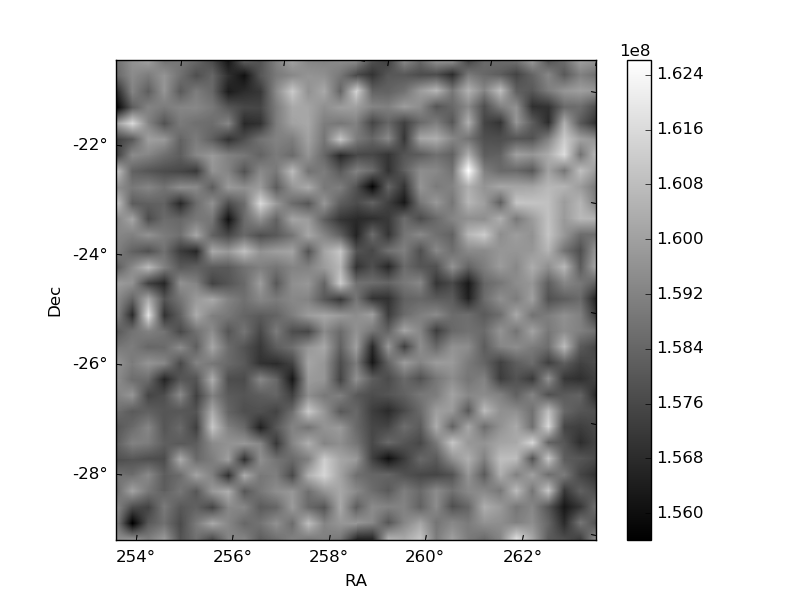
Histogram calculated using DETX and DETY for each event in the final _common_clean file
| Quadrant A | 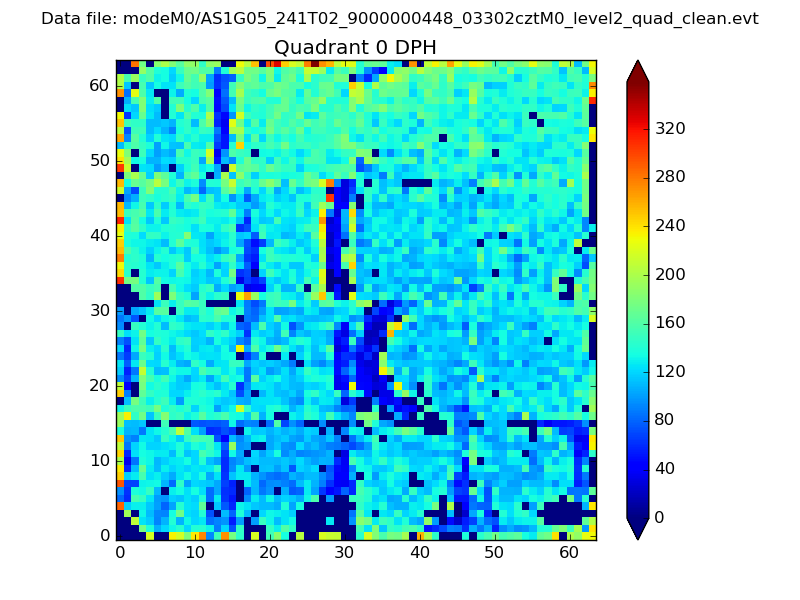 |
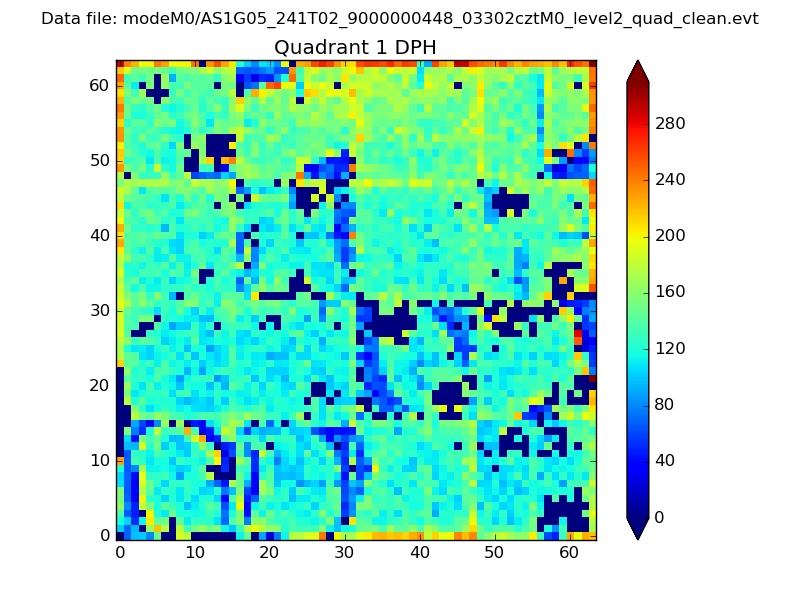 |
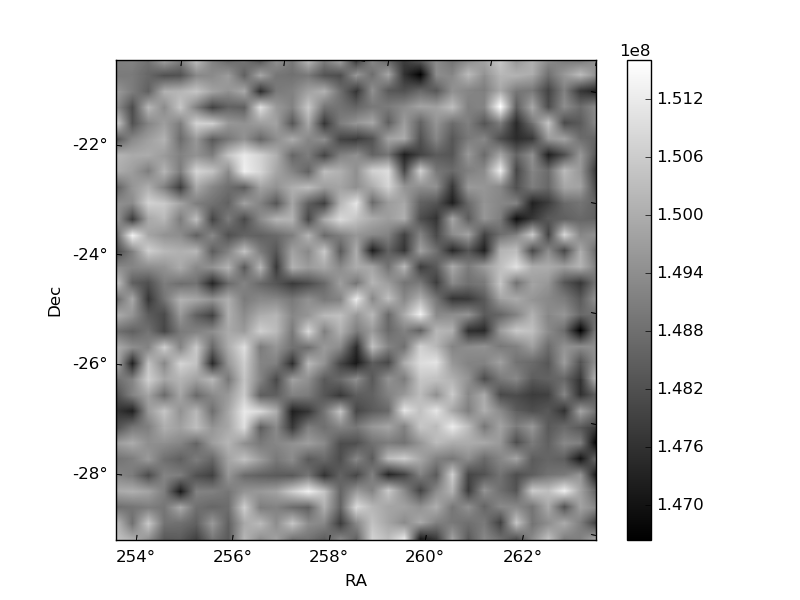
Quadrant B |
|---|---|---|---|
| Quadrant D | 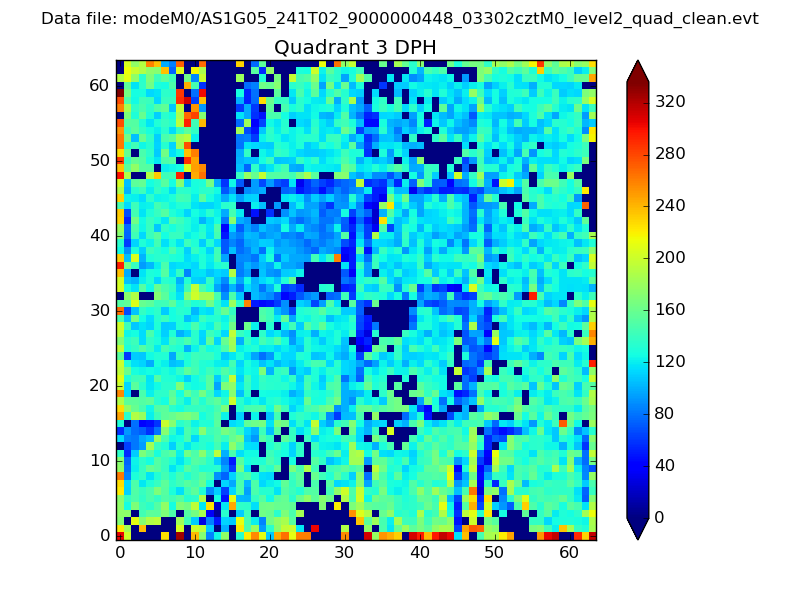 |
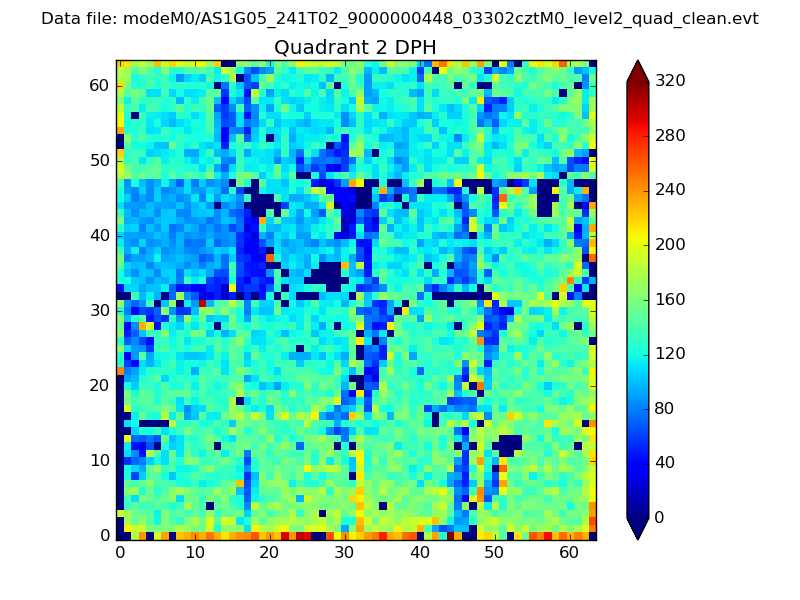 |
Quadrant C |
| Plot type | Count rate plots | Images |
|---|---|---|
| Comparison with Poisson distribution Blue bars denote a histogram of data divided into 1 sec bins. Red curve is a Poisson curve with rate = median count rate of data. |
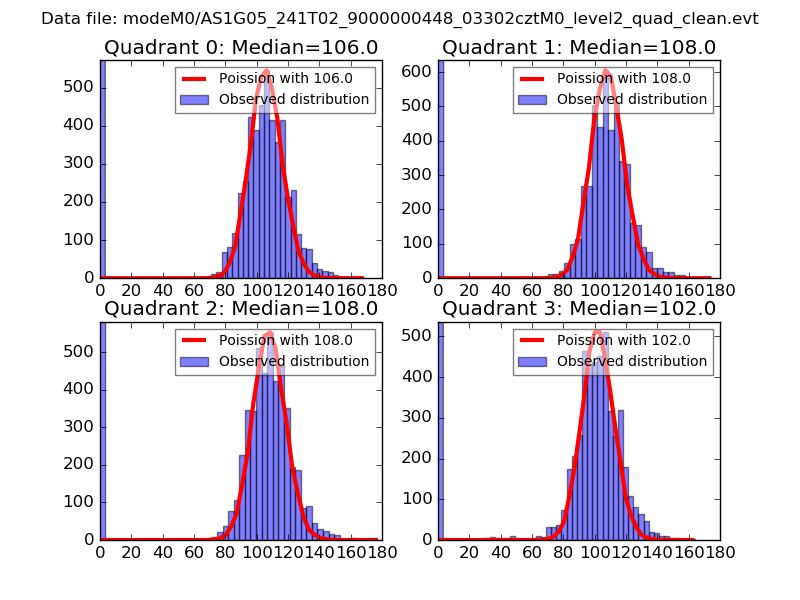 |
 |
| Quadrant-wise count rates Data is divided into 100 sec bins |
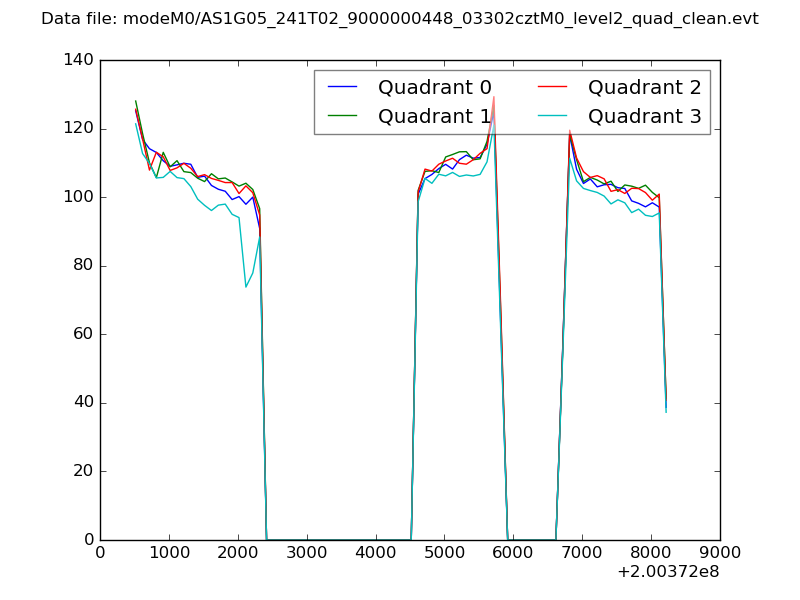 |
|
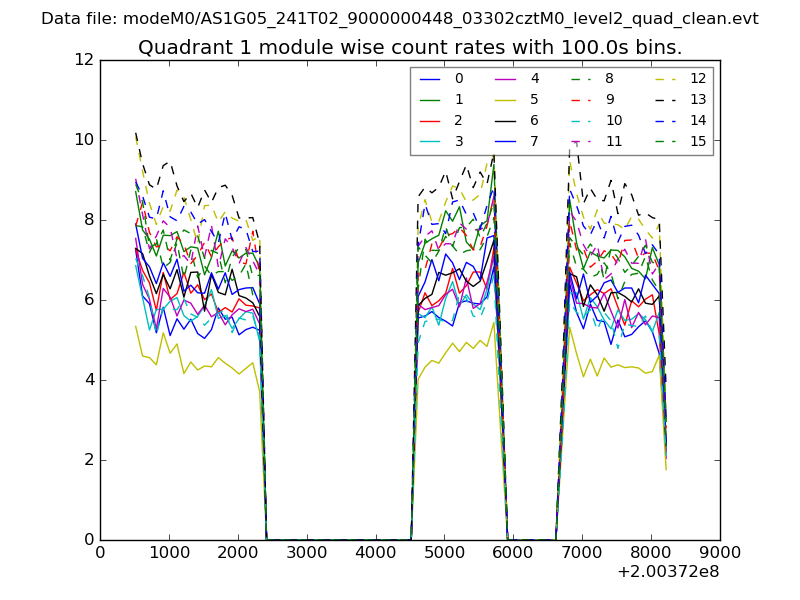
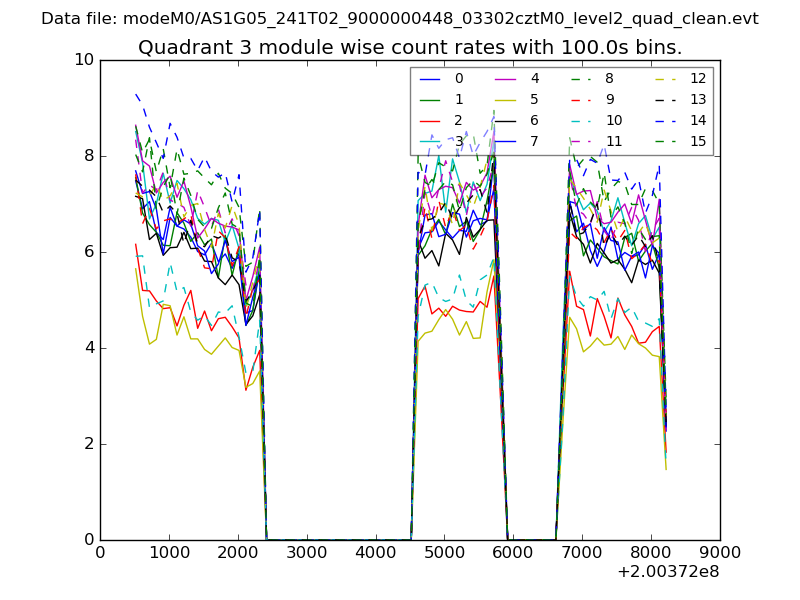
| Module-wise count rates for Quadrant A Data is divided into 100 sec bins |
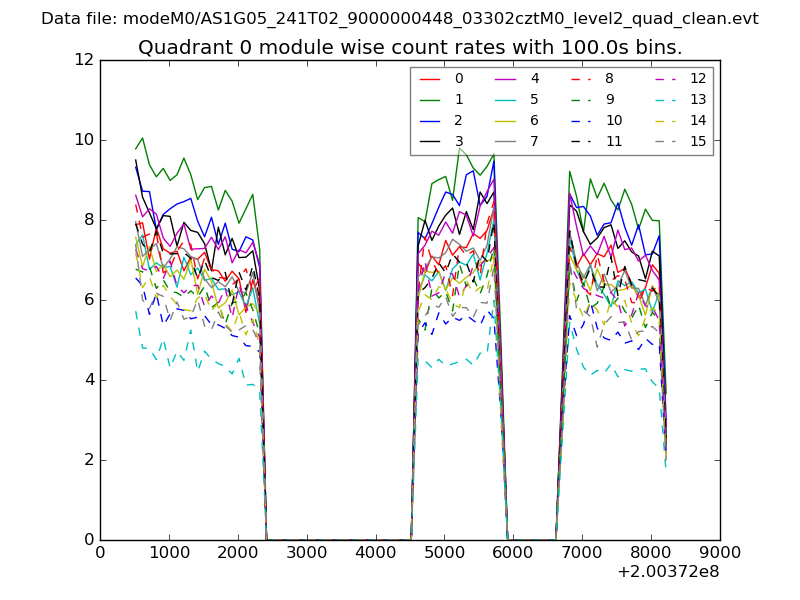 |
 |
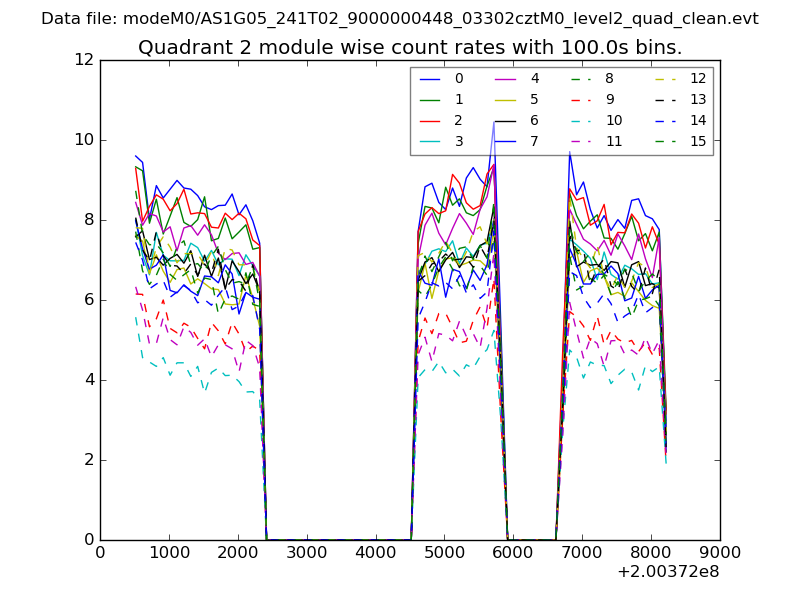
| Module-wise count rates for Quadrant B Data is divided into 100 sec bins |
 |
 |
| Module-wise count rates for Quadrant C Data is divided into 100 sec bins |
 |
 |
| Module-wise count rates for Quadrant D Data is divided into 100 sec bins |
 |
 |
| Parameter | Plot |
|---|---|
| CZT HV Monitor | 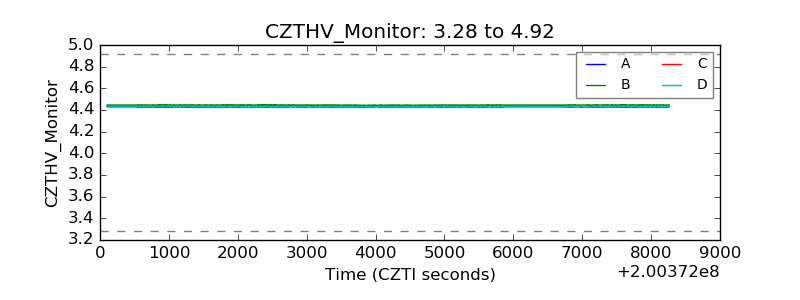 |
| D_VDD | 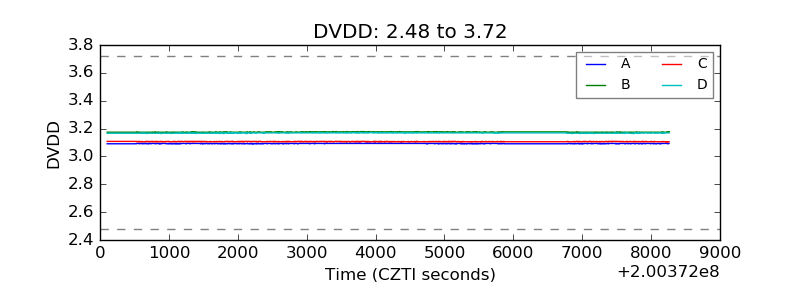 |
| Temperature 1 | 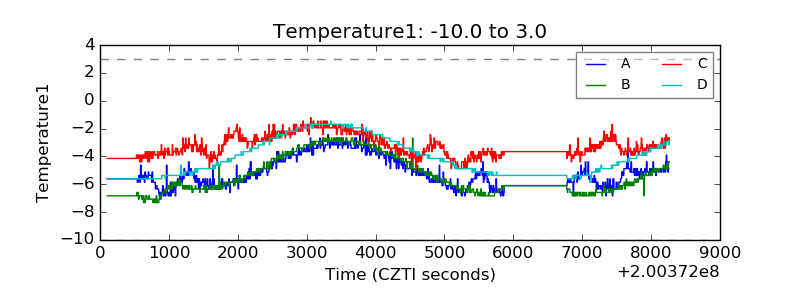 |
| Veto HV Monitor | 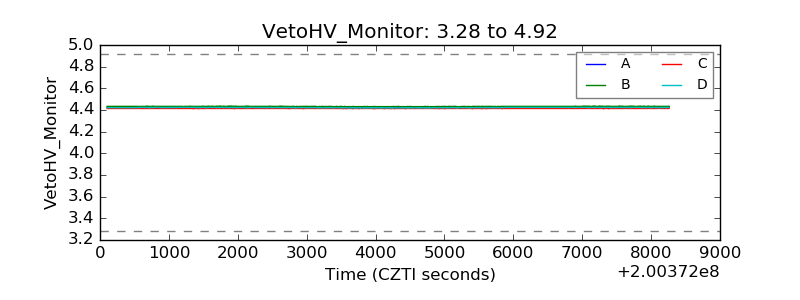 |
| Veto LLD | 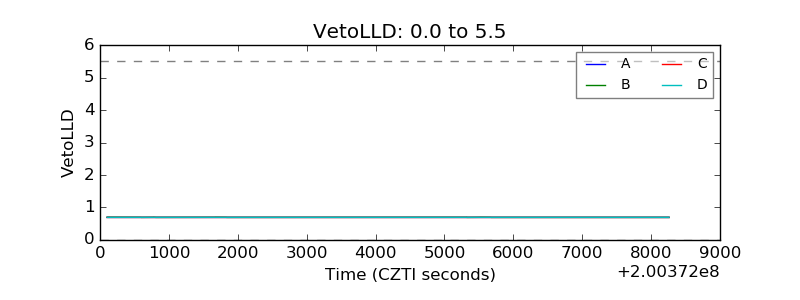 |
| Alpha Counter | 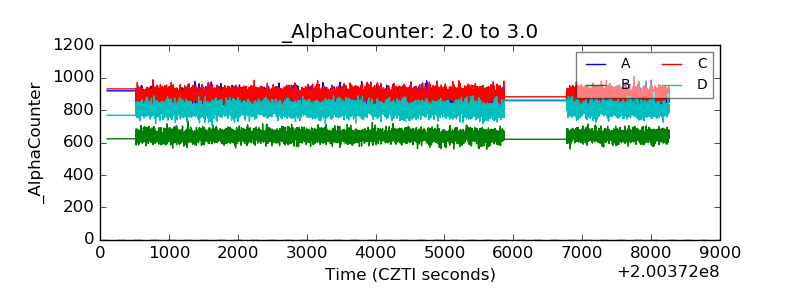 |
| _CPM_Rate | 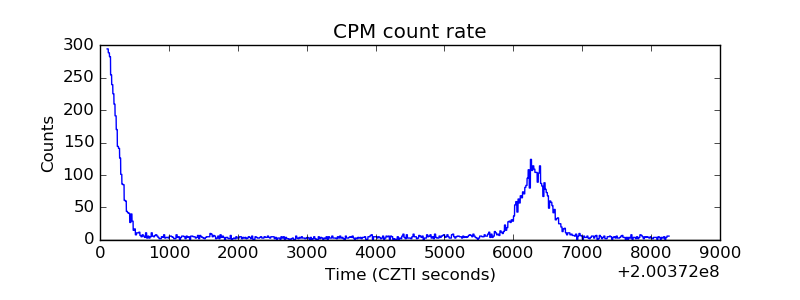 |
| CZT Counter | 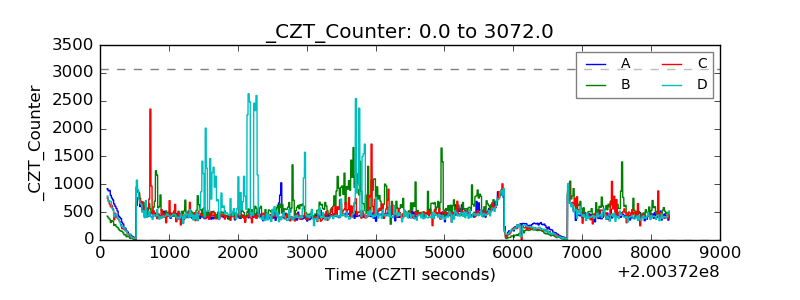 |
| +2.5 Volts monitor |  |
| +5 Volts monitor |  |
| _ROLL_ROT | 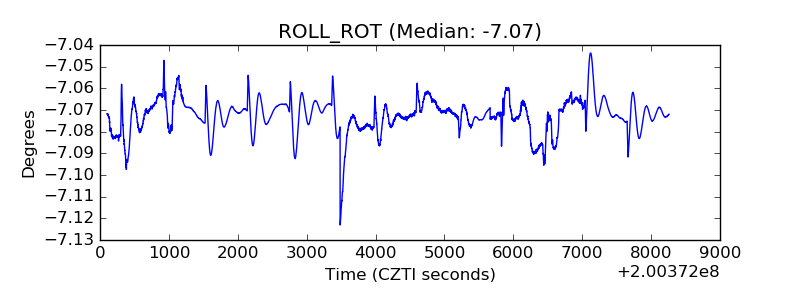 |
| _Roll_DEC | 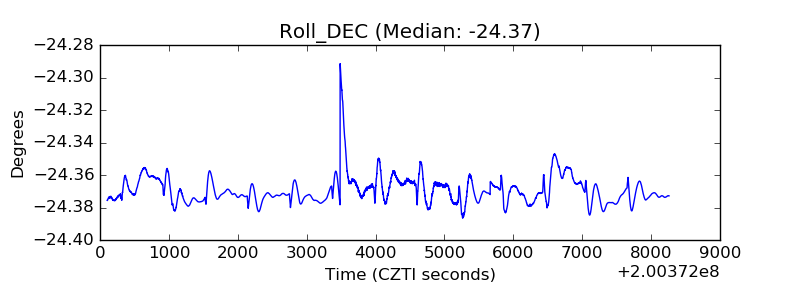 |
| _Roll_RA | 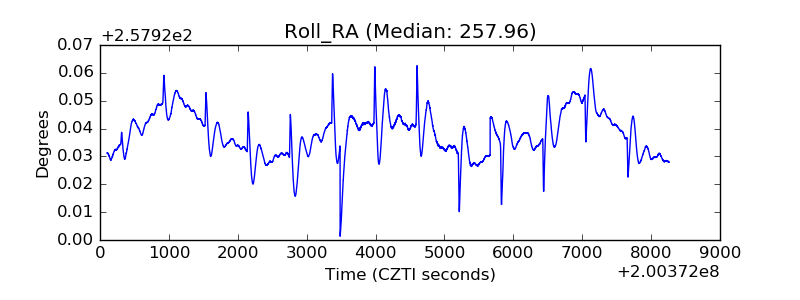 |
| Veto Counter | 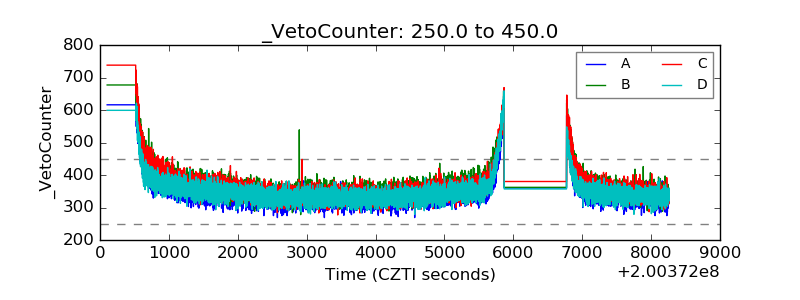 |