| Param | Original file | Final file |
|---|---|---|
| Filename | modeM0/AS1G05_241T02_9000000448_03304cztM0_level2.evt | modeM0/AS1G05_241T02_9000000448_03304cztM0_level2_quad_clean.evt |
| Size (bytes) | 617,728,320 | 78,992,640 |
| Size | 589.1 MB | 75.3 MB |
| Events in quadrant A | 3,604,025 | 470,148 |
| Events in quadrant B | 6,636,943 | 465,272 |
| Events in quadrant C | 3,940,395 | 469,159 |
| Events in quadrant D | 4,004,349 | 450,798 |
| Mode M0 | |||
|---|---|---|---|
| Quadrant | BADHDUFLAG | Total packets | Discarded packets |
| A | 0 | 16183 | 1 |
| B | 0 | 25267 | 0 |
| C | 0 | 17137 | 0 |
| D | 0 | 17597 | 0 |
| Mode SS | |||
|---|---|---|---|
| Quadrant | BADHDUFLAG | Total packets | Discarded packets |
| A | 0 | 154 | 0 |
| B | 0 | 154 | 0 |
| C | 0 | 154 | 0 |
| D | 0 | 154 | 0 |
| Quadrant | Total seconds | Saturated seconds | Saturation percentage |
|---|---|---|---|
| A | 7709 | 259 | 3.359709% |
| B | 7709 | 368 | 4.773641% |
| C | 7709 | 198 | 2.568427% |
| D | 7709 | 258 | 3.346738% |
Noise dominated data is calculated using 1-second bins in cleaned event files. If a bin has >2000 counts, and if more than 50% of those come from <1% of pixels, then it is considered to be noise-dominated and hence unusable.
| Quadrant | # 1 sec bins | Bins with >0 counts | Bins with >2000 counts | High rate bins dominated by noise | Noise dominated (total time) | Noise dominated (detector-on time) | Marked lightcurve |
|---|---|---|---|---|---|---|---|
| A | 7709 | 7709 | 7 | 7 | 0.09% | 0.09% | 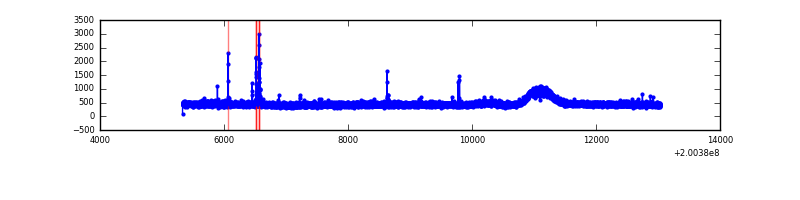 |
| B | 7709 | 7709 | 24 | 24 | 0.31% | 0.31% | 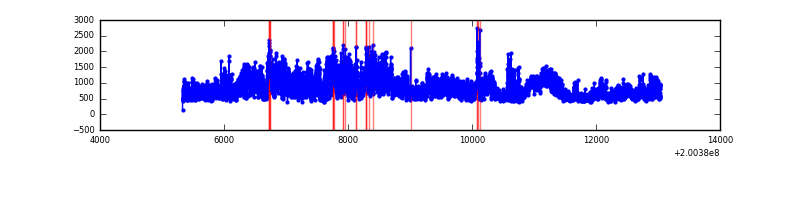 |
| C | 7709 | 7709 | 55 | 55 | 0.71% | 0.71% | 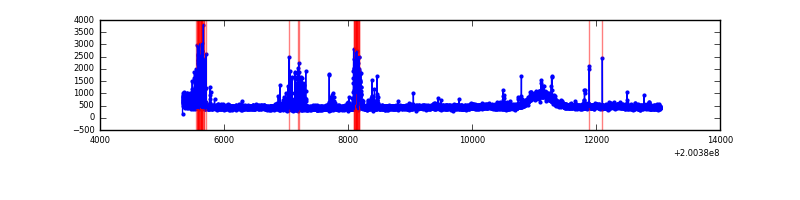 |
| D | 7709 | 7709 | 114 | 114 | 1.48% | 1.48% | 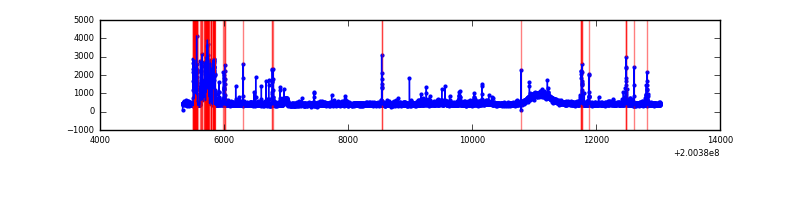 |
Top three noisy pixels from each quadrant. If the there are fewer than three noisy pixels in the level2.evt file, extra rows are filled as -1
| Pixel properties | Quadrant properties | ||||||
|---|---|---|---|---|---|---|---|
| Quadrant | DetID | PixID | Counts | Sigma | Mean | Median | Sigma |
| A | 0 | 118 | 41615 | 212.34 | 920 | 897 | 191.8 |
| A | 0 | 226 | 13062 | 63.44 | 920 | 897 | 191.8 |
| A | 12 | 194 | 9816 | 46.51 | 920 | 897 | 191.8 |
| B | 15 | 204 | 2711329 | 14882.53 | 920 | 897 | 182.1 |
| B | 14 | 167 | 173980 | 950.37 | 920 | 897 | 182.1 |
| B | 2 | 249 | 111450 | 607.03 | 920 | 897 | 182.1 |
| C | 8 | 208 | 217867 | 1015.92 | 898 | 898 | 213.6 |
| C | 12 | 4 | 149254 | 694.65 | 898 | 898 | 213.6 |
| C | 1 | 192 | 57018 | 262.77 | 898 | 898 | 213.6 |
| D | 13 | 223 | 467384 | 2121.84 | 897 | 870 | 219.9 |
| D | 5 | 233 | 35093 | 155.65 | 897 | 870 | 219.9 |
| D | 13 | 137 | 29987 | 132.43 | 897 | 870 | 219.9 |
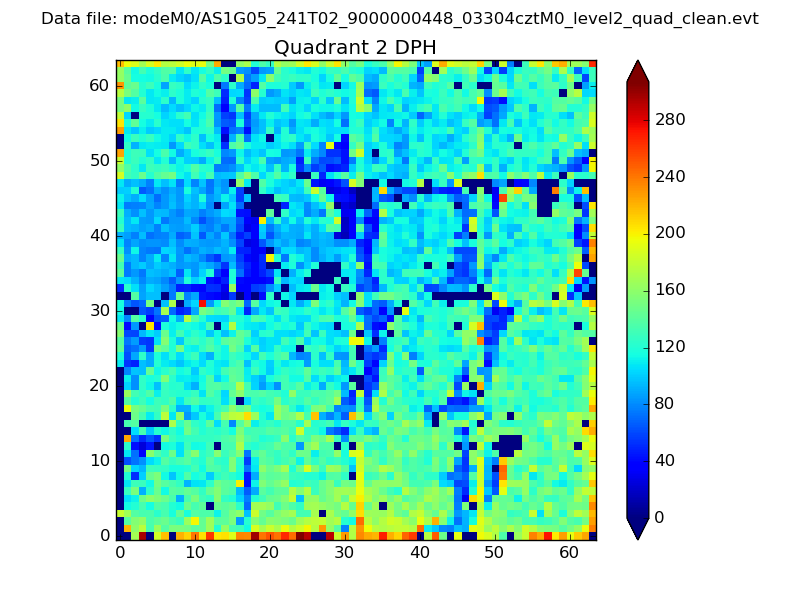
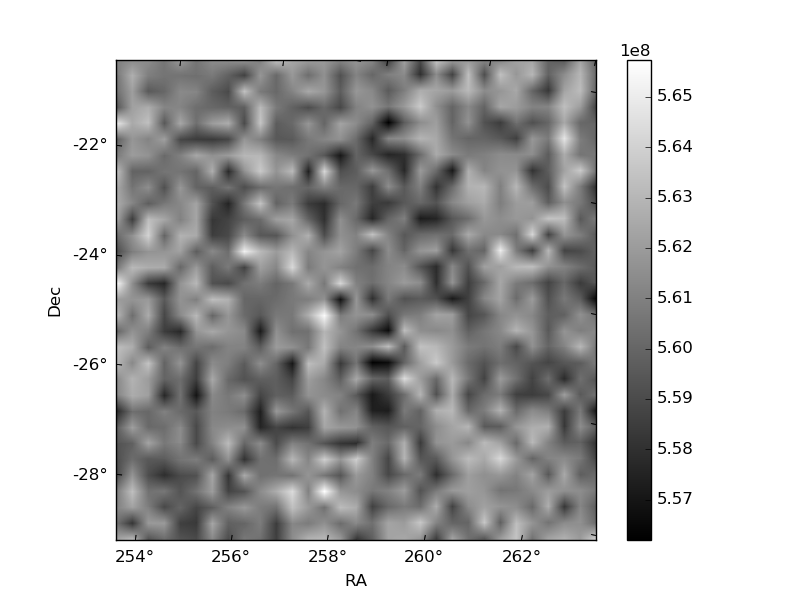
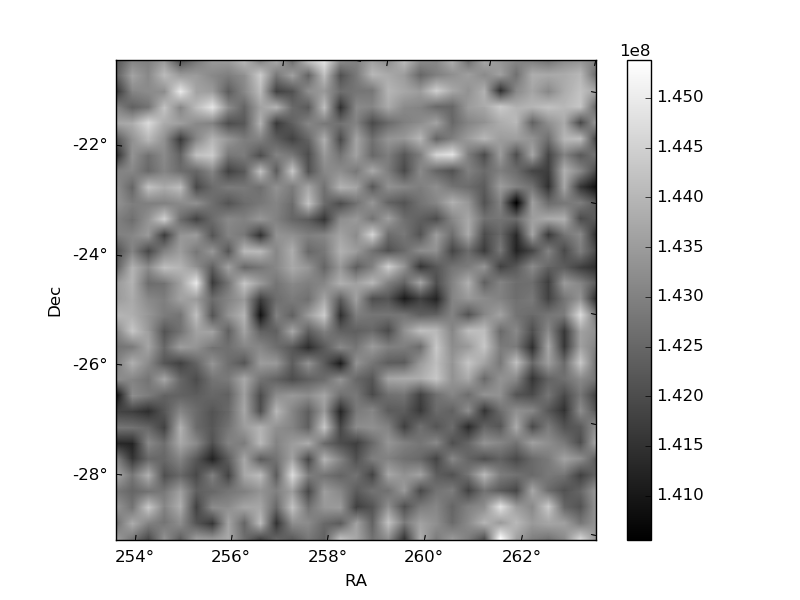
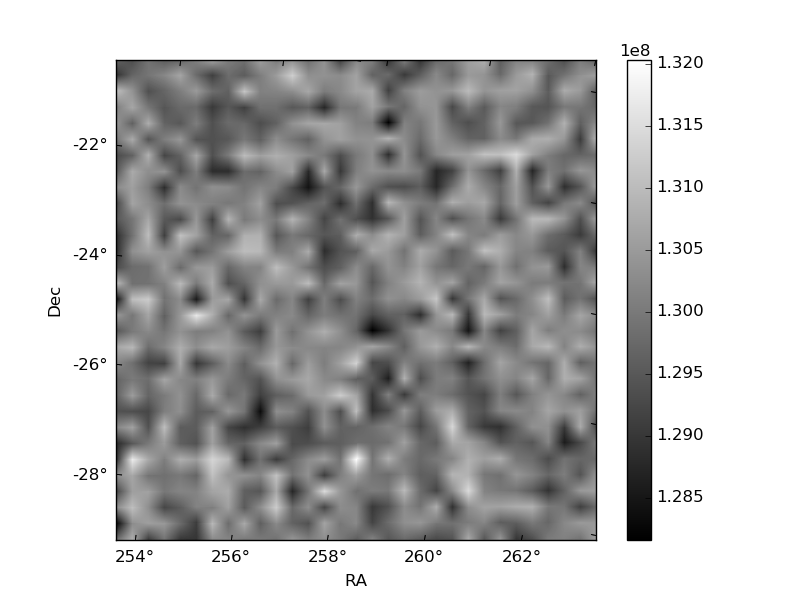
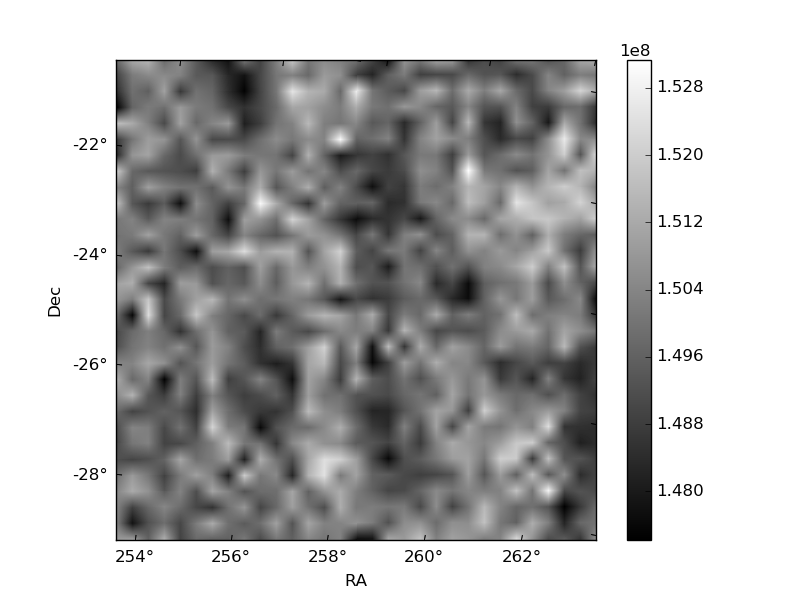
Histogram calculated using DETX and DETY for each event in the final _common_clean file
| Quadrant A | 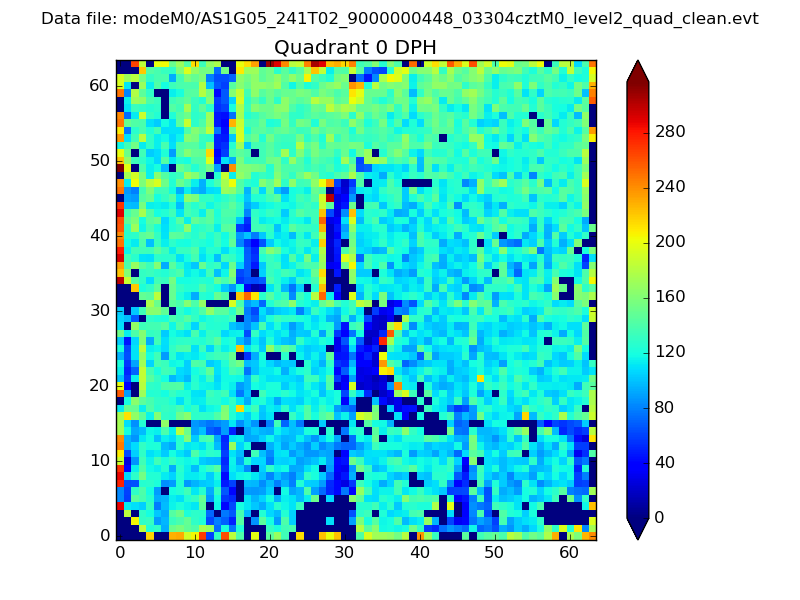 |
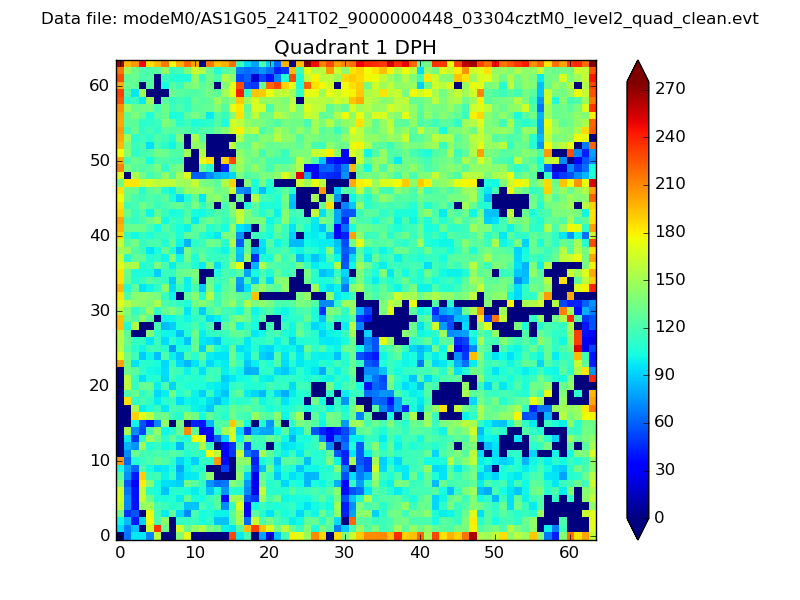 |
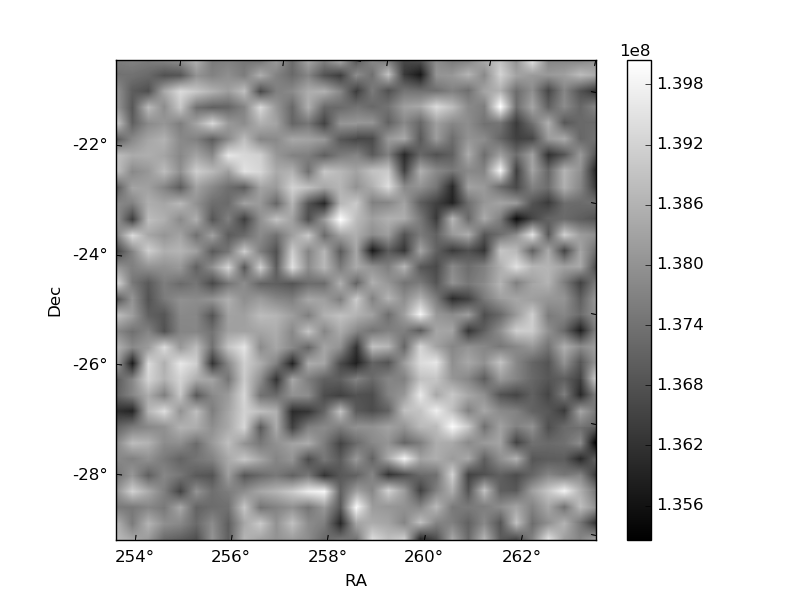
Quadrant B |
|---|---|---|---|
| Quadrant D | 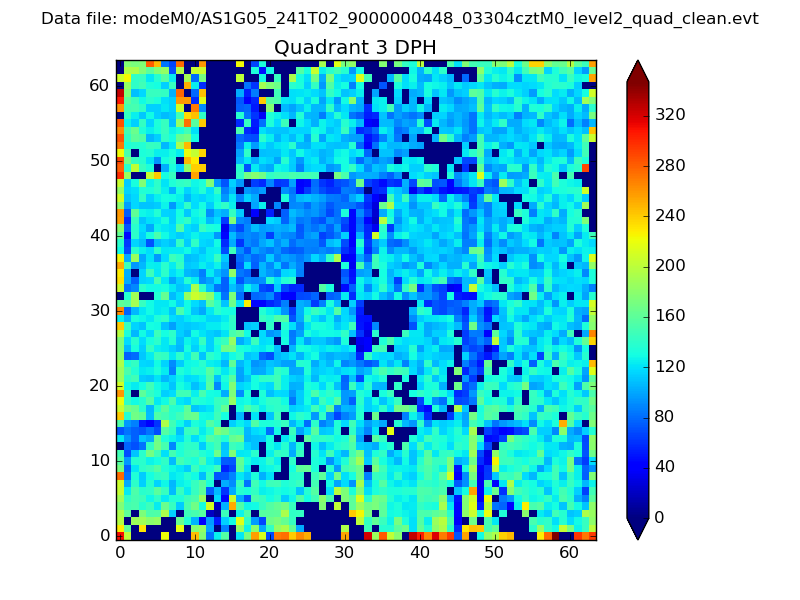 |
 |
Quadrant C |
| Plot type | Count rate plots | Images |
|---|---|---|
| Comparison with Poisson distribution Blue bars denote a histogram of data divided into 1 sec bins. Red curve is a Poisson curve with rate = median count rate of data. |
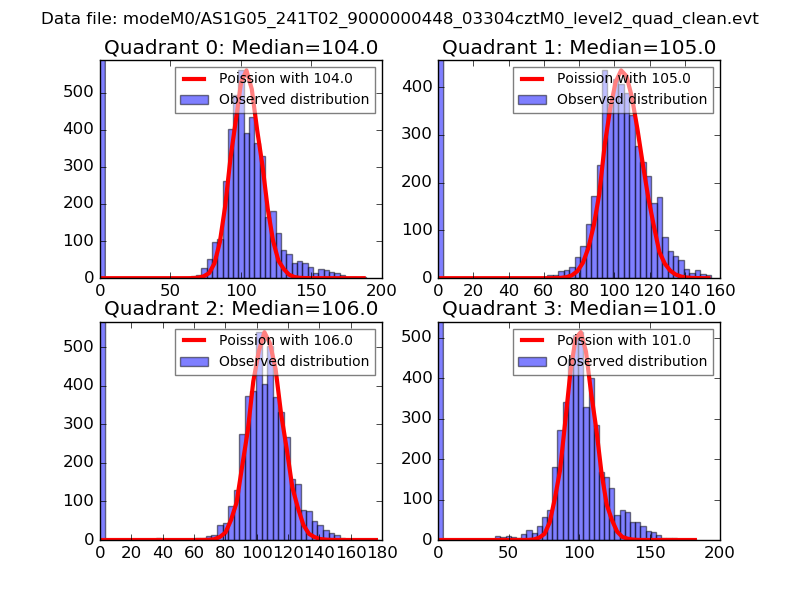 |
 |
| Quadrant-wise count rates Data is divided into 100 sec bins |
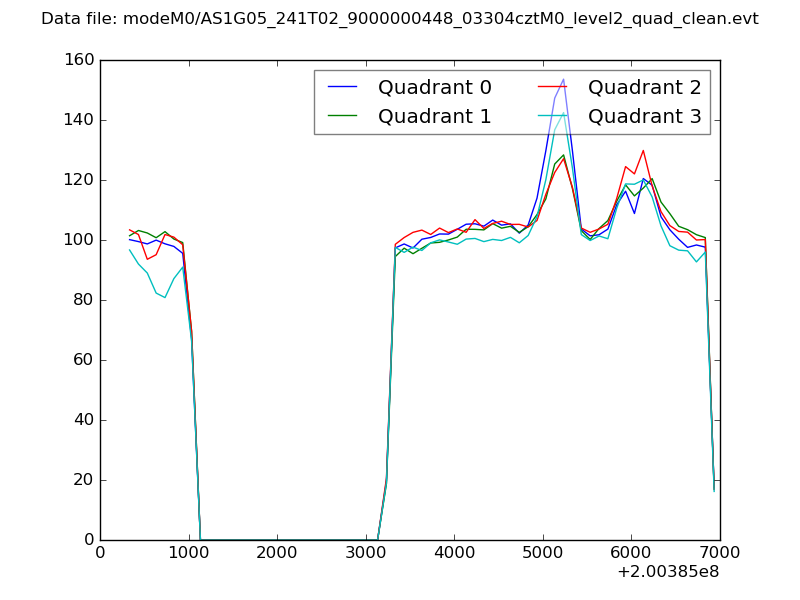 |
|
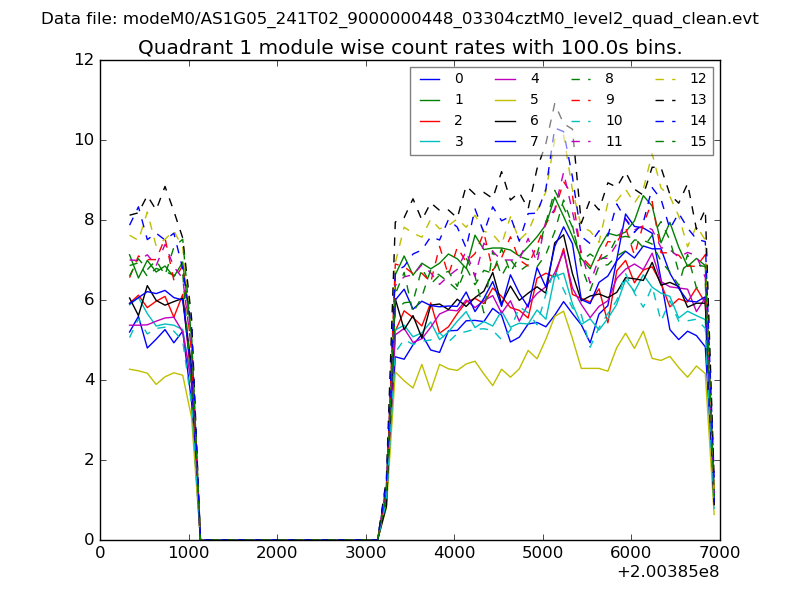
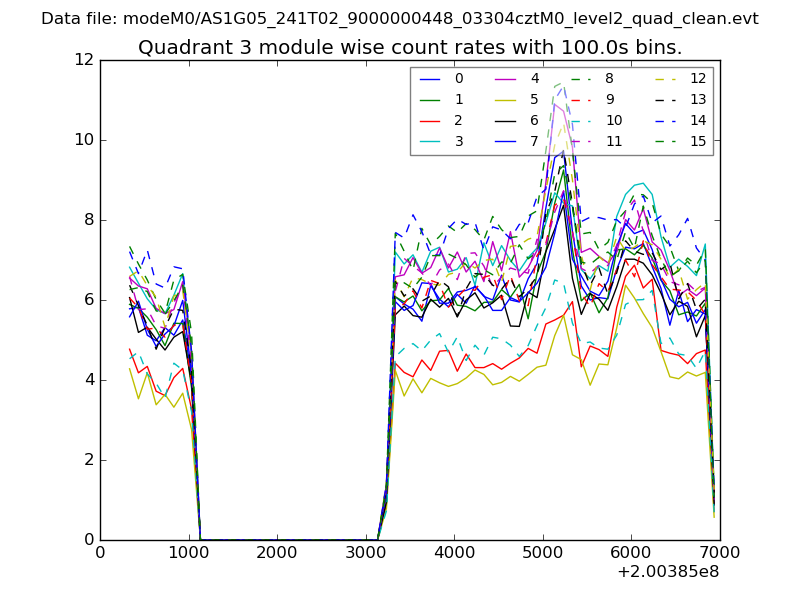
| Module-wise count rates for Quadrant A Data is divided into 100 sec bins |
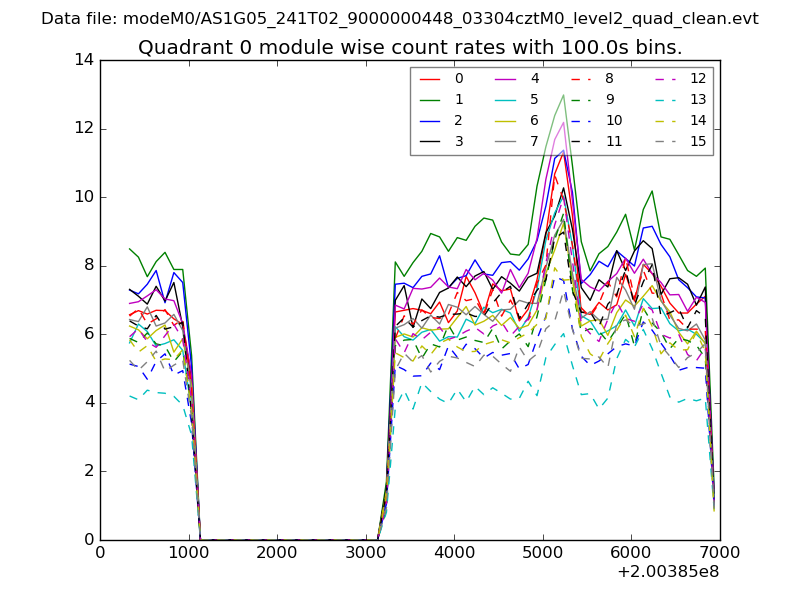 |
 |
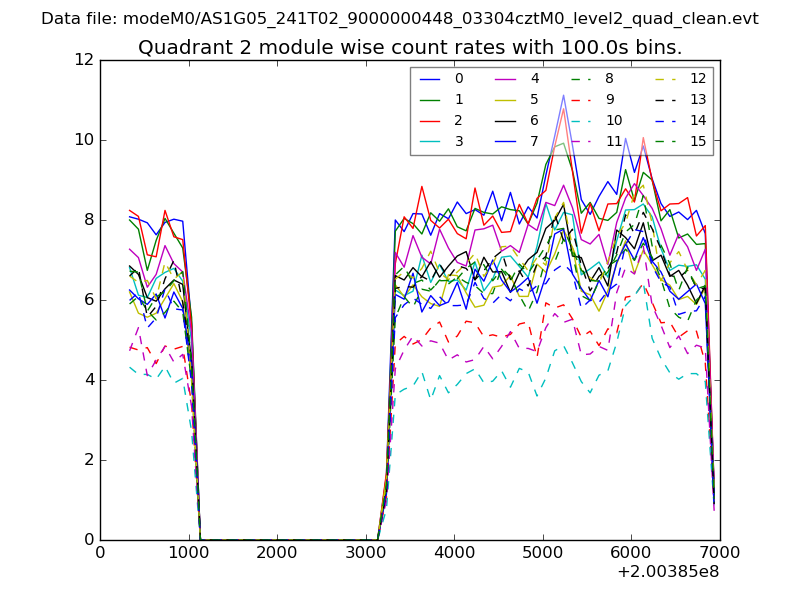
| Module-wise count rates for Quadrant B Data is divided into 100 sec bins |
 |
 |
| Module-wise count rates for Quadrant C Data is divided into 100 sec bins |
 |
 |
| Module-wise count rates for Quadrant D Data is divided into 100 sec bins |
 |
 |
| Parameter | Plot |
|---|---|
| CZT HV Monitor | 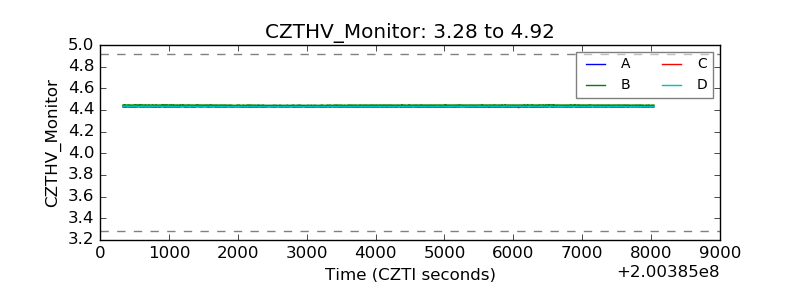 |
| D_VDD | 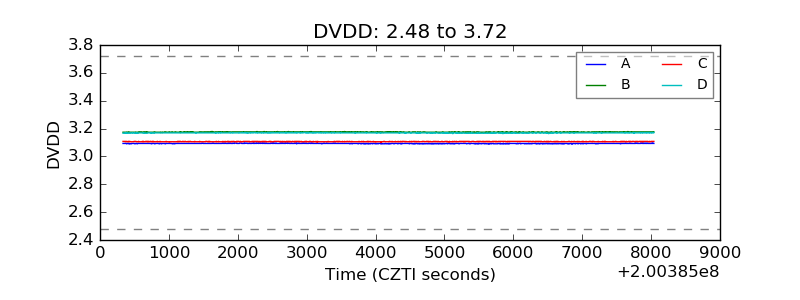 |
| Temperature 1 | 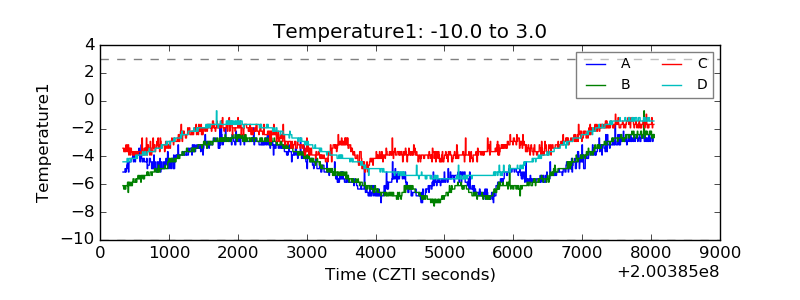 |
| Veto HV Monitor | 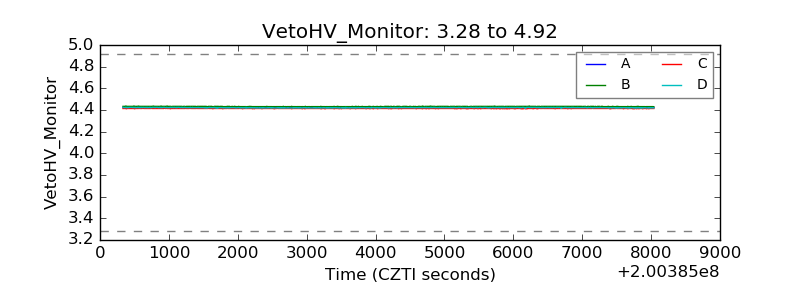 |
| Veto LLD | 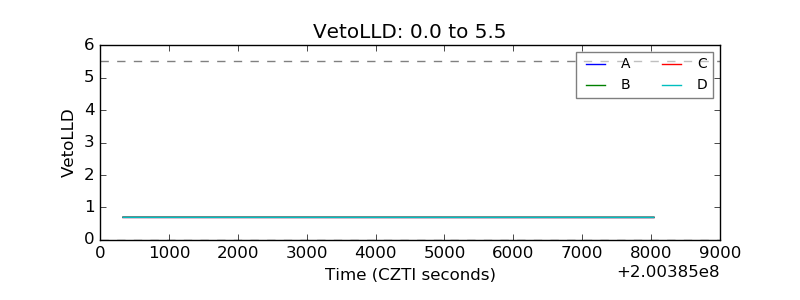 |
| Alpha Counter | 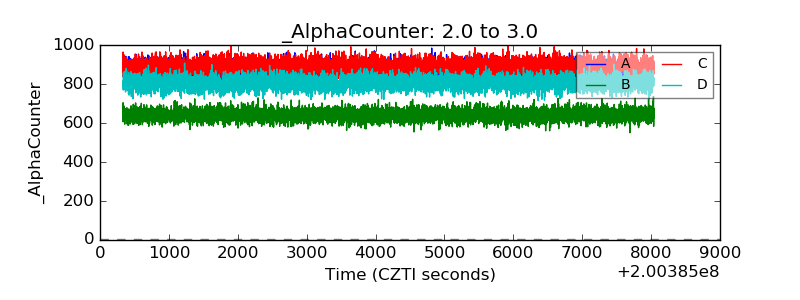 |
| _CPM_Rate | 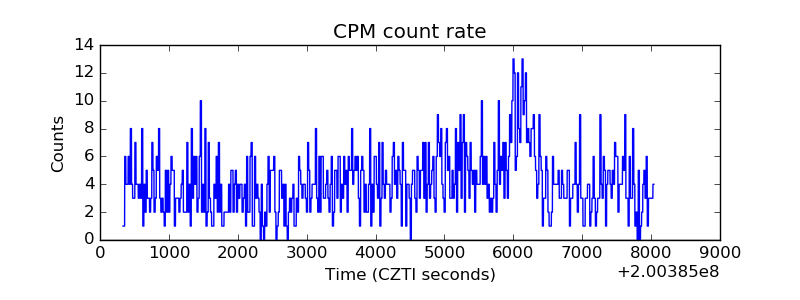 |
| CZT Counter | 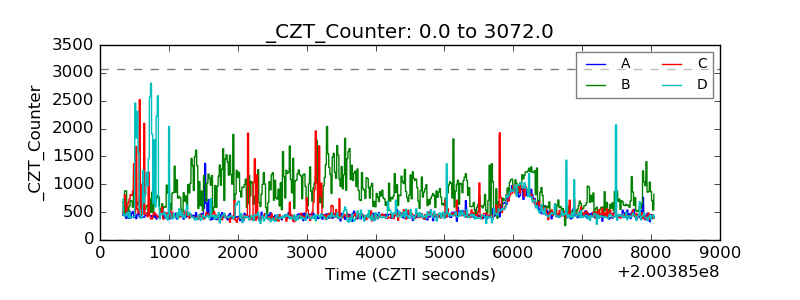 |
| +2.5 Volts monitor |  |
| +5 Volts monitor |  |
| _ROLL_ROT | 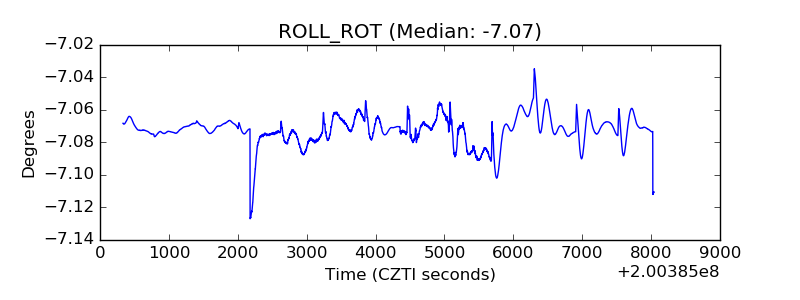 |
| _Roll_DEC | 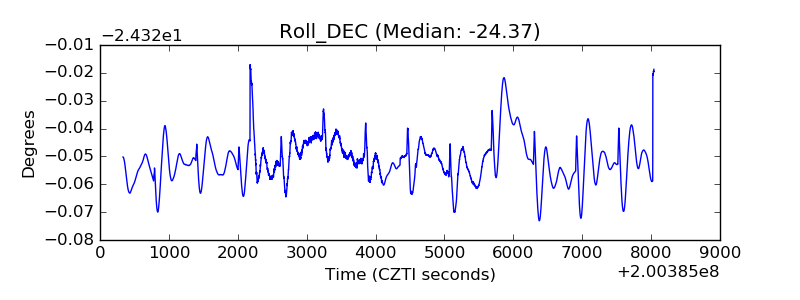 |
| _Roll_RA | 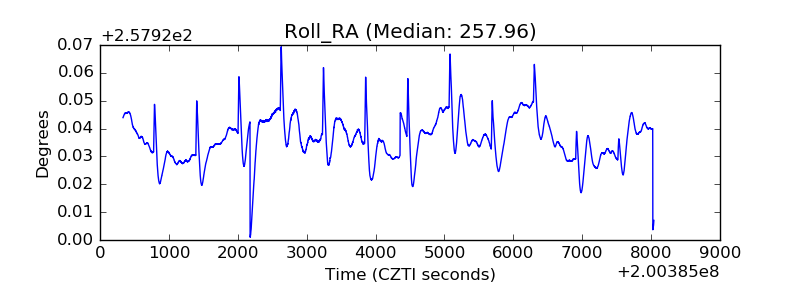 |
| Veto Counter | 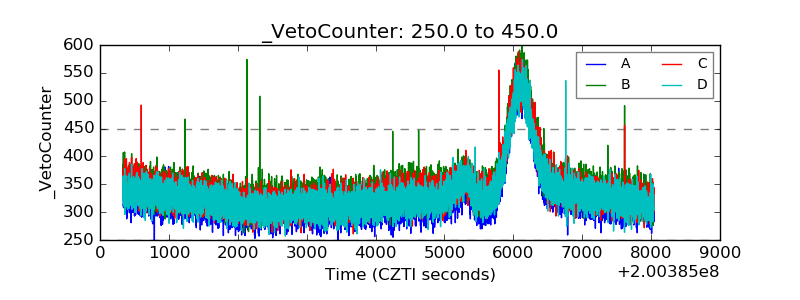 |