| Param | Original file | Final file |
|---|---|---|
| Filename | modeM0/AS1G05_241T02_9000000448_03305cztM0_level2.evt | modeM0/AS1G05_241T02_9000000448_03305cztM0_level2_quad_clean.evt |
| Size (bytes) | 1,166,852,160 | 148,798,080 |
| Size | 1.1 GB | 141.9 MB |
| Events in quadrant A | 7,391,454 | 871,818 |
| Events in quadrant B | 11,075,420 | 858,191 |
| Events in quadrant C | 7,988,610 | 851,166 |
| Events in quadrant D | 7,818,722 | 838,135 |
| Mode M0 | |||
|---|---|---|---|
| Quadrant | BADHDUFLAG | Total packets | Discarded packets |
| A | 0 | 33294 | 2 |
| B | 0 | 43785 | 1 |
| C | 0 | 34595 | 1 |
| D | 0 | 35068 | 7 |
| Mode SS | |||
|---|---|---|---|
| Quadrant | BADHDUFLAG | Total packets | Discarded packets |
| A | 0 | 318 | 0 |
| B | 0 | 318 | 0 |
| C | 0 | 318 | 0 |
| D | 0 | 318 | 0 |
| Mode M9 | |||
|---|---|---|---|
| Quadrant | BADHDUFLAG | Total packets | Discarded packets |
| A | 0 | 4 | 0 |
| B | 0 | 4 | 0 |
| C | 0 | 4 | 0 |
| D | 0 | 4 | 0 |
| Quadrant | Total seconds | Saturated seconds | Saturation percentage |
|---|---|---|---|
| A | 15735 | 548 | 3.482682% |
| B | 15735 | 579 | 3.679695% |
| C | 15735 | 486 | 3.088656% |
| D | 15733 | 537 | 3.413208% |
Noise dominated data is calculated using 1-second bins in cleaned event files. If a bin has >2000 counts, and if more than 50% of those come from <1% of pixels, then it is considered to be noise-dominated and hence unusable.
| Quadrant | # 1 sec bins | Bins with >0 counts | Bins with >2000 counts | High rate bins dominated by noise | Noise dominated (total time) | Noise dominated (detector-on time) | Marked lightcurve |
|---|---|---|---|---|---|---|---|
| A | 19639 | 15739 | 35 | 35 | 0.18% | 0.22% | 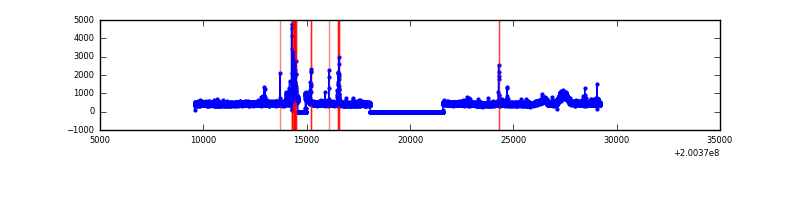 |
| B | 19639 | 15739 | 21 | 21 | 0.11% | 0.13% | 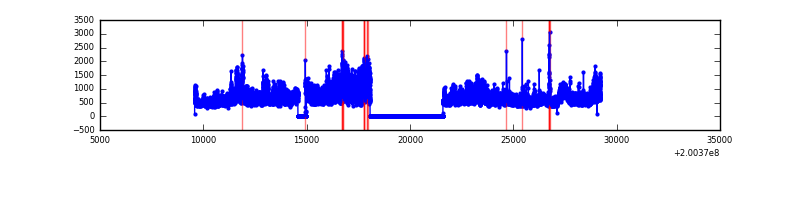 |
| C | 19639 | 15739 | 83 | 83 | 0.42% | 0.53% | 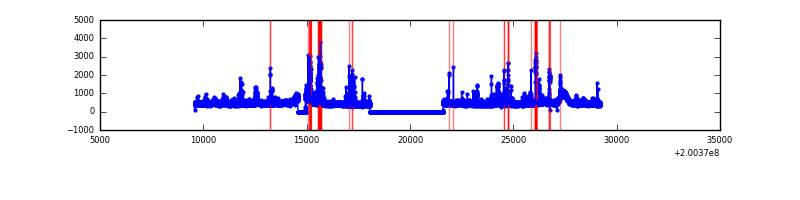 |
| D | 19639 | 15738 | 155 | 155 | 0.79% | 0.98% | 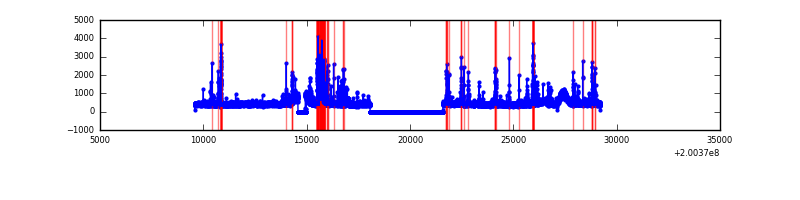 |
Top three noisy pixels from each quadrant. If the there are fewer than three noisy pixels in the level2.evt file, extra rows are filled as -1
| Pixel properties | Quadrant properties | ||||||
|---|---|---|---|---|---|---|---|
| Quadrant | DetID | PixID | Counts | Sigma | Mean | Median | Sigma |
| A | 0 | 50 | 148634 | 385.05 | 1851 | 1804 | 381.3 |
| A | 0 | 118 | 62803 | 159.96 | 1851 | 1804 | 381.3 |
| A | 8 | 15 | 28651 | 70.4 | 1851 | 1804 | 381.3 |
| B | 15 | 204 | 3286185 | 9075.57 | 1862 | 1816 | 361.9 |
| B | 14 | 167 | 319143 | 876.86 | 1862 | 1816 | 361.9 |
| B | 2 | 249 | 118381 | 322.1 | 1862 | 1816 | 361.9 |
| C | 1 | 192 | 379659 | 891.36 | 1804 | 1811 | 423.9 |
| C | 8 | 208 | 296562 | 695.33 | 1804 | 1811 | 423.9 |
| C | 2 | 53 | 97574 | 225.91 | 1804 | 1811 | 423.9 |
| D | 13 | 223 | 585559 | 1325.19 | 1811 | 1760 | 440.5 |
| D | 12 | 233 | 82811 | 183.98 | 1811 | 1760 | 440.5 |
| D | 2 | 31 | 76697 | 170.1 | 1811 | 1760 | 440.5 |
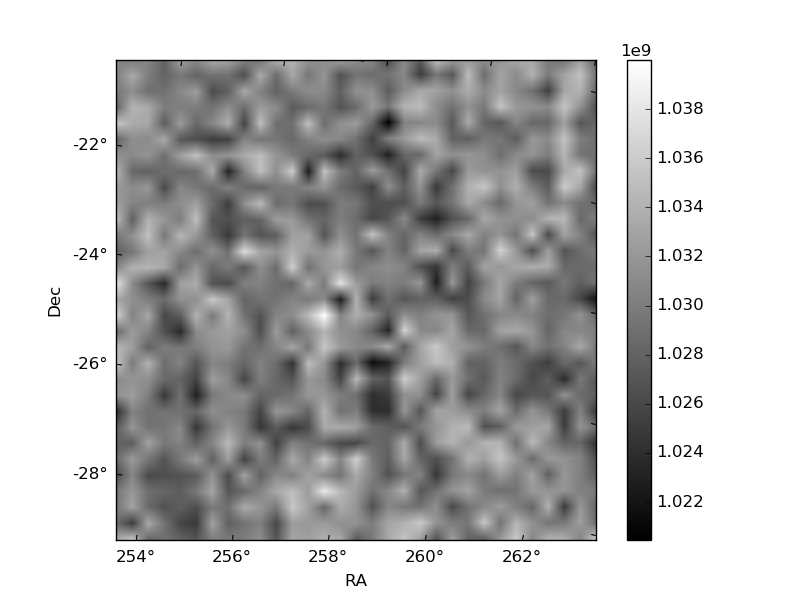
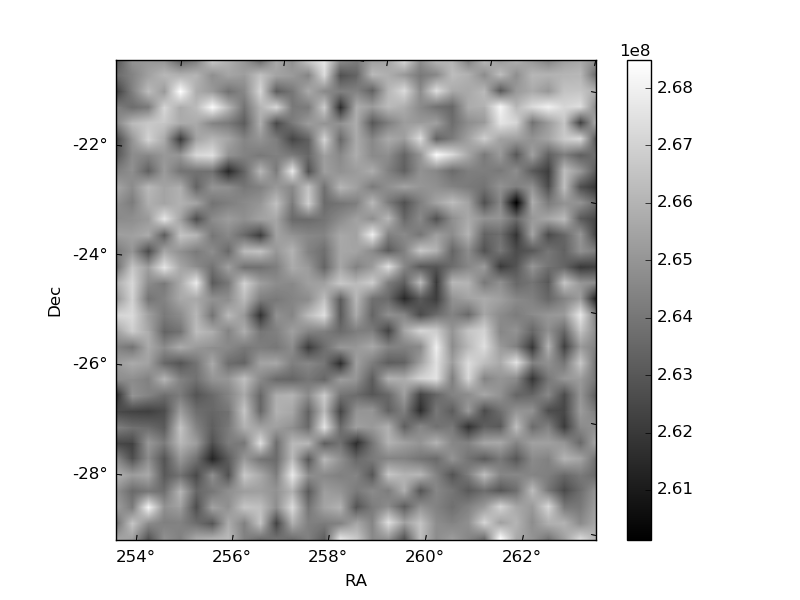
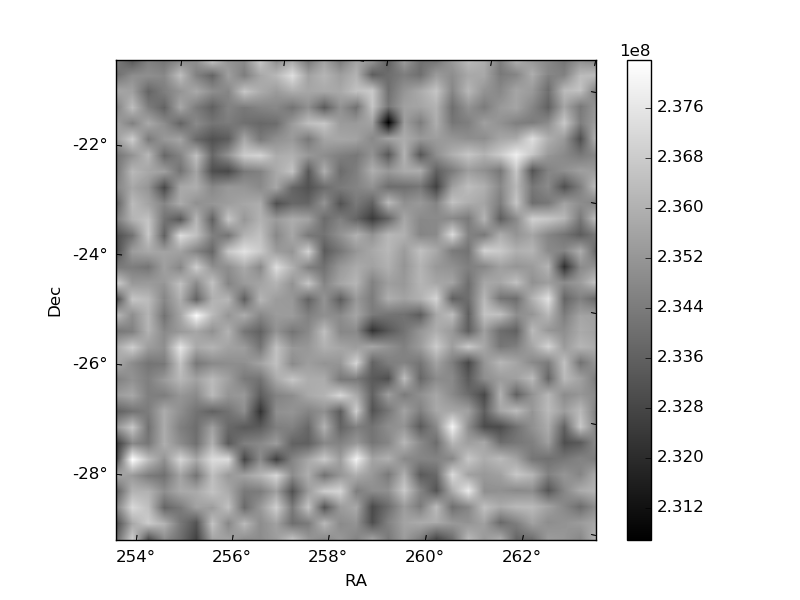
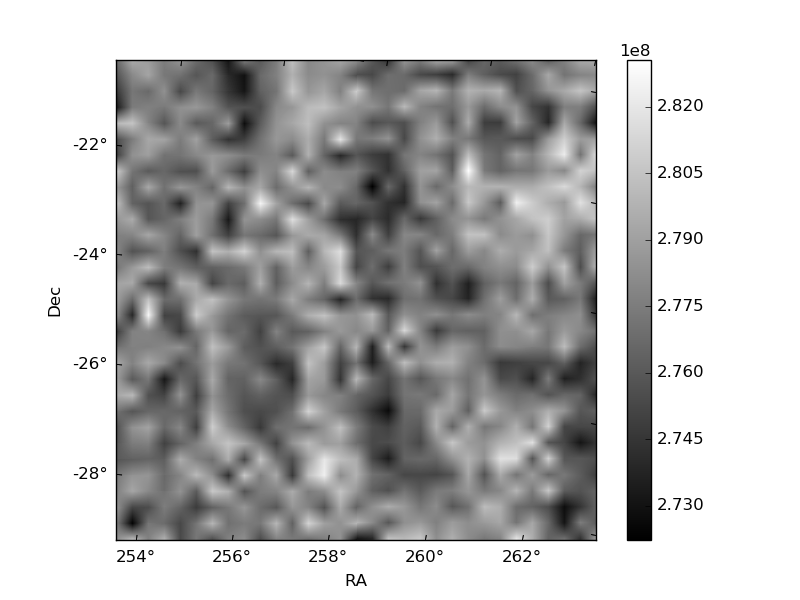
Histogram calculated using DETX and DETY for each event in the final _common_clean file
| Quadrant A | 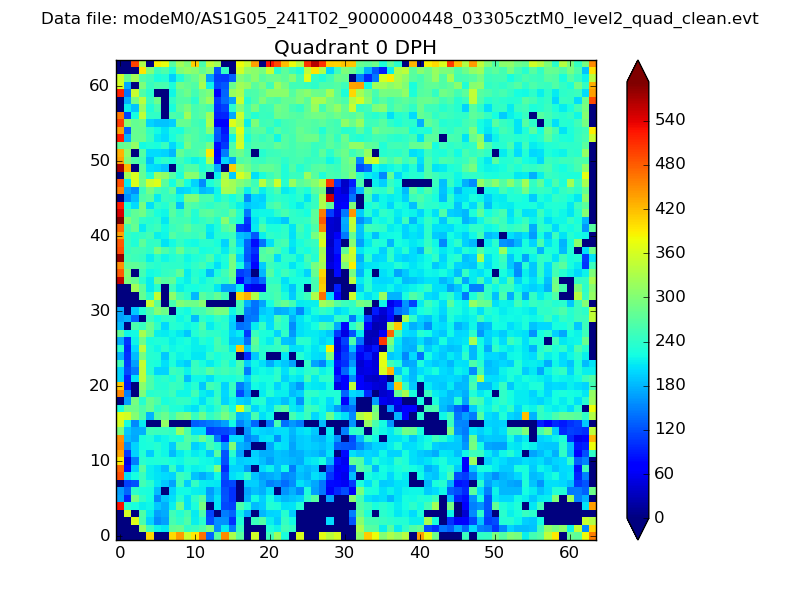 |
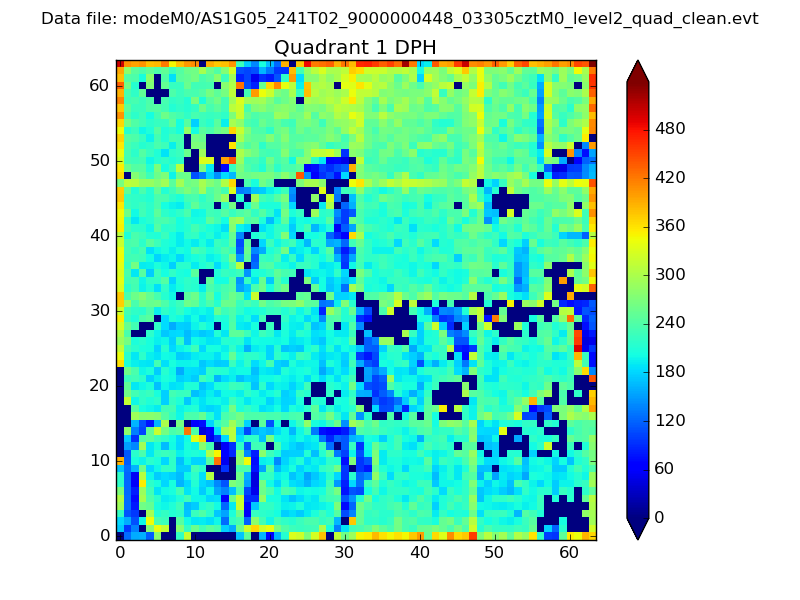 |
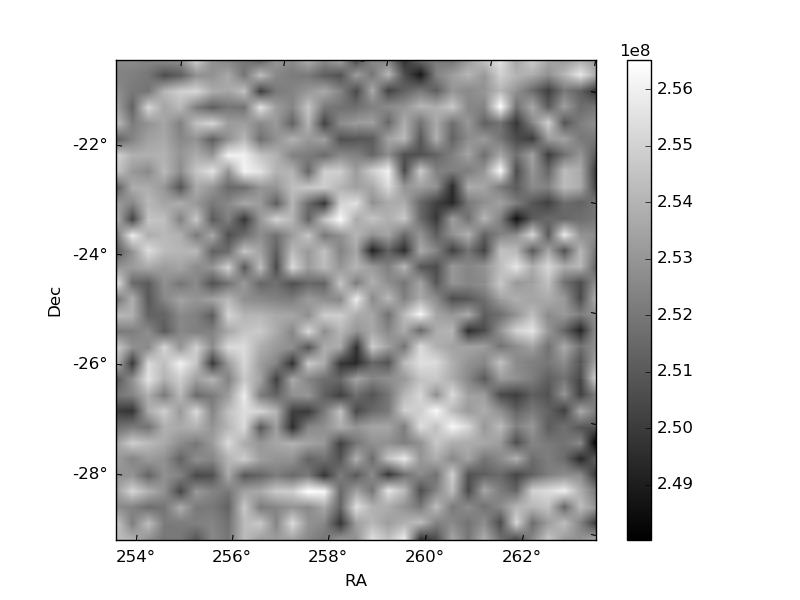
Quadrant B |
|---|---|---|---|
| Quadrant D | 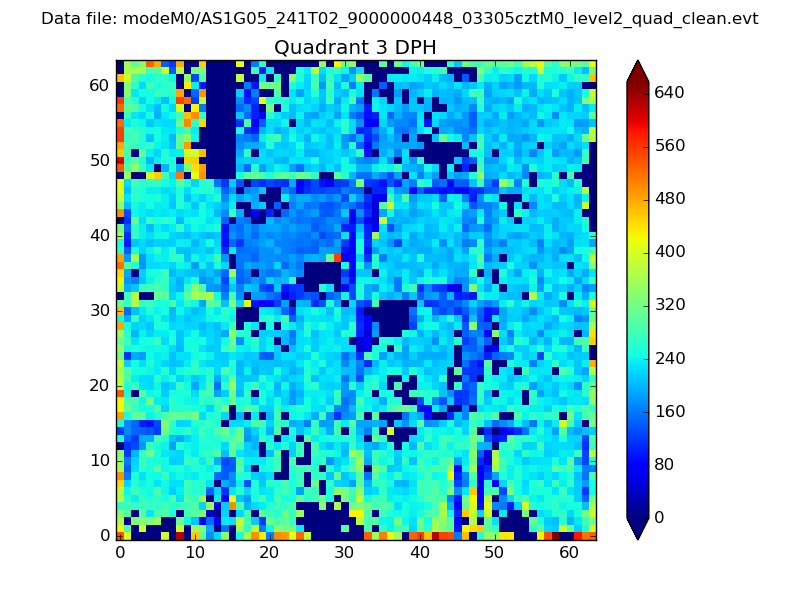 |
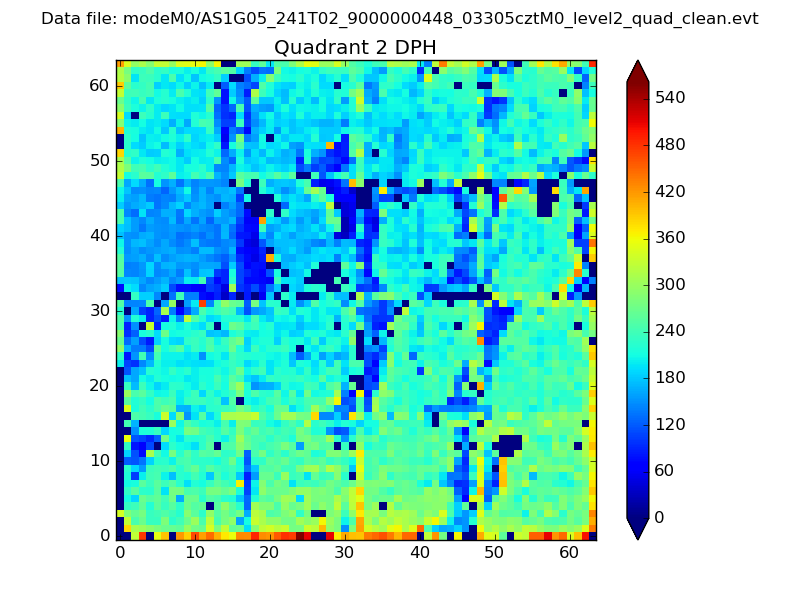 |
Quadrant C |
| Plot type | Count rate plots | Images |
|---|---|---|
| Comparison with Poisson distribution Blue bars denote a histogram of data divided into 1 sec bins. Red curve is a Poisson curve with rate = median count rate of data. |
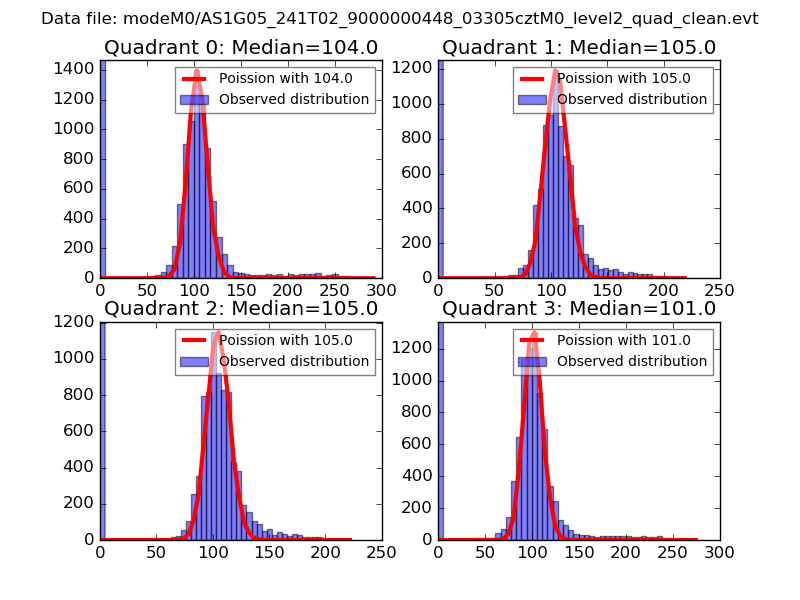 |
 |
| Quadrant-wise count rates Data is divided into 100 sec bins |
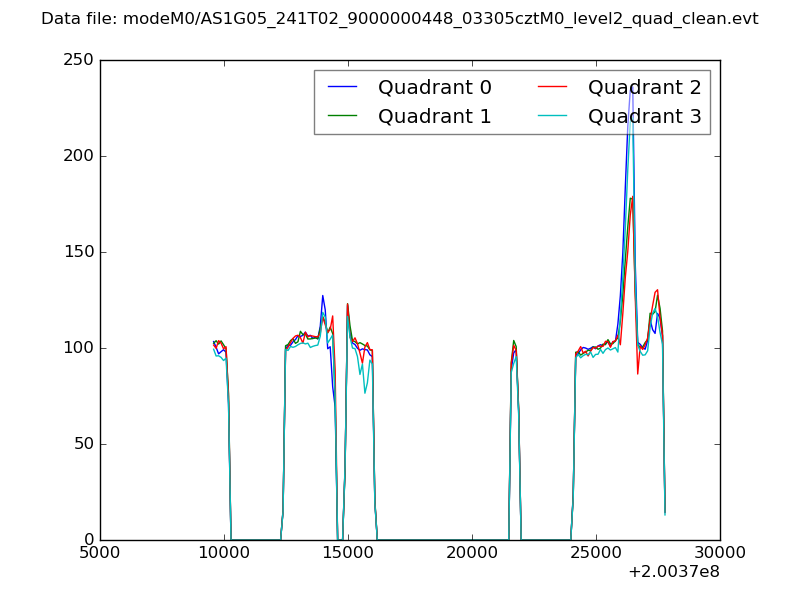 |
|
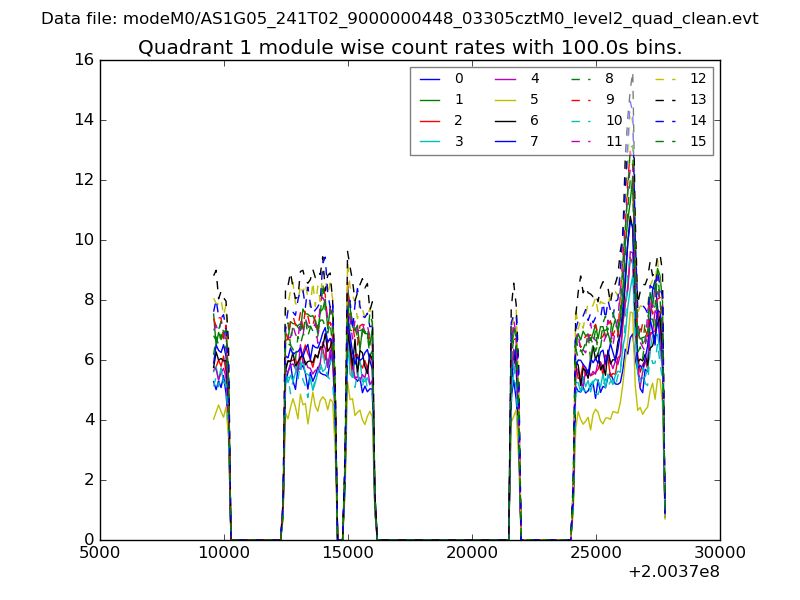
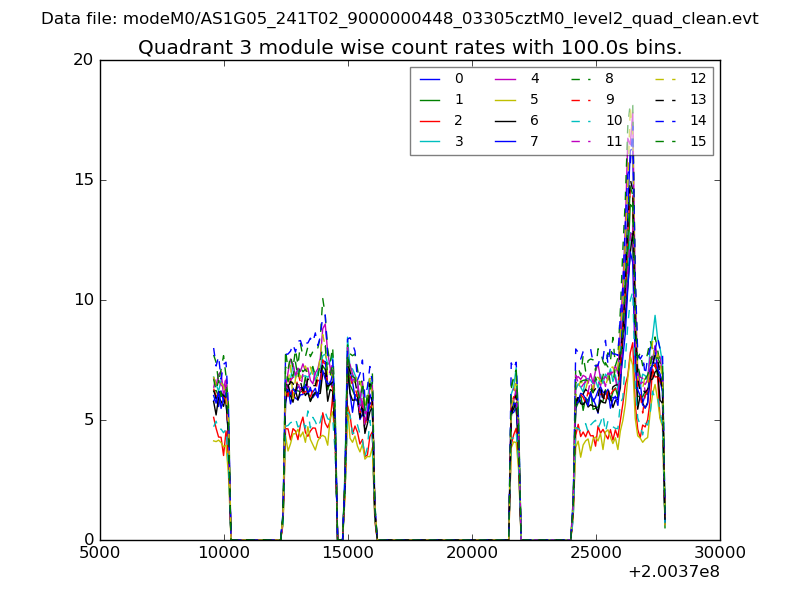
| Module-wise count rates for Quadrant A Data is divided into 100 sec bins |
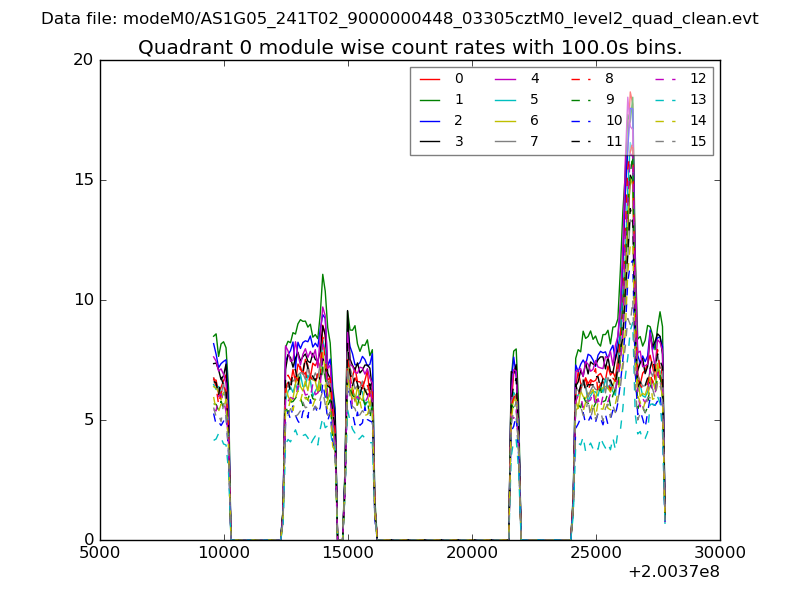 |
 |
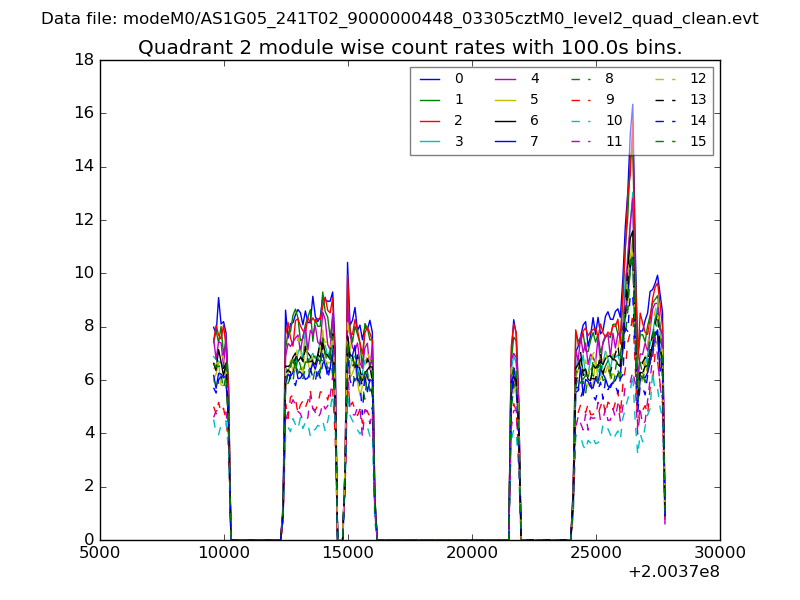
| Module-wise count rates for Quadrant B Data is divided into 100 sec bins |
 |
 |
| Module-wise count rates for Quadrant C Data is divided into 100 sec bins |
 |
 |
| Module-wise count rates for Quadrant D Data is divided into 100 sec bins |
 |
 |
| Parameter | Plot |
|---|---|
| CZT HV Monitor | 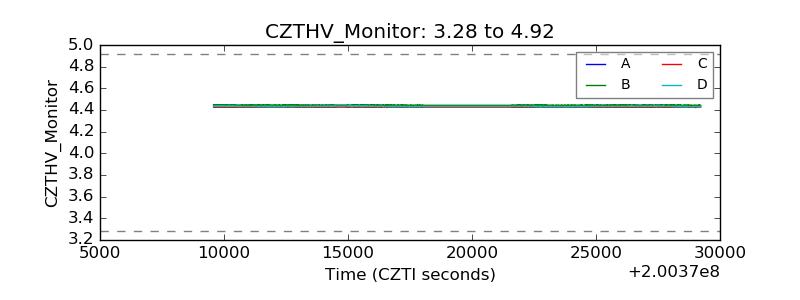 |
| D_VDD | 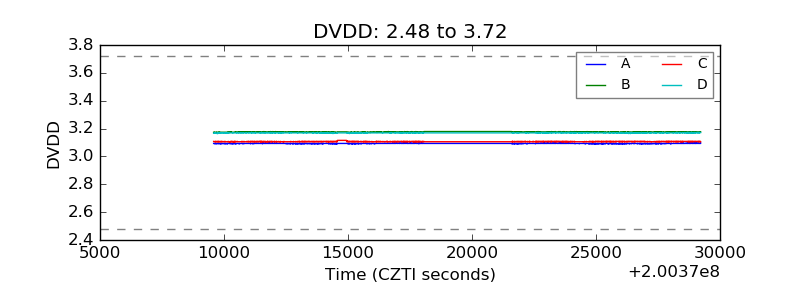 |
| Temperature 1 | 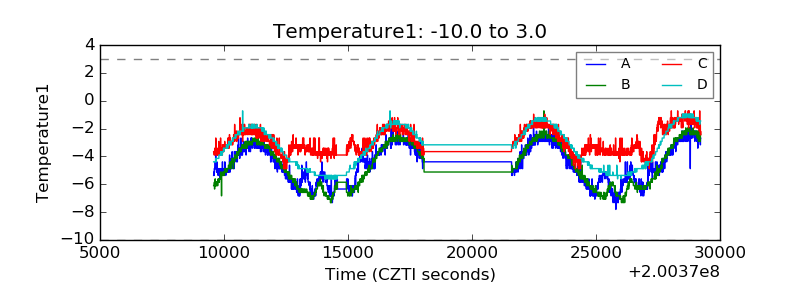 |
| Veto HV Monitor | 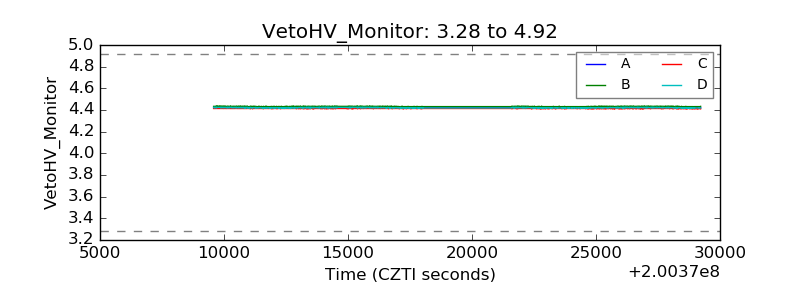 |
| Veto LLD | 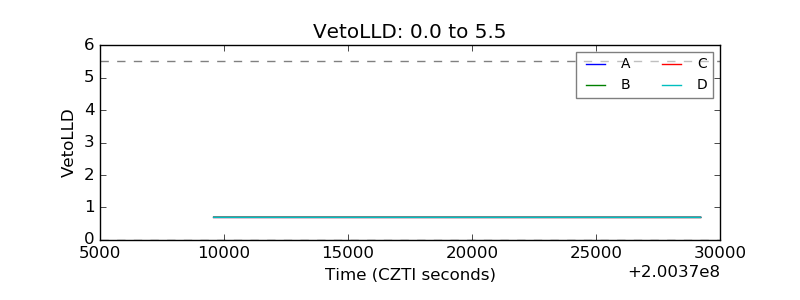 |
| Alpha Counter | 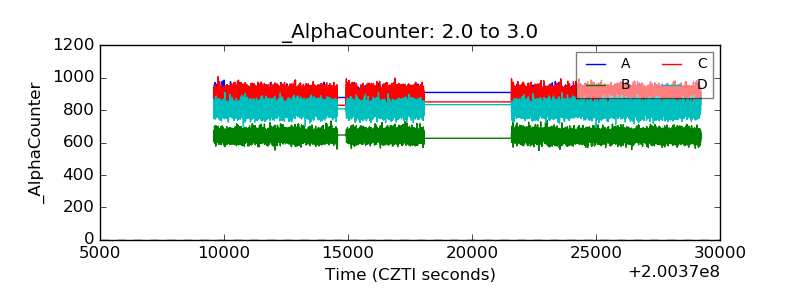 |
| _CPM_Rate | 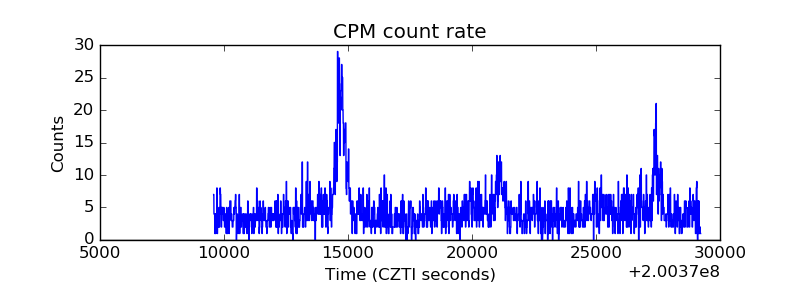 |
| CZT Counter | 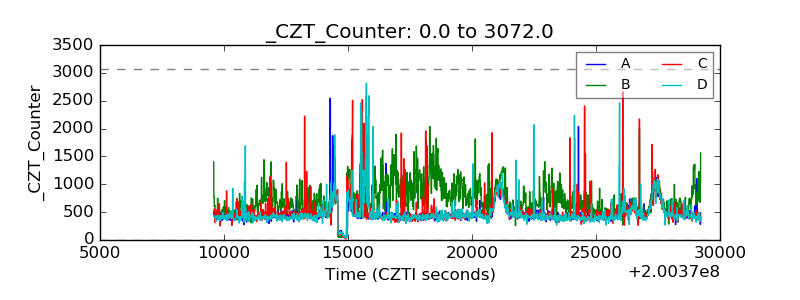 |
| +2.5 Volts monitor |  |
| +5 Volts monitor |  |
| _ROLL_ROT | 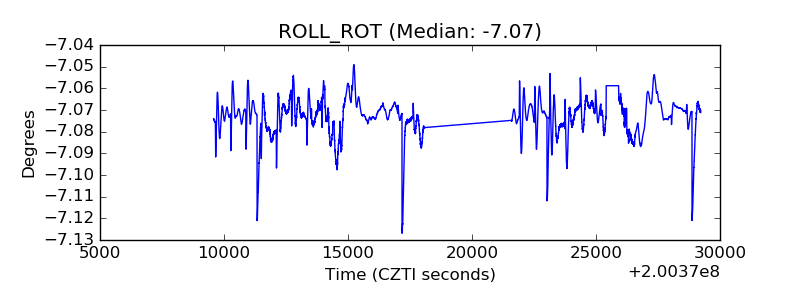 |
| _Roll_DEC | 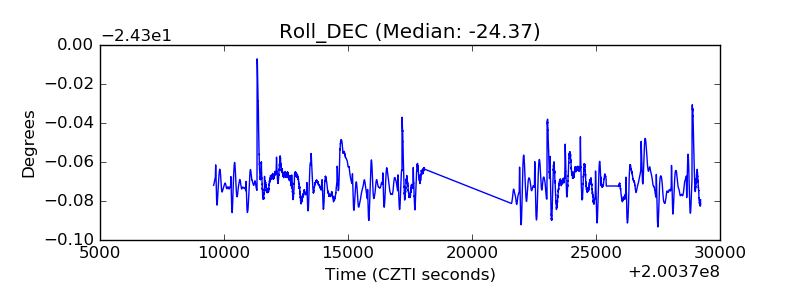 |
| _Roll_RA | 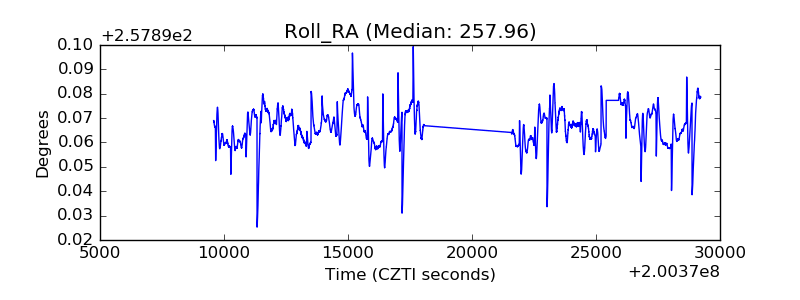 |
| Veto Counter | 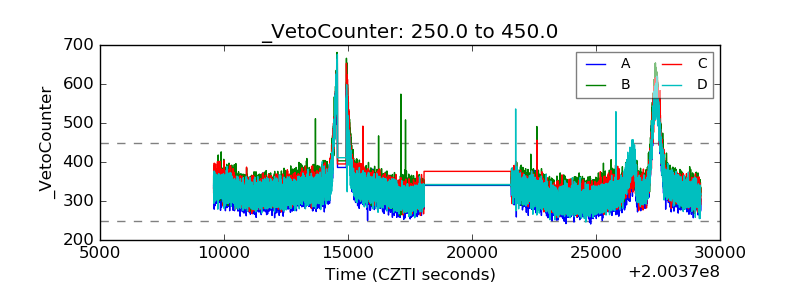 |