| Param | Original file | Final file |
|---|---|---|
| Filename | modeM0/AS1G05_241T02_9000000448_03309cztM0_level2.evt | modeM0/AS1G05_241T02_9000000448_03309cztM0_level2_quad_clean.evt |
| Size (bytes) | 520,790,400 | 71,737,920 |
| Size | 496.7 MB | 68.4 MB |
| Events in quadrant A | 3,880,761 | 415,354 |
| Events in quadrant B | 4,934,970 | 434,219 |
| Events in quadrant C | 3,173,608 | 436,742 |
| Events in quadrant D | 3,327,970 | 418,409 |
| Mode M0 | |||
|---|---|---|---|
| Quadrant | BADHDUFLAG | Total packets | Discarded packets |
| A | 0 | 16143 | 3 |
| B | 0 | 19136 | 2 |
| C | 0 | 14068 | 2 |
| D | 0 | 14878 | 2 |
| Mode SS | |||
|---|---|---|---|
| Quadrant | BADHDUFLAG | Total packets | Discarded packets |
| A | 0 | 136 | 0 |
| B | 0 | 136 | 0 |
| C | 0 | 136 | 0 |
| D | 0 | 136 | 0 |
| Mode M9 | |||
|---|---|---|---|
| Quadrant | BADHDUFLAG | Total packets | Discarded packets |
| A | 0 | 9 | 0 |
| B | 0 | 9 | 0 |
| C | 0 | 9 | 0 |
| D | 0 | 9 | 0 |
| Quadrant | Total seconds | Saturated seconds | Saturation percentage |
|---|---|---|---|
| A | 6702 | 275 | 4.103253% |
| B | 6702 | 403 | 6.013130% |
| C | 6702 | 39 | 0.581916% |
| D | 6702 | 91 | 1.357804% |
Noise dominated data is calculated using 1-second bins in cleaned event files. If a bin has >2000 counts, and if more than 50% of those come from <1% of pixels, then it is considered to be noise-dominated and hence unusable.
| Quadrant | # 1 sec bins | Bins with >0 counts | Bins with >2000 counts | High rate bins dominated by noise | Noise dominated (total time) | Noise dominated (detector-on time) | Marked lightcurve |
|---|---|---|---|---|---|---|---|
| A | 7602 | 6703 | 183 | 183 | 2.41% | 2.73% | 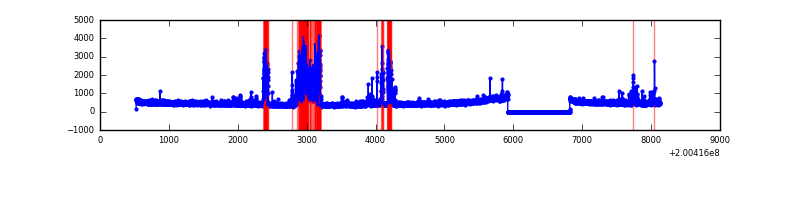 |
| B | 7602 | 6703 | 191 | 191 | 2.51% | 2.85% | 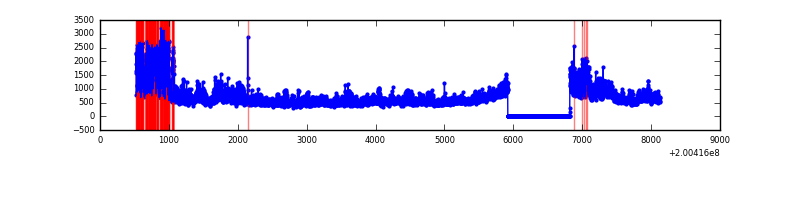 |
| C | 7602 | 6703 | 16 | 16 | 0.21% | 0.24% | 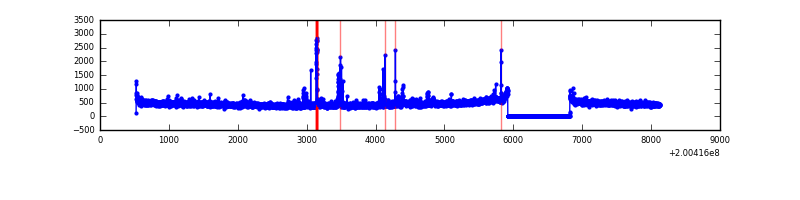 |
| D | 7602 | 6703 | 67 | 67 | 0.88% | 1.00% | 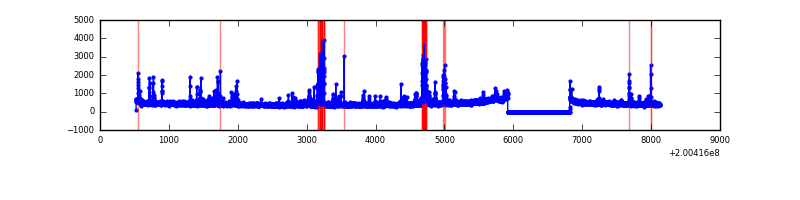 |
Top three noisy pixels from each quadrant. If the there are fewer than three noisy pixels in the level2.evt file, extra rows are filled as -1
| Pixel properties | Quadrant properties | ||||||
|---|---|---|---|---|---|---|---|
| Quadrant | DetID | PixID | Counts | Sigma | Mean | Median | Sigma |
| A | 0 | 50 | 776105 | 4811.37 | 779 | 760 | 161.1 |
| A | 8 | 15 | 61854 | 379.12 | 779 | 760 | 161.1 |
| A | 0 | 118 | 33332 | 202.12 | 779 | 760 | 161.1 |
| B | 15 | 204 | 1366550 | 8951.05 | 781 | 762 | 152.6 |
| B | 3 | 0 | 489481 | 3202.95 | 781 | 762 | 152.6 |
| B | 2 | 249 | 34604 | 221.79 | 781 | 762 | 152.6 |
| C | 6 | 80 | 103020 | 560.66 | 765 | 769 | 182.4 |
| C | 1 | 192 | 55640 | 300.87 | 765 | 769 | 182.4 |
| C | 12 | 4 | 9066 | 45.49 | 765 | 769 | 182.4 |
| D | 13 | 223 | 280485 | 1509.92 | 762 | 739 | 185.3 |
| D | 12 | 233 | 74639 | 398.87 | 762 | 739 | 185.3 |
| D | 13 | 239 | 41018 | 217.4 | 762 | 739 | 185.3 |
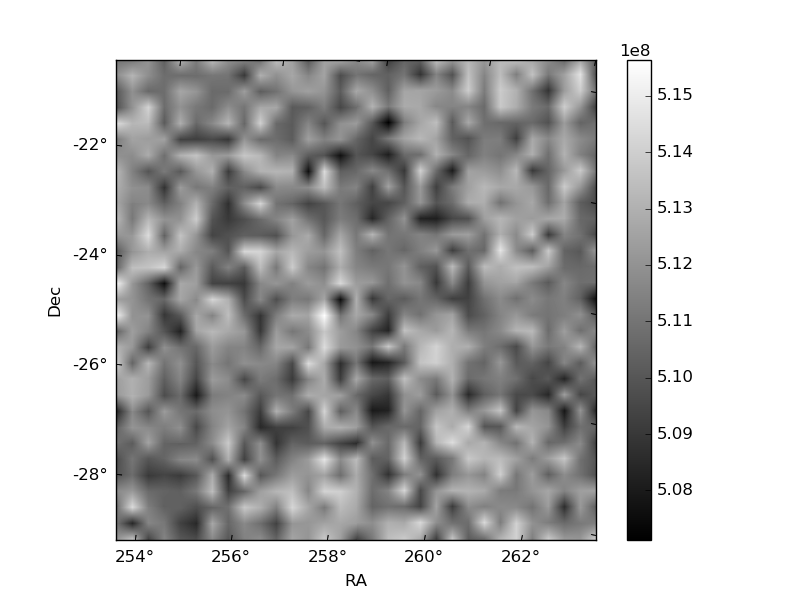
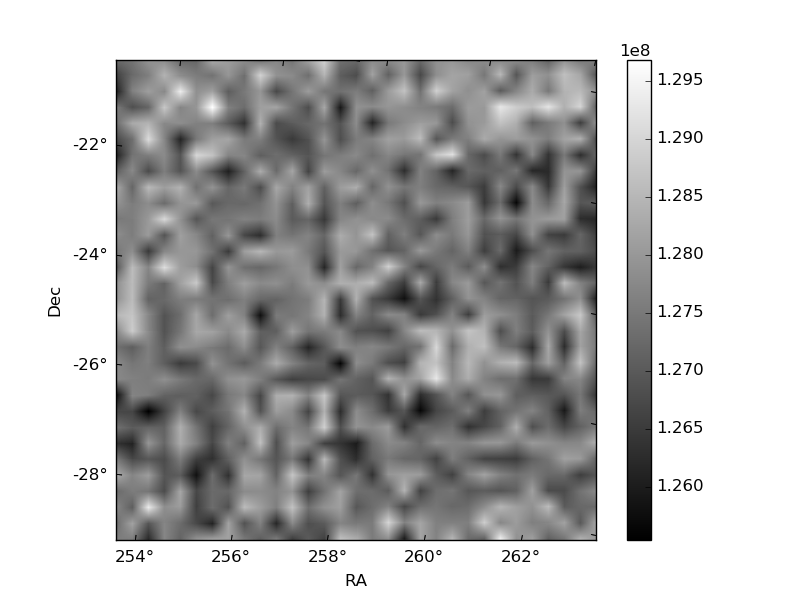
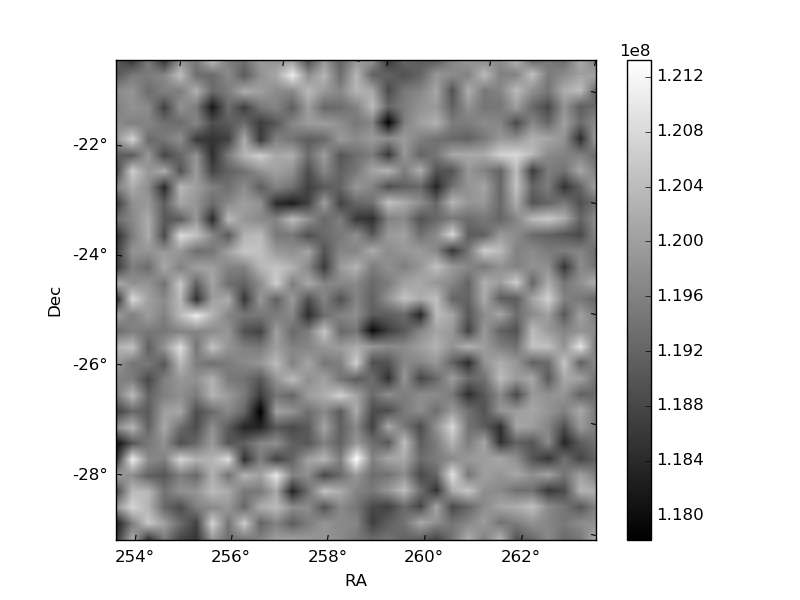
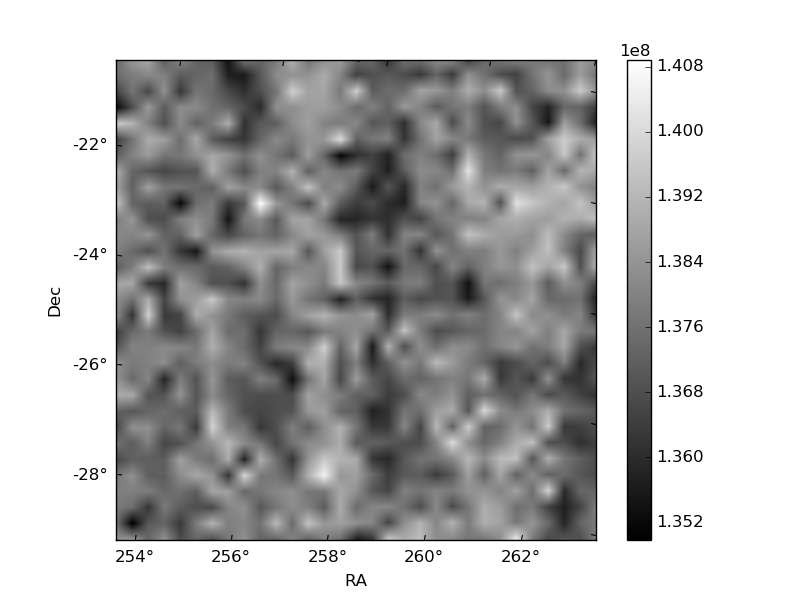
Histogram calculated using DETX and DETY for each event in the final _common_clean file
| Quadrant A | 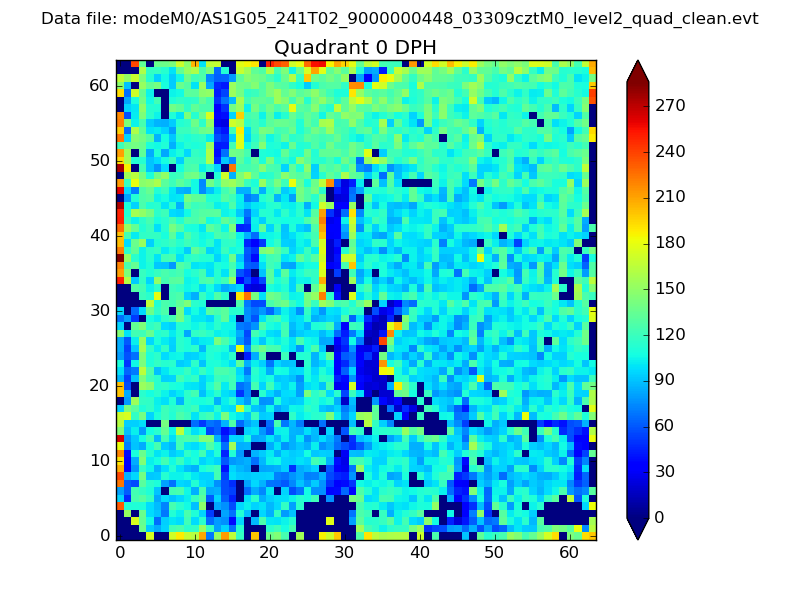 |
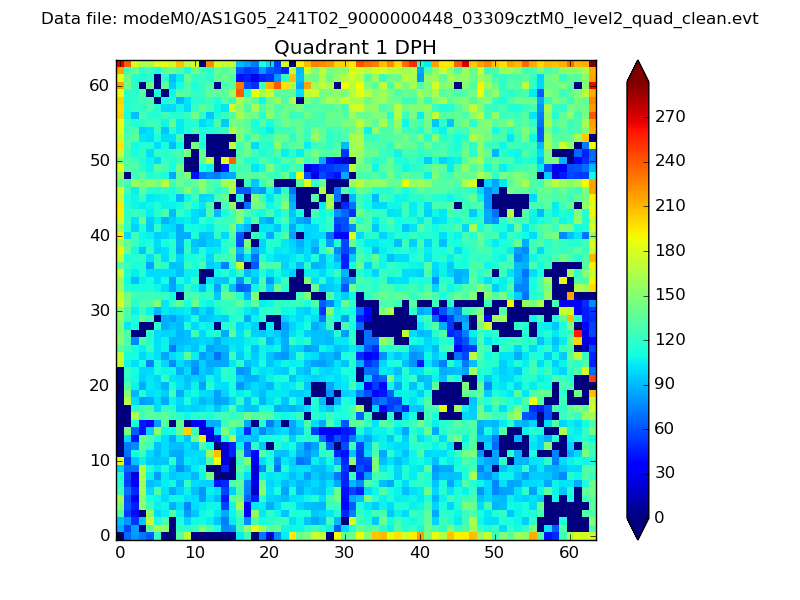 |
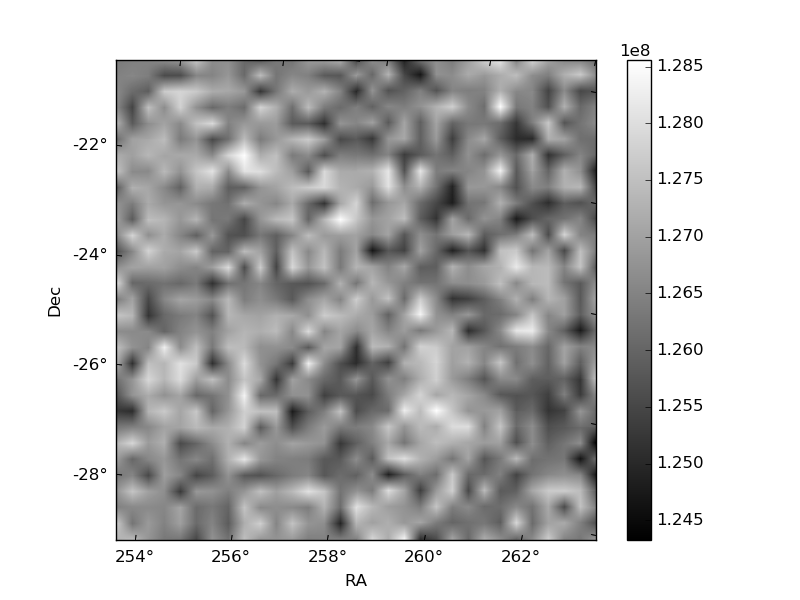
Quadrant B |
|---|---|---|---|
| Quadrant D | 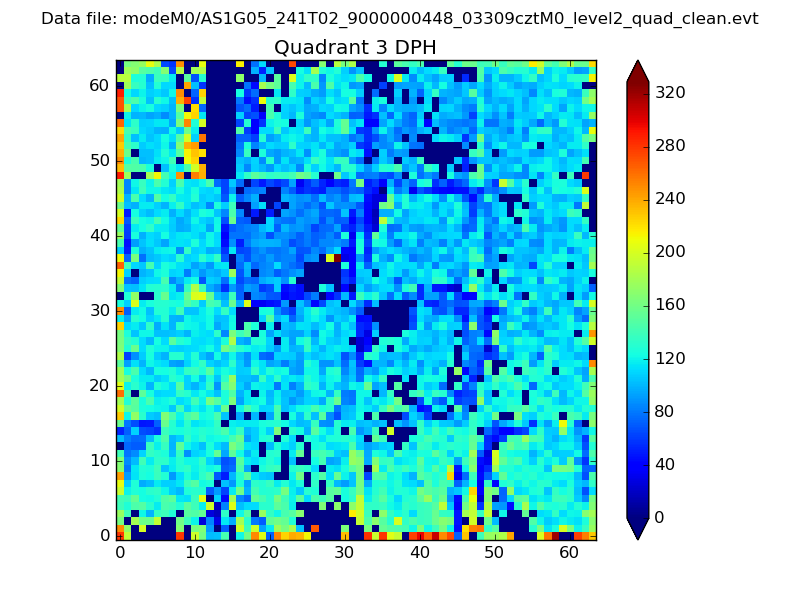 |
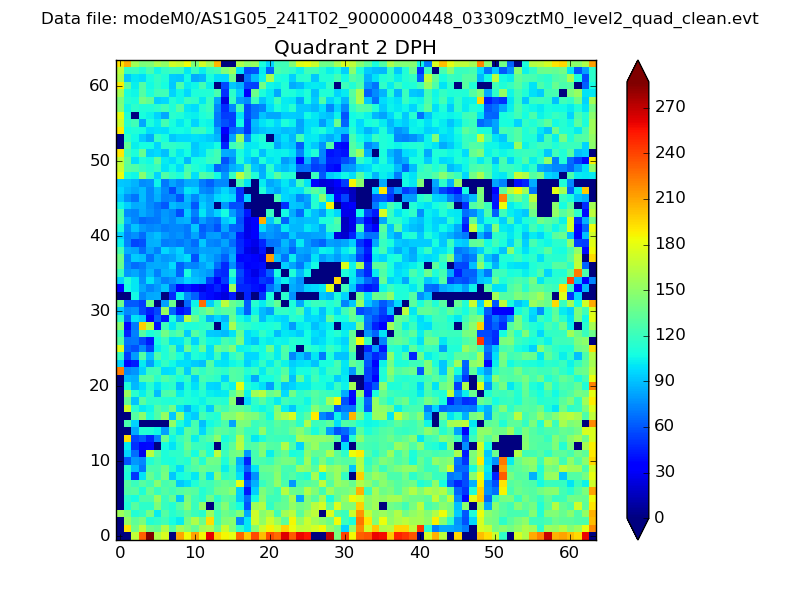 |
Quadrant C |
| Plot type | Count rate plots | Images |
|---|---|---|
| Comparison with Poisson distribution Blue bars denote a histogram of data divided into 1 sec bins. Red curve is a Poisson curve with rate = median count rate of data. |
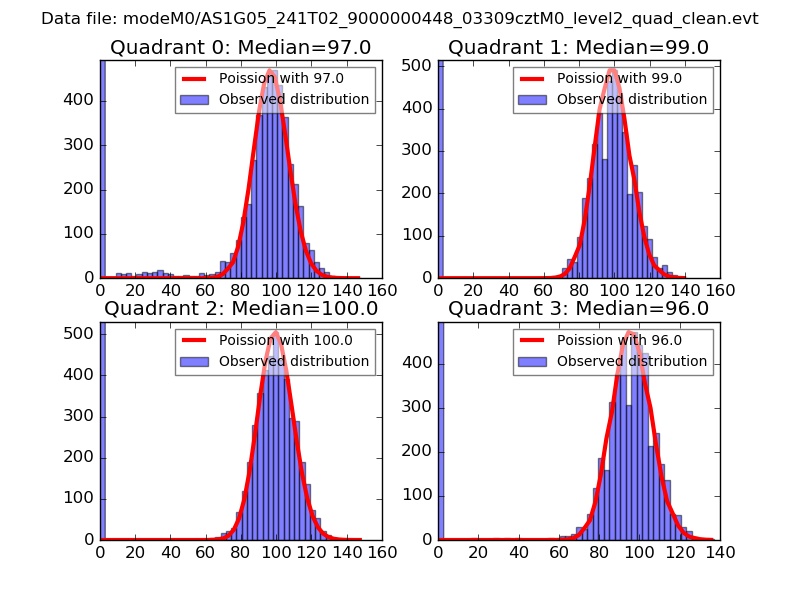 |
 |
| Quadrant-wise count rates Data is divided into 100 sec bins |
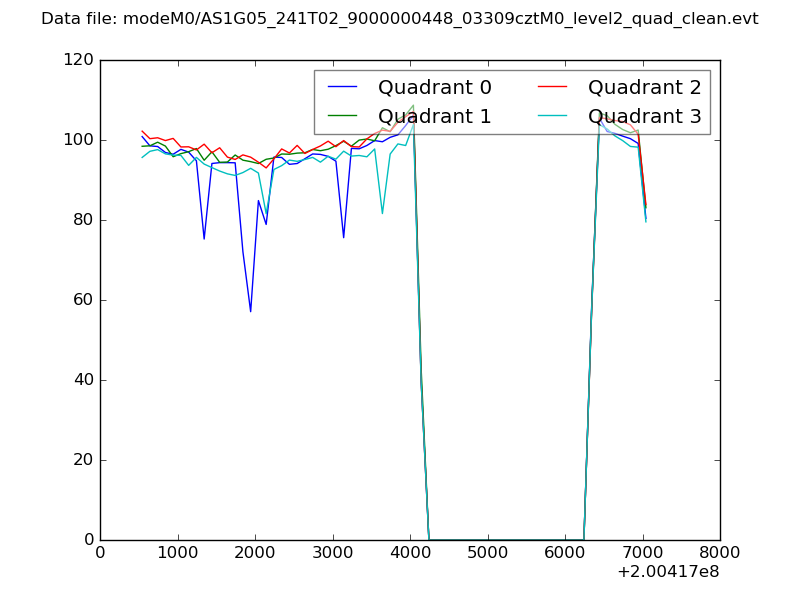 |
|
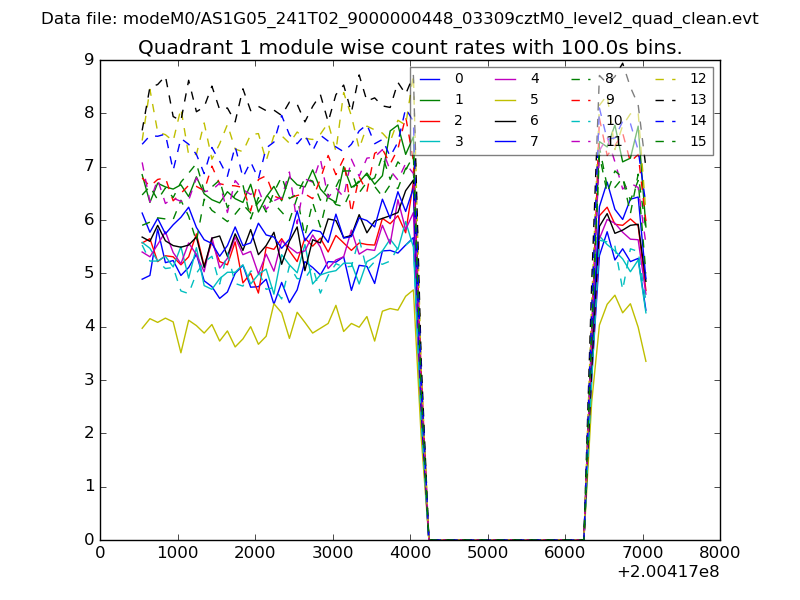
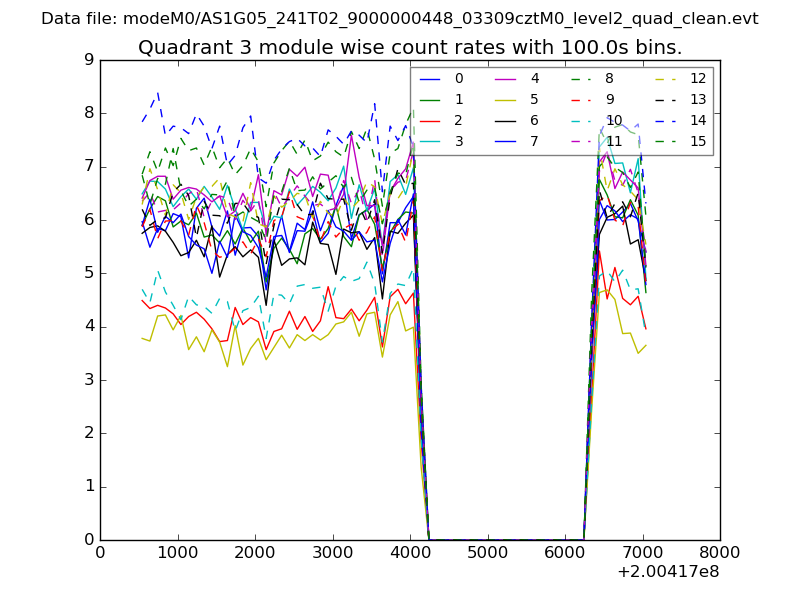
| Module-wise count rates for Quadrant A Data is divided into 100 sec bins |
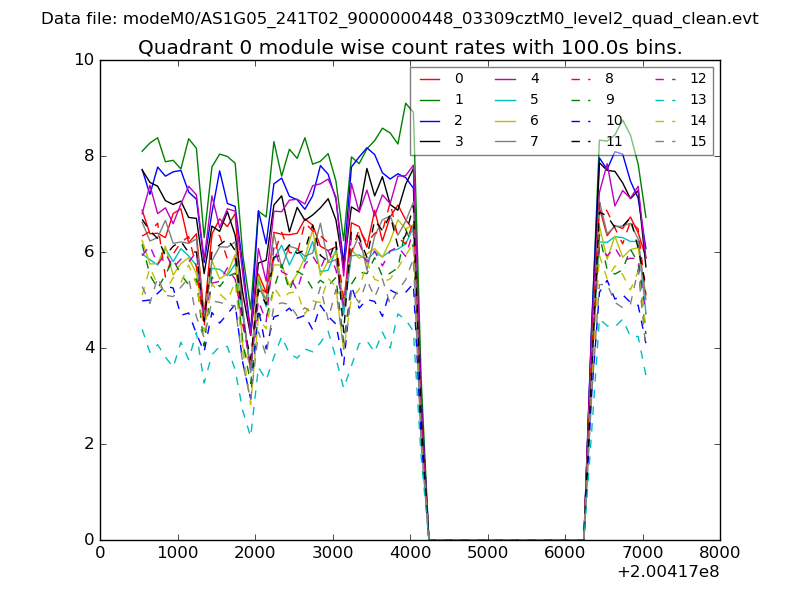 |
 |
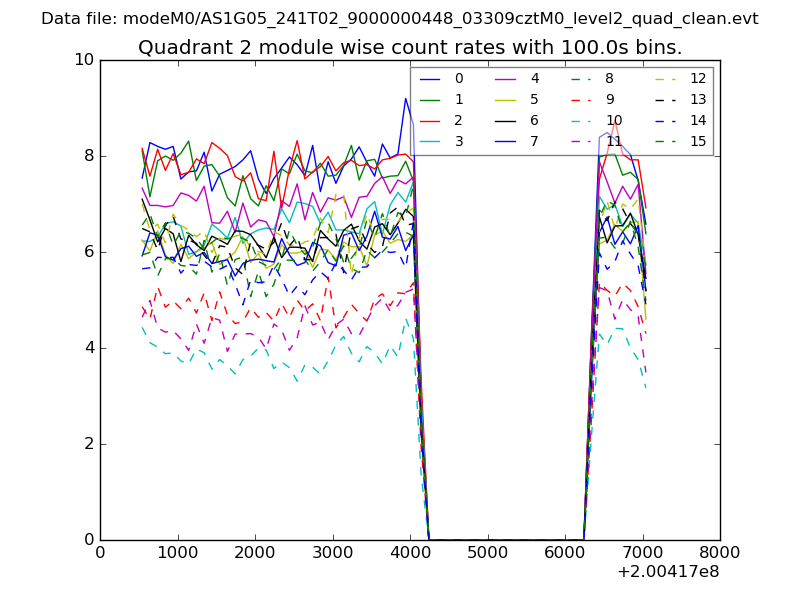
| Module-wise count rates for Quadrant B Data is divided into 100 sec bins |
 |
 |
| Module-wise count rates for Quadrant C Data is divided into 100 sec bins |
 |
 |
| Module-wise count rates for Quadrant D Data is divided into 100 sec bins |
 |
 |
| Parameter | Plot |
|---|---|
| CZT HV Monitor |  |
| D_VDD | 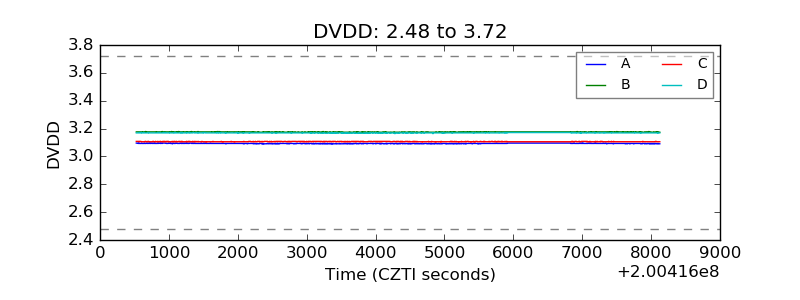 |
| Temperature 1 | 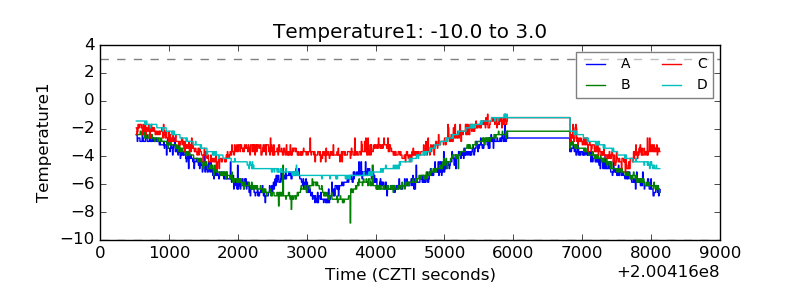 |
| Veto HV Monitor | 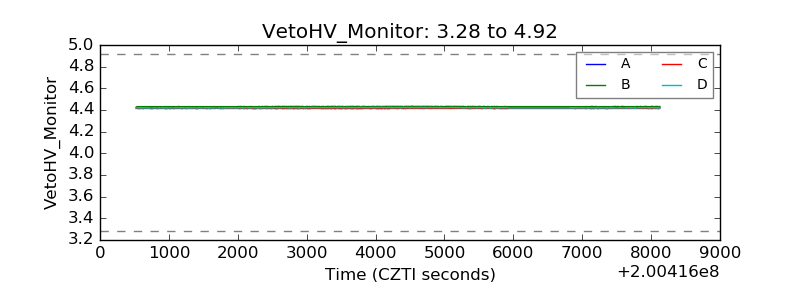 |
| Veto LLD | 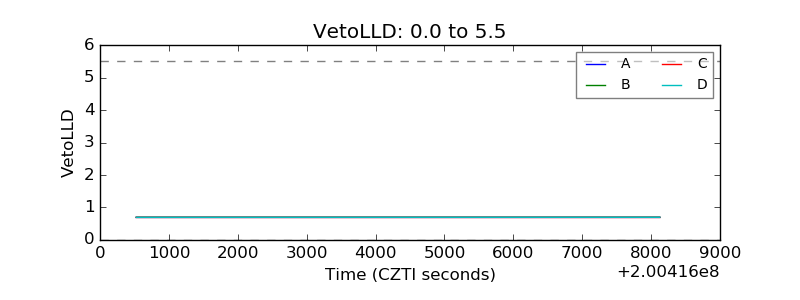 |
| Alpha Counter | 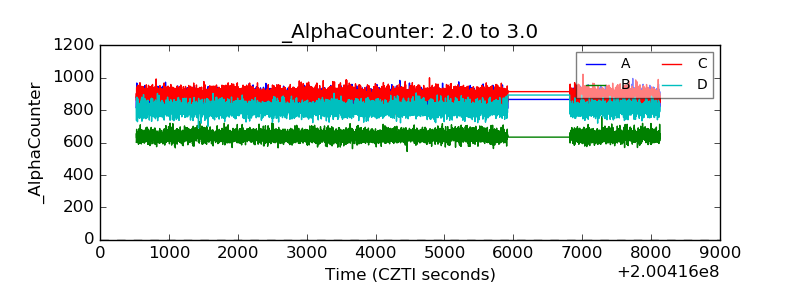 |
| _CPM_Rate | 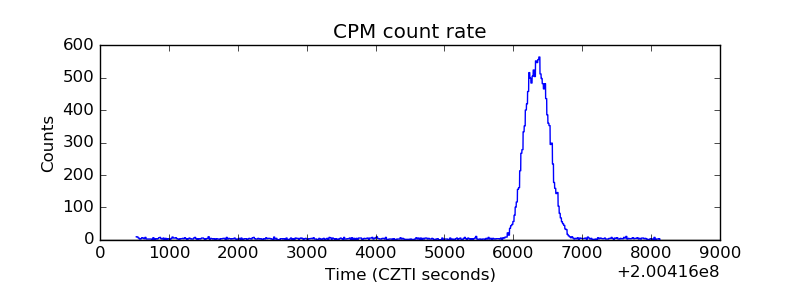 |
| CZT Counter | 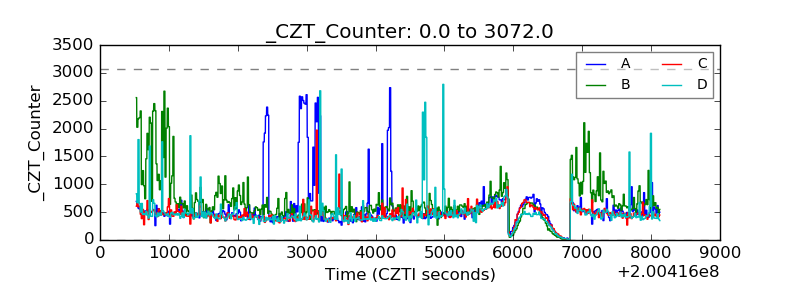 |
| +2.5 Volts monitor |  |
| +5 Volts monitor |  |
| _ROLL_ROT | 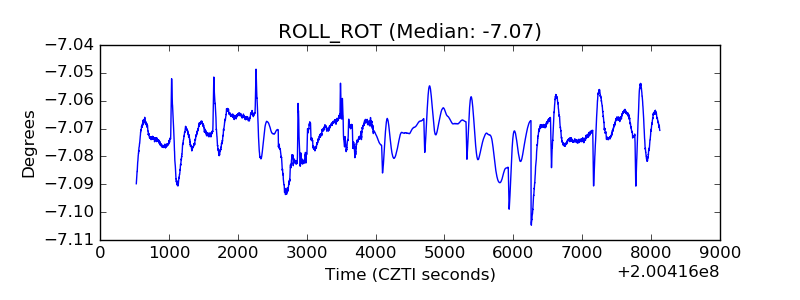 |
| _Roll_DEC | 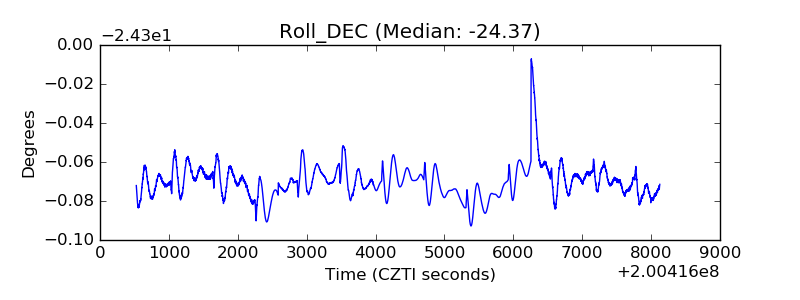 |
| _Roll_RA | 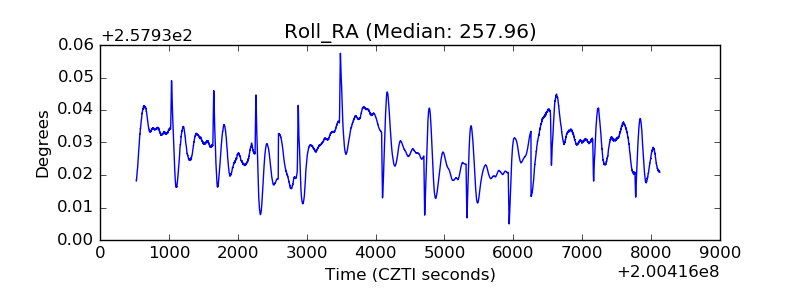 |
| Veto Counter | 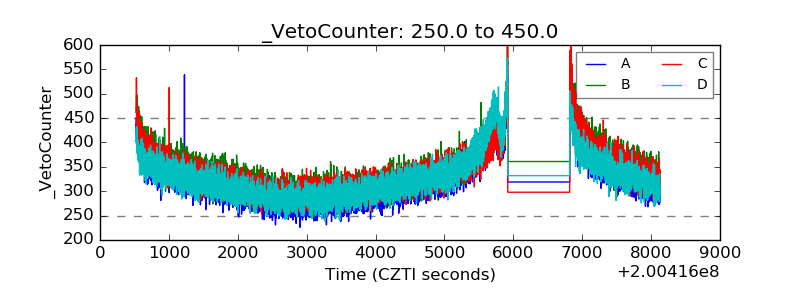 |