| Param | Original file | Final file |
|---|---|---|
| Filename | modeM0/AS1G05_241T02_9000000448_03310cztM0_level2.evt | modeM0/AS1G05_241T02_9000000448_03310cztM0_level2_quad_clean.evt |
| Size (bytes) | 512,303,040 | 78,220,800 |
| Size | 488.6 MB | 74.6 MB |
| Events in quadrant A | 3,597,321 | 475,001 |
| Events in quadrant B | 4,660,084 | 484,304 |
| Events in quadrant C | 3,097,390 | 484,641 |
| Events in quadrant D | 3,705,539 | 457,282 |
| Mode M0 | |||
|---|---|---|---|
| Quadrant | BADHDUFLAG | Total packets | Discarded packets |
| A | 0 | 15335 | 3 |
| B | 0 | 18467 | 2 |
| C | 0 | 13946 | 2 |
| D | 0 | 16033 | 2 |
| Mode SS | |||
|---|---|---|---|
| Quadrant | BADHDUFLAG | Total packets | Discarded packets |
| A | 0 | 138 | 0 |
| B | 0 | 138 | 0 |
| C | 0 | 138 | 0 |
| D | 0 | 138 | 0 |
| Mode M9 | |||
|---|---|---|---|
| Quadrant | BADHDUFLAG | Total packets | Discarded packets |
| A | 0 | 20 | 0 |
| B | 0 | 20 | 0 |
| C | 0 | 20 | 0 |
| D | 0 | 20 | 0 |
| Quadrant | Total seconds | Saturated seconds | Saturation percentage |
|---|---|---|---|
| A | 6702 | 131 | 1.954640% |
| B | 6702 | 149 | 2.223217% |
| C | 6702 | 28 | 0.417786% |
| D | 6702 | 229 | 3.416890% |
Noise dominated data is calculated using 1-second bins in cleaned event files. If a bin has >2000 counts, and if more than 50% of those come from <1% of pixels, then it is considered to be noise-dominated and hence unusable.
| Quadrant | # 1 sec bins | Bins with >0 counts | Bins with >2000 counts | High rate bins dominated by noise | Noise dominated (total time) | Noise dominated (detector-on time) | Marked lightcurve |
|---|---|---|---|---|---|---|---|
| A | 8662 | 6704 | 72 | 72 | 0.83% | 1.07% | 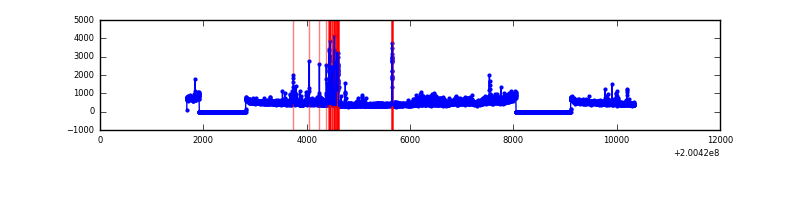 |
| B | 8662 | 6704 | 9 | 9 | 0.10% | 0.13% | 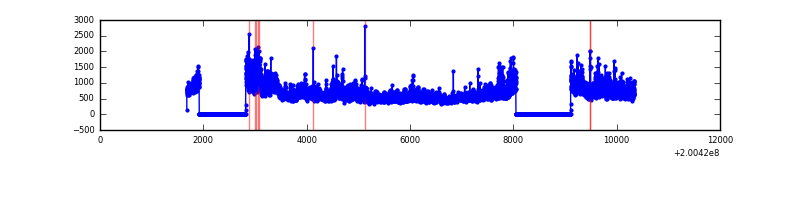 |
| C | 8662 | 6704 | 1 | 1 | 0.01% | 0.01% | 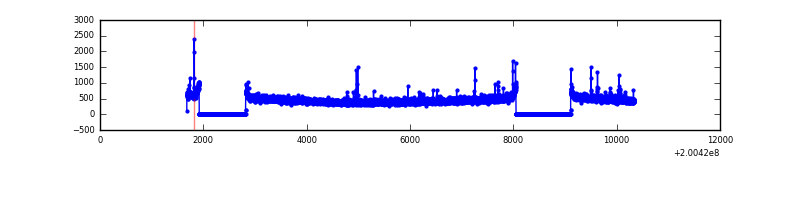 |
| D | 8662 | 6704 | 176 | 176 | 2.03% | 2.63% | 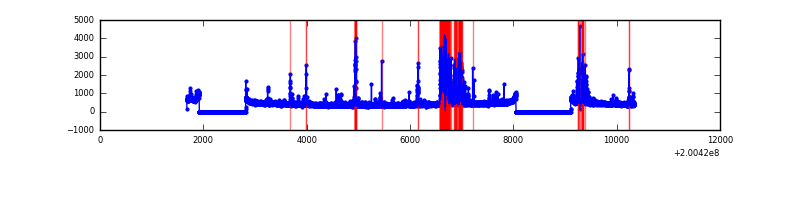 |
Top three noisy pixels from each quadrant. If the there are fewer than three noisy pixels in the level2.evt file, extra rows are filled as -1
| Pixel properties | Quadrant properties | ||||||
|---|---|---|---|---|---|---|---|
| Quadrant | DetID | PixID | Counts | Sigma | Mean | Median | Sigma |
| A | 8 | 15 | 256178 | 1564.78 | 792 | 773 | 163.2 |
| A | 0 | 50 | 254053 | 1551.76 | 792 | 773 | 163.2 |
| A | 0 | 118 | 28832 | 171.91 | 792 | 773 | 163.2 |
| B | 15 | 204 | 1462438 | 9395.98 | 801 | 781 | 155.6 |
| B | 15 | 85 | 28853 | 180.45 | 801 | 781 | 155.6 |
| B | 2 | 249 | 25890 | 161.41 | 801 | 781 | 155.6 |
| C | 12 | 4 | 20904 | 109.32 | 773 | 779 | 184.1 |
| C | 1 | 16 | 11337 | 57.35 | 773 | 779 | 184.1 |
| C | 6 | 80 | 11032 | 55.7 | 773 | 779 | 184.1 |
| D | 13 | 223 | 483190 | 2600.03 | 760 | 737 | 185.6 |
| D | 12 | 233 | 230179 | 1236.5 | 760 | 737 | 185.6 |
| D | 10 | 172 | 40357 | 213.52 | 760 | 737 | 185.6 |
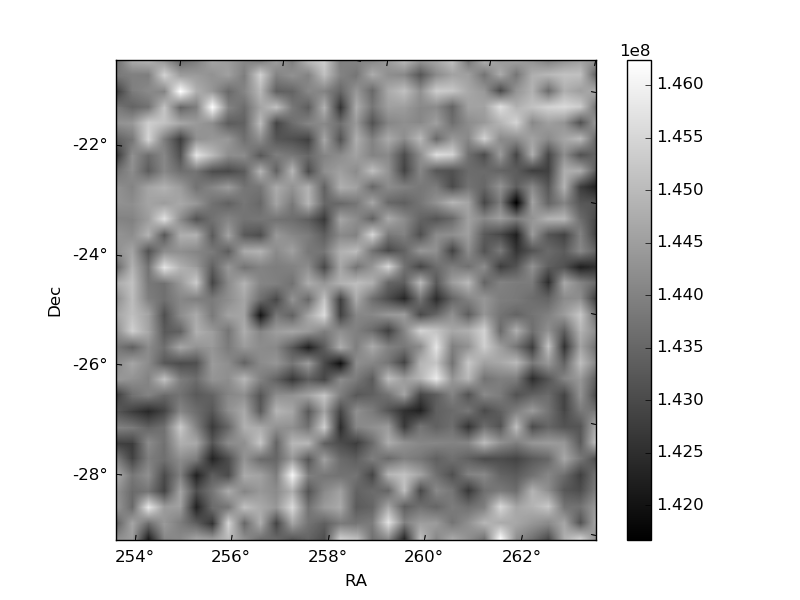
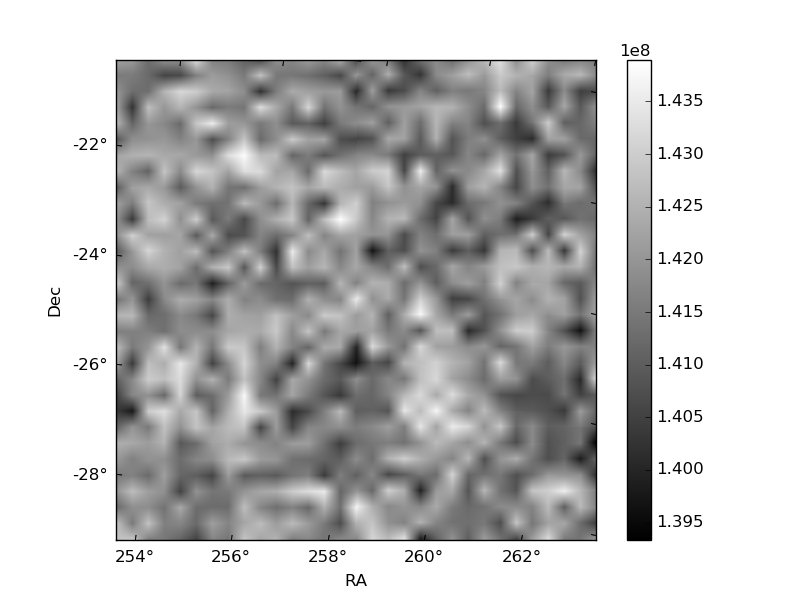
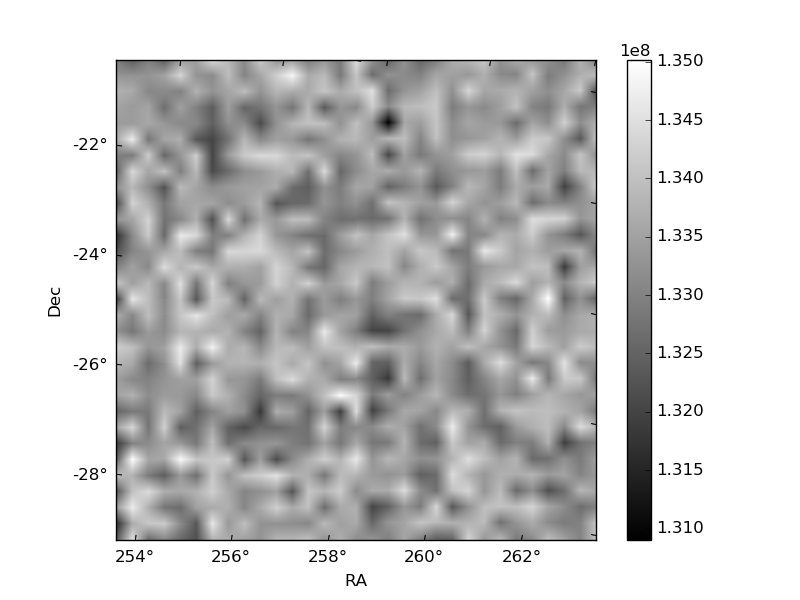
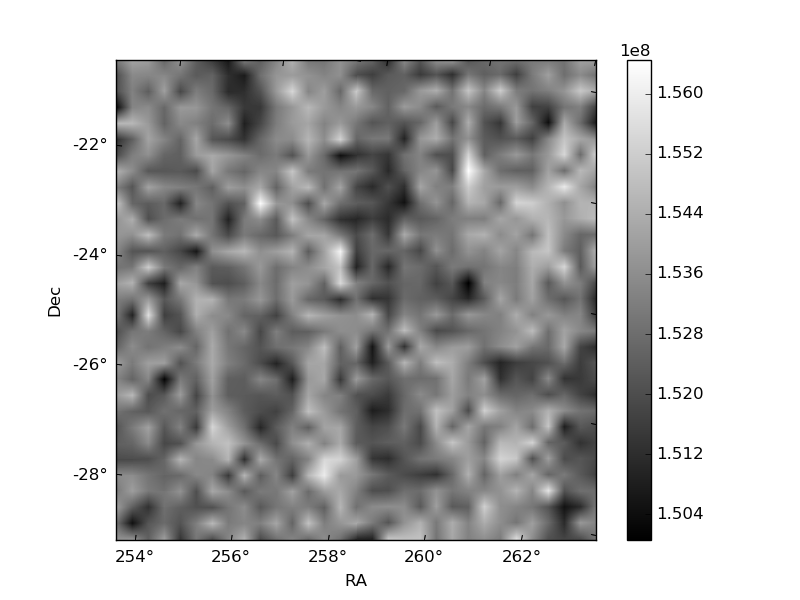
Histogram calculated using DETX and DETY for each event in the final _common_clean file
| Quadrant A | 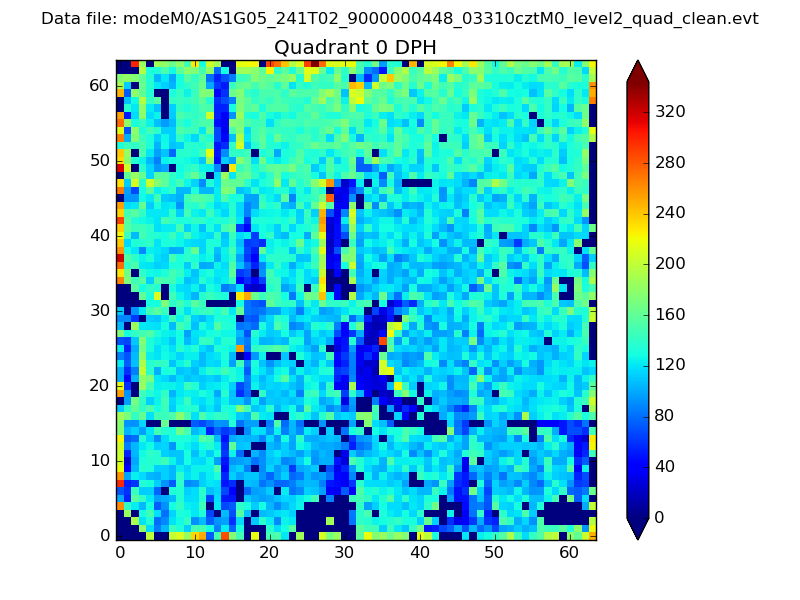 |
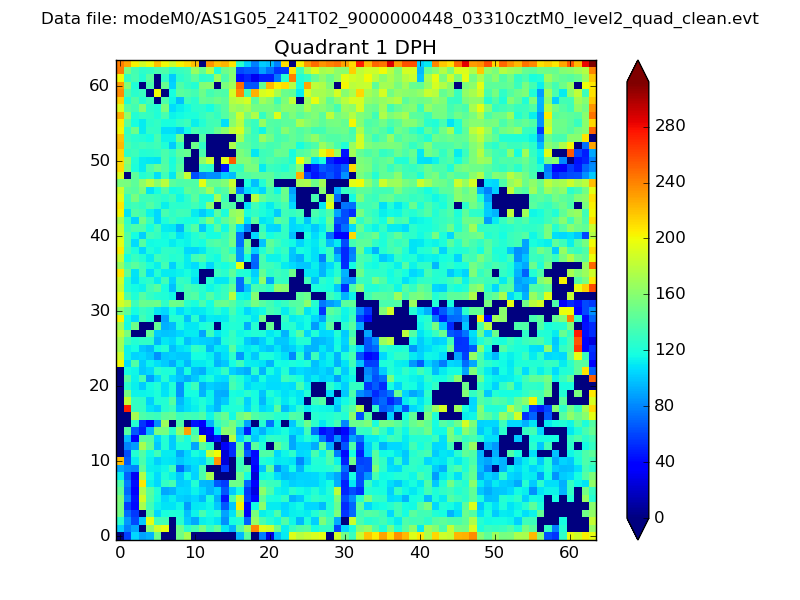 |
Quadrant B |
|---|---|---|---|
| Quadrant D | 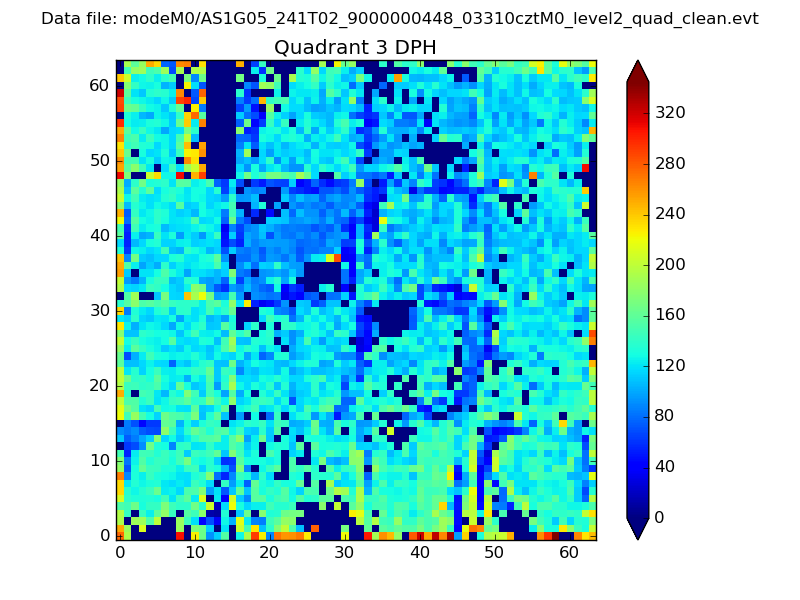 |
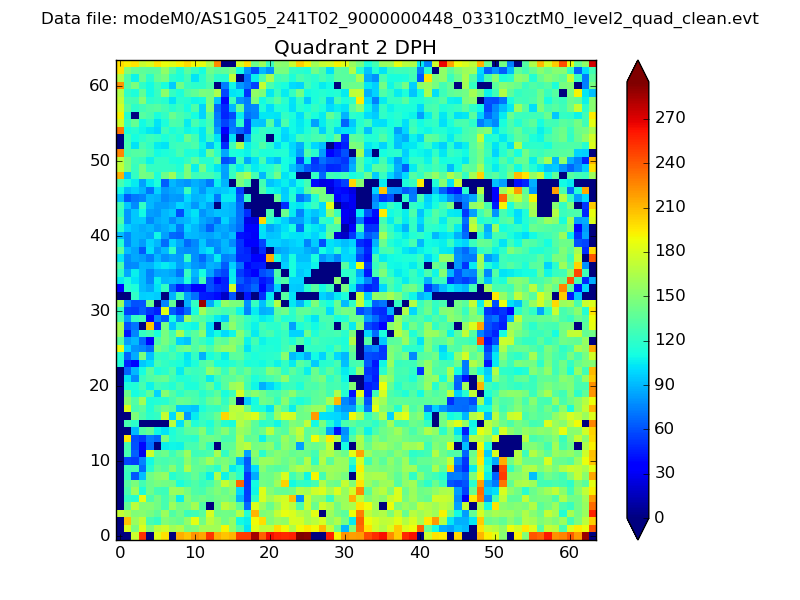 |
Quadrant C |
| Plot type | Count rate plots | Images |
|---|---|---|
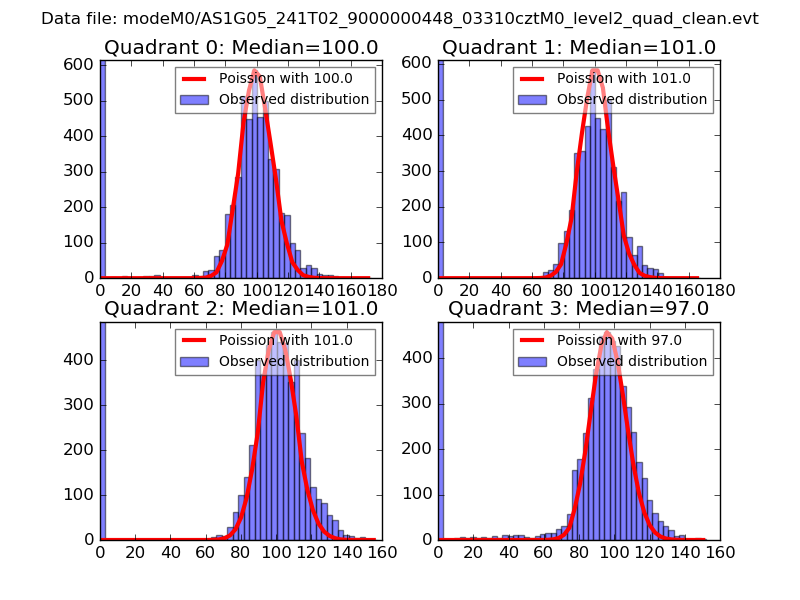
| Comparison with Poisson distribution Blue bars denote a histogram of data divided into 1 sec bins. Red curve is a Poisson curve with rate = median count rate of data. |
 |
 |
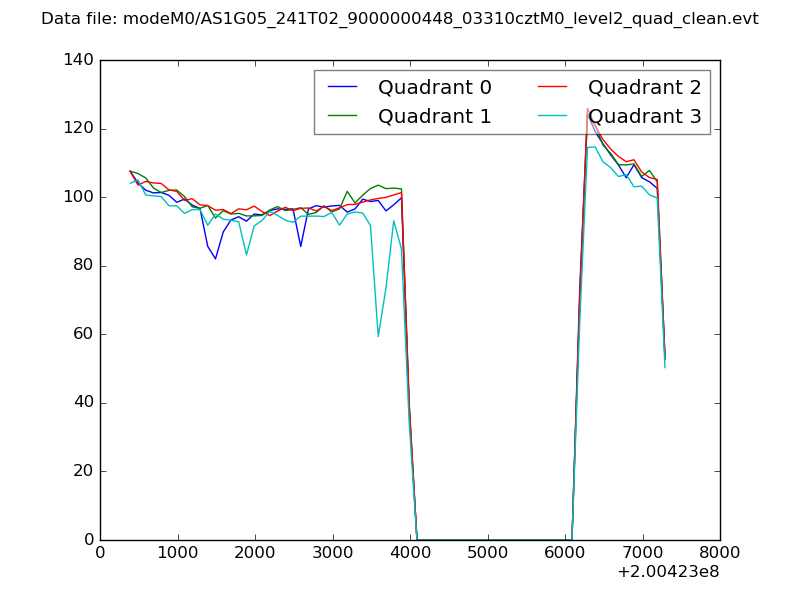
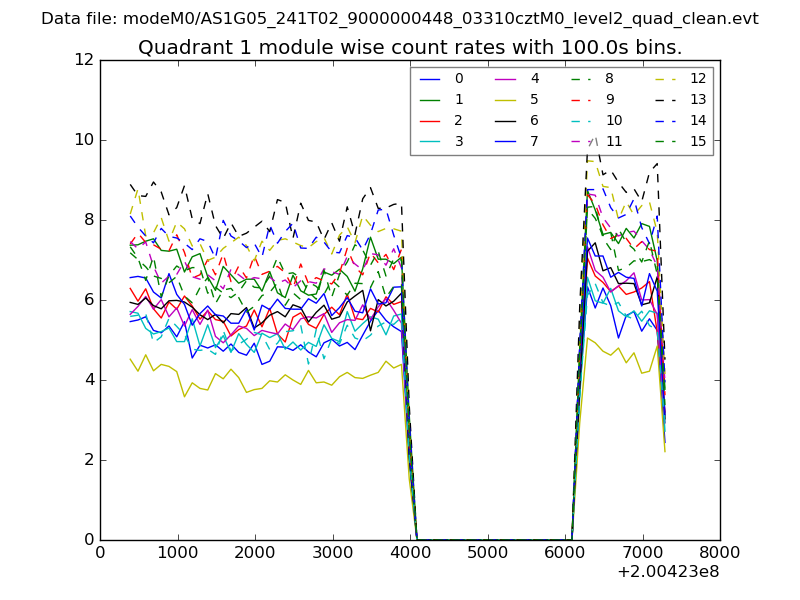
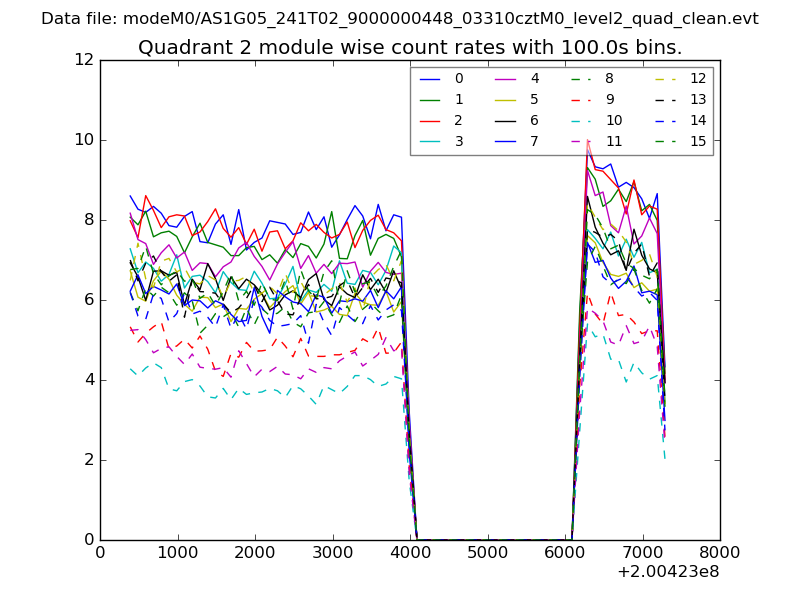
| Quadrant-wise count rates Data is divided into 100 sec bins |
 |
|
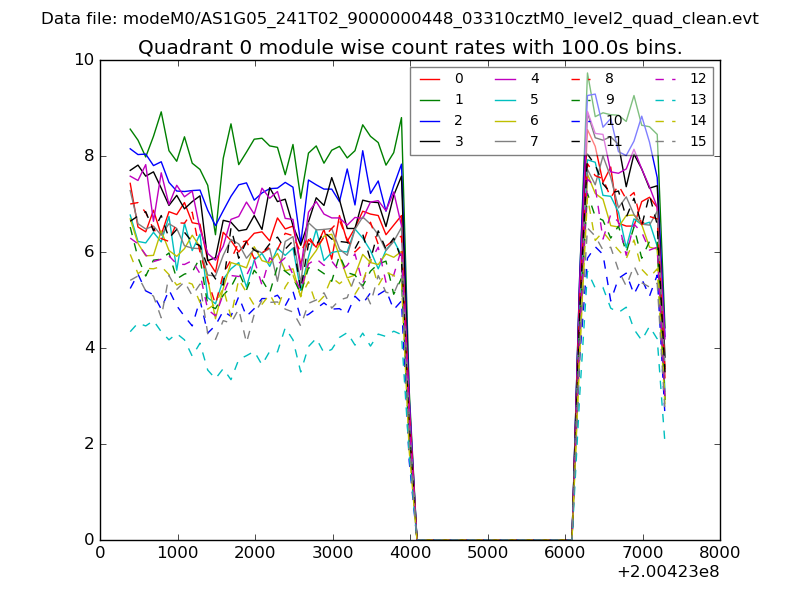
| Module-wise count rates for Quadrant A Data is divided into 100 sec bins |
 |
 |
| Module-wise count rates for Quadrant B Data is divided into 100 sec bins |
 |
 |
| Module-wise count rates for Quadrant C Data is divided into 100 sec bins |
 |
 |
| Module-wise count rates for Quadrant D Data is divided into 100 sec bins |
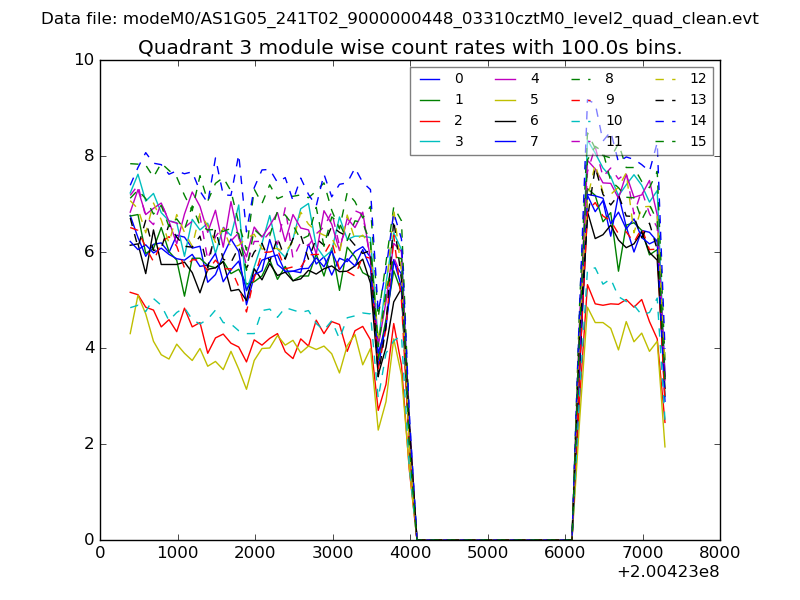 |
 |
| Parameter | Plot |
|---|---|
| CZT HV Monitor | 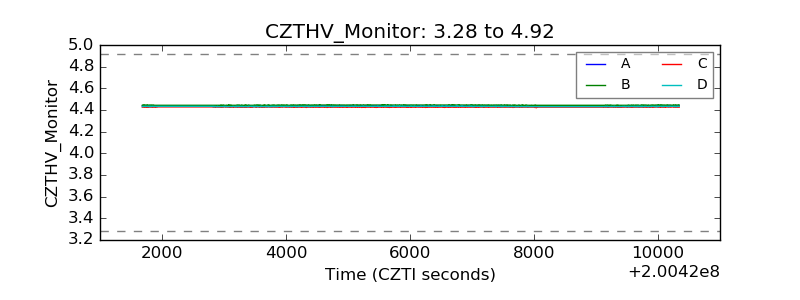 |
| D_VDD | 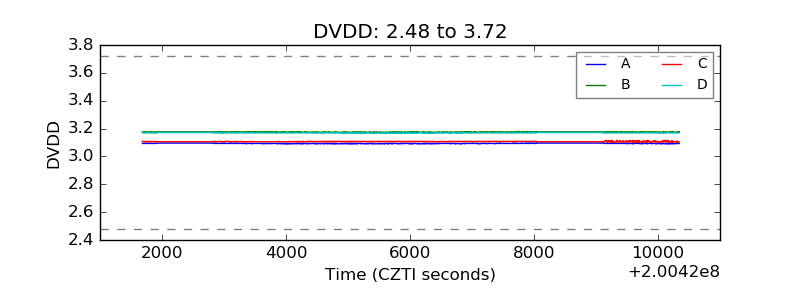 |
| Temperature 1 |  |
| Veto HV Monitor | 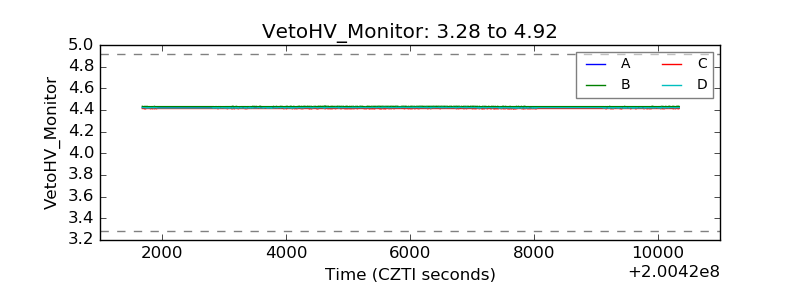 |
| Veto LLD | 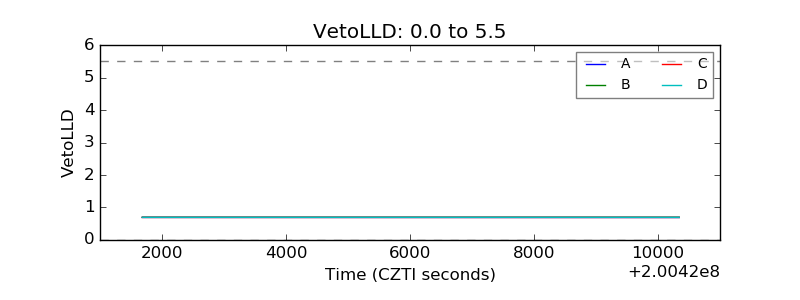 |
| Alpha Counter | 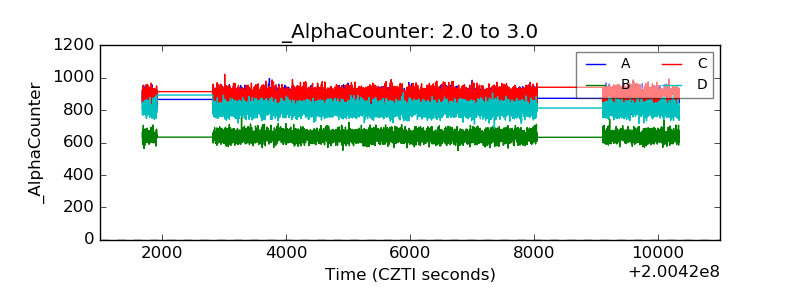 |
| _CPM_Rate | 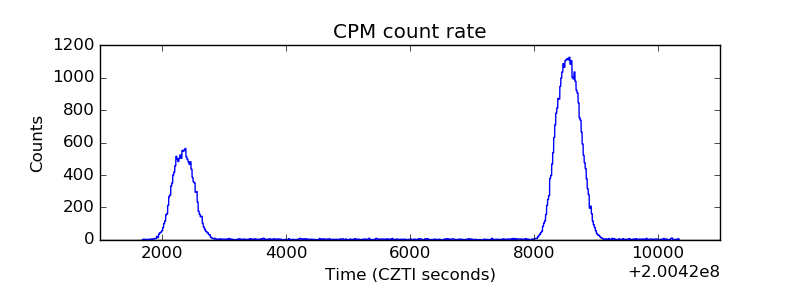 |
| CZT Counter | 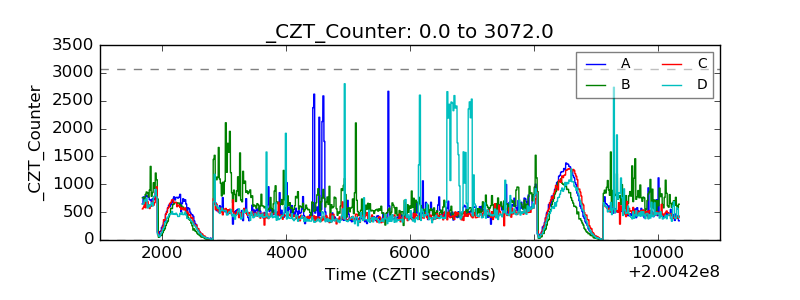 |
| +2.5 Volts monitor | 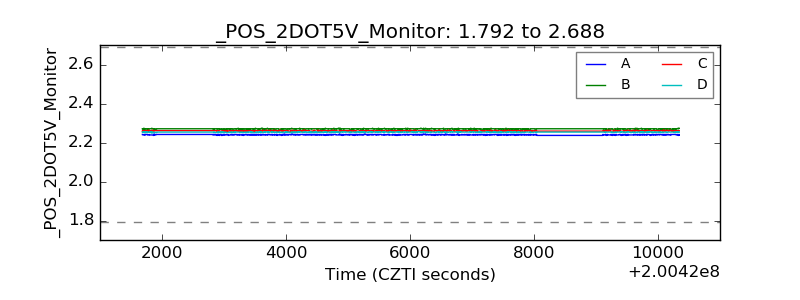 |
| +5 Volts monitor | 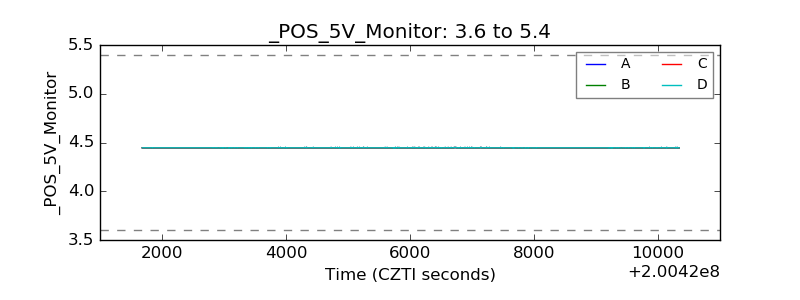 |
| _ROLL_ROT | 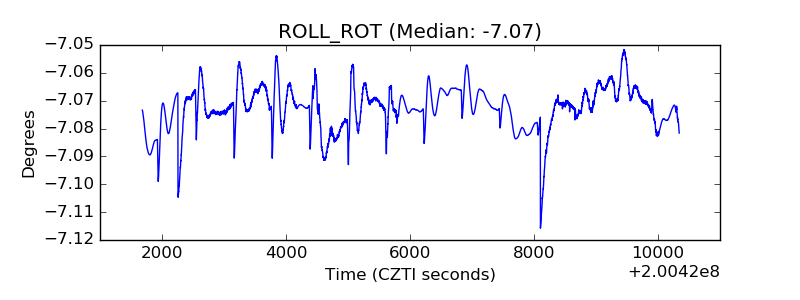 |
| _Roll_DEC | 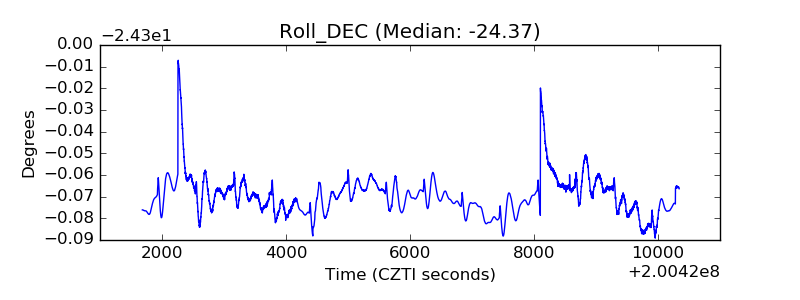 |
| _Roll_RA | 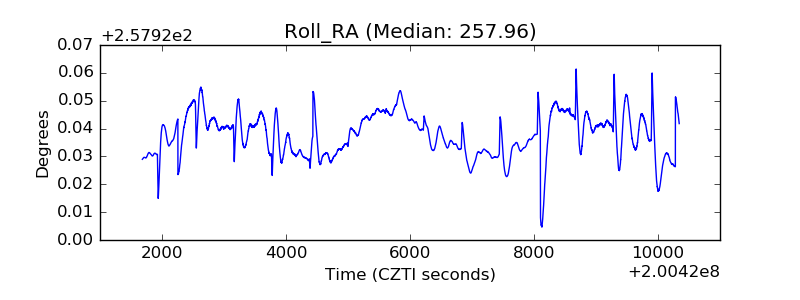 |
| Veto Counter | 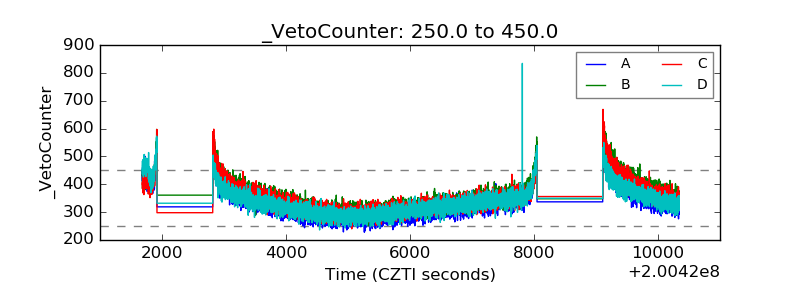 |