| Param | Original file | Final file |
|---|---|---|
| Filename | modeM0/AS1G05_241T02_9000000448_03313cztM0_level2.evt | modeM0/AS1G05_241T02_9000000448_03313cztM0_level2_quad_clean.evt |
| Size (bytes) | 522,912,960 | 91,673,280 |
| Size | 498.7 MB | 87.4 MB |
| Events in quadrant A | 3,587,934 | 558,108 |
| Events in quadrant B | 4,266,542 | 573,290 |
| Events in quadrant C | 3,652,489 | 572,973 |
| Events in quadrant D | 3,809,811 | 539,296 |
| Mode M0 | |||
|---|---|---|---|
| Quadrant | BADHDUFLAG | Total packets | Discarded packets |
| A | 0 | 15927 | 3 |
| B | 0 | 17720 | 2 |
| C | 0 | 15988 | 2 |
| D | 0 | 16784 | 2 |
| Mode SS | |||
|---|---|---|---|
| Quadrant | BADHDUFLAG | Total packets | Discarded packets |
| A | 0 | 158 | 0 |
| B | 0 | 158 | 0 |
| C | 0 | 158 | 0 |
| D | 0 | 158 | 0 |
| Mode M9 | |||
|---|---|---|---|
| Quadrant | BADHDUFLAG | Total packets | Discarded packets |
| A | 0 | 23 | 0 |
| B | 0 | 23 | 0 |
| C | 0 | 23 | 0 |
| D | 0 | 23 | 0 |
| Quadrant | Total seconds | Saturated seconds | Saturation percentage |
|---|---|---|---|
| A | 7652 | 48 | 0.627287% |
| B | 7652 | 93 | 1.215369% |
| C | 7652 | 32 | 0.418191% |
| D | 7652 | 92 | 1.202300% |
Noise dominated data is calculated using 1-second bins in cleaned event files. If a bin has >2000 counts, and if more than 50% of those come from <1% of pixels, then it is considered to be noise-dominated and hence unusable.
| Quadrant | # 1 sec bins | Bins with >0 counts | Bins with >2000 counts | High rate bins dominated by noise | Noise dominated (total time) | Noise dominated (detector-on time) | Marked lightcurve |
|---|---|---|---|---|---|---|---|
| A | 9992 | 7654 | 7 | 7 | 0.07% | 0.09% | 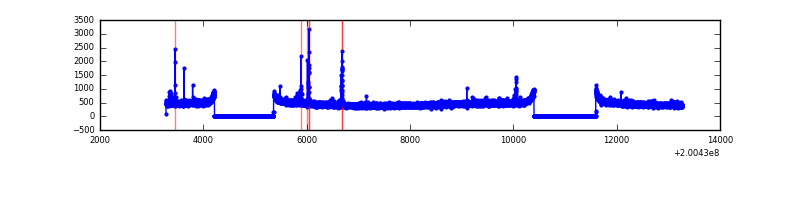 |
| B | 9992 | 7654 | 1 | 1 | 0.01% | 0.01% | 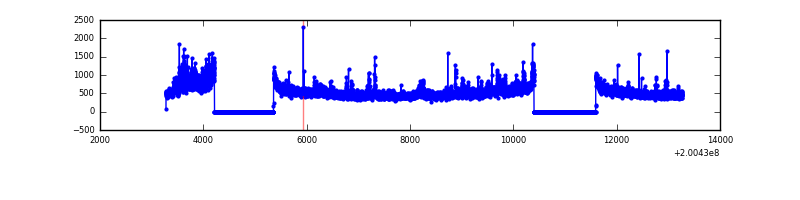 |
| C | 9992 | 7654 | 3 | 3 | 0.03% | 0.04% | 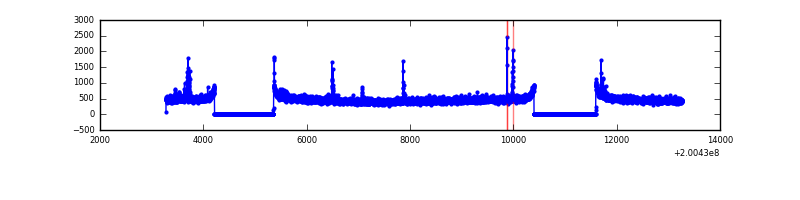 |
| D | 9992 | 7654 | 60 | 60 | 0.60% | 0.78% | 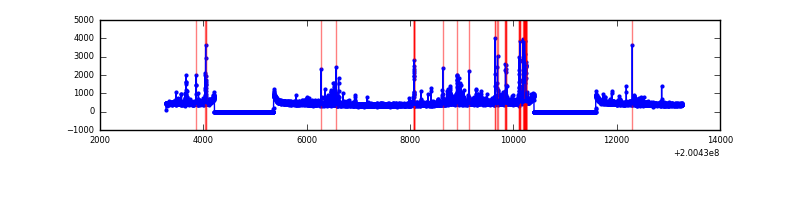 |
Top three noisy pixels from each quadrant. If the there are fewer than three noisy pixels in the level2.evt file, extra rows are filled as -1
| Pixel properties | Quadrant properties | ||||||
|---|---|---|---|---|---|---|---|
| Quadrant | DetID | PixID | Counts | Sigma | Mean | Median | Sigma |
| A | 0 | 50 | 46048 | 241.45 | 911 | 890 | 187.0 |
| A | 0 | 118 | 21254 | 108.88 | 911 | 890 | 187.0 |
| A | 0 | 226 | 11275 | 55.53 | 911 | 890 | 187.0 |
| B | 15 | 204 | 543765 | 3045.23 | 930 | 908 | 178.3 |
| B | 14 | 167 | 32383 | 176.56 | 930 | 908 | 178.3 |
| B | 3 | 0 | 31699 | 172.72 | 930 | 908 | 178.3 |
| C | 6 | 80 | 51219 | 235.5 | 903 | 907 | 213.6 |
| C | 14 | 223 | 17372 | 77.07 | 903 | 907 | 213.6 |
| C | 1 | 192 | 16226 | 71.7 | 903 | 907 | 213.6 |
| D | 13 | 223 | 198296 | 917.64 | 881 | 854 | 215.2 |
| D | 12 | 233 | 69521 | 319.14 | 881 | 854 | 215.2 |
| D | 5 | 233 | 48677 | 222.26 | 881 | 854 | 215.2 |
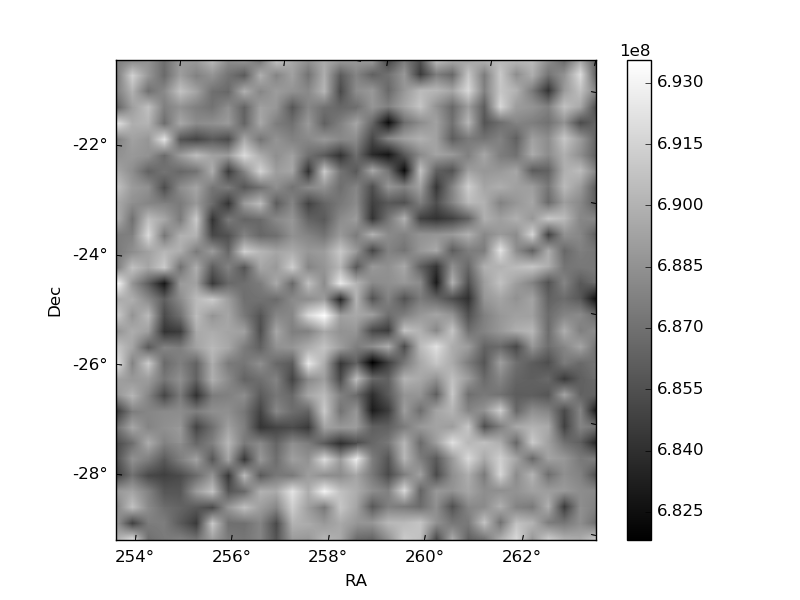
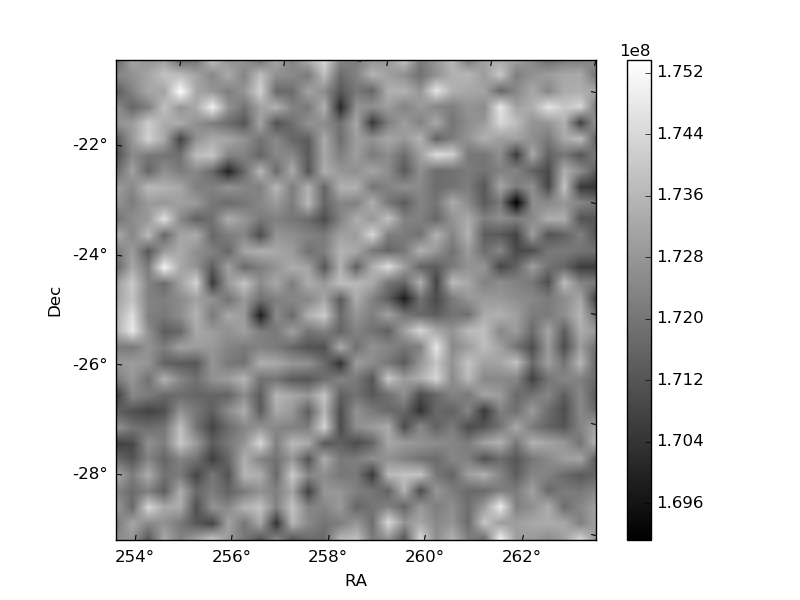
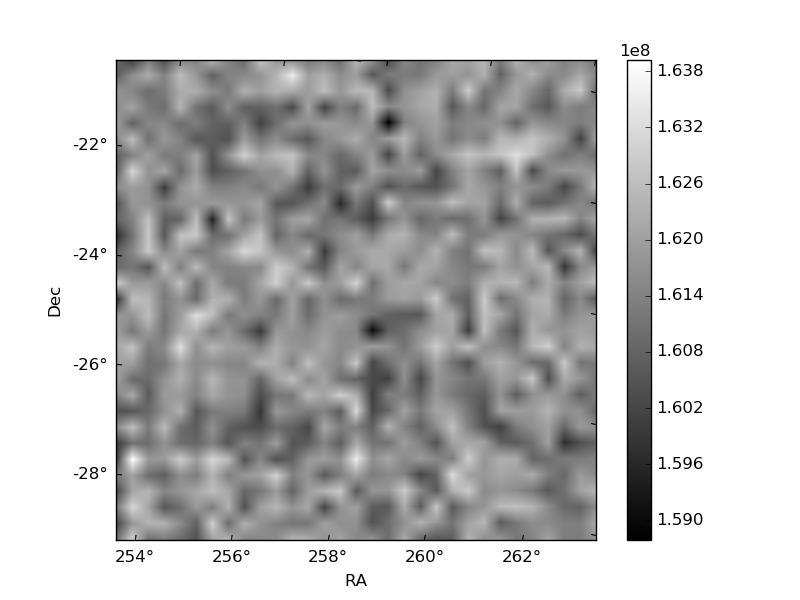
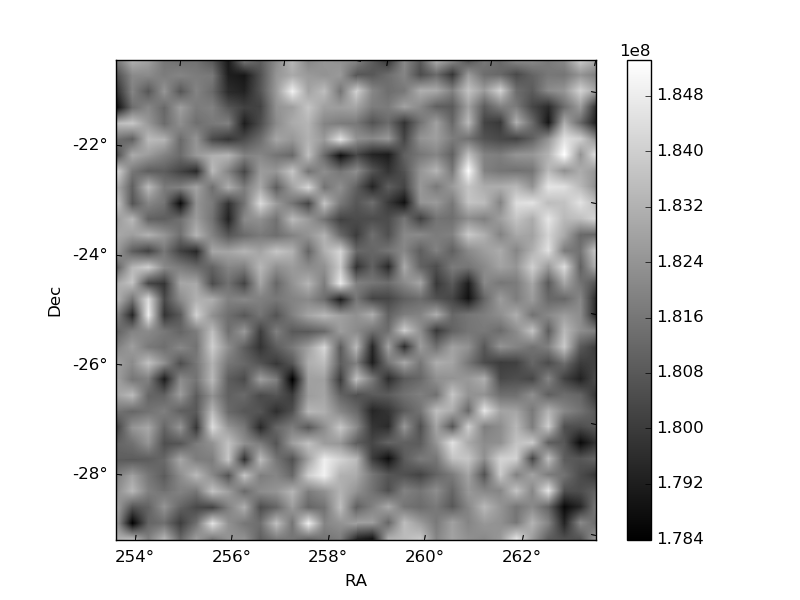
Histogram calculated using DETX and DETY for each event in the final _common_clean file
| Quadrant A | 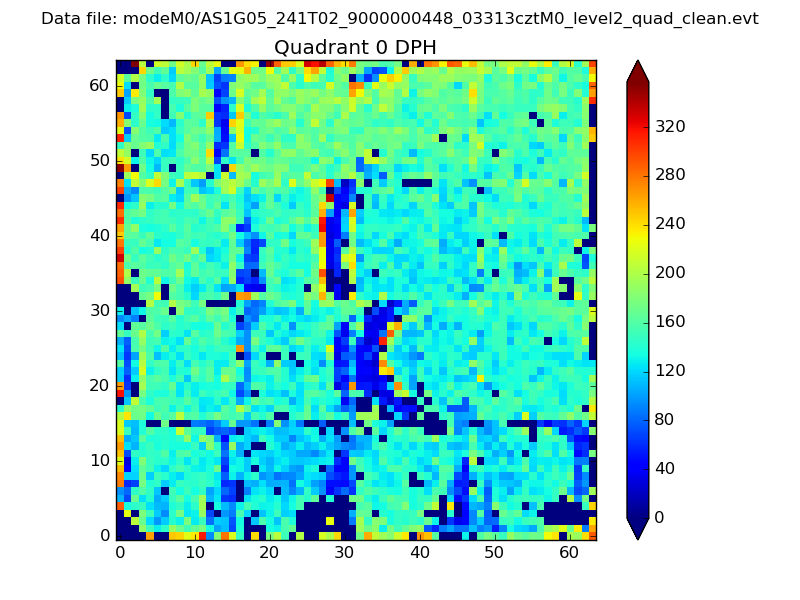 |
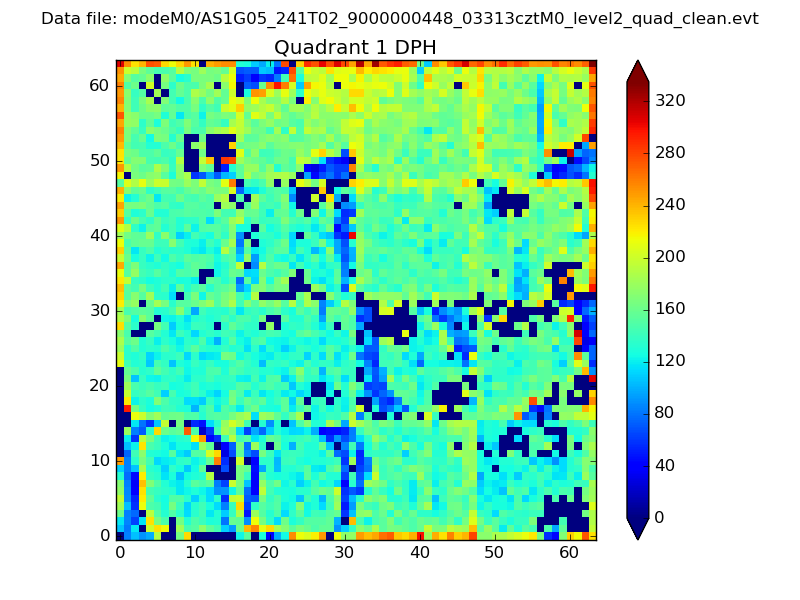 |
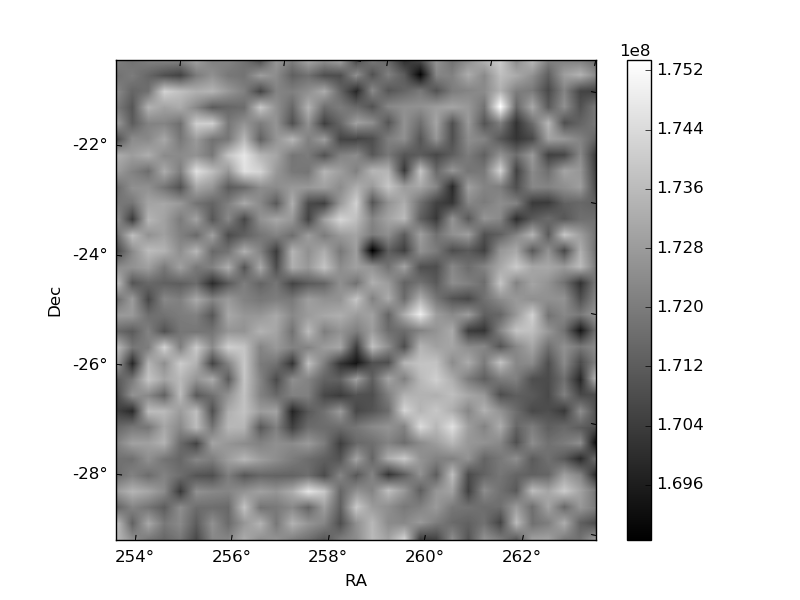
Quadrant B |
|---|---|---|---|
| Quadrant D | 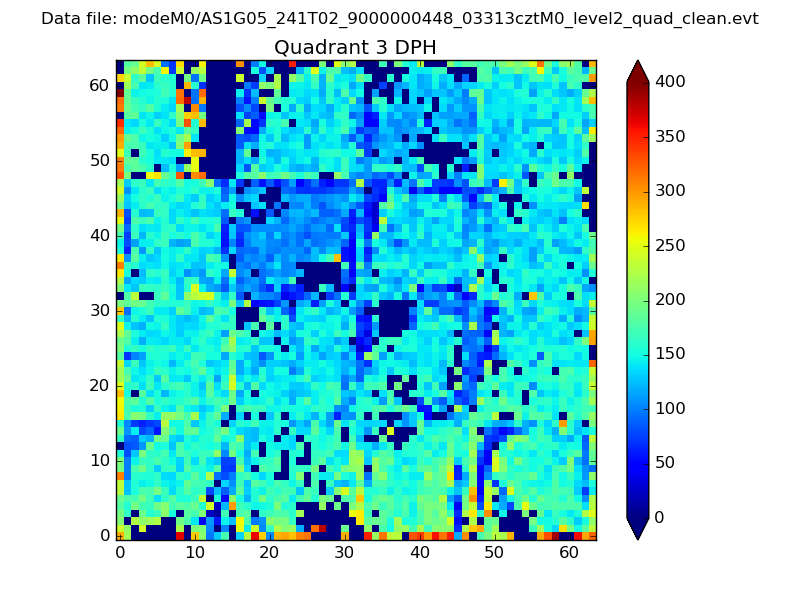 |
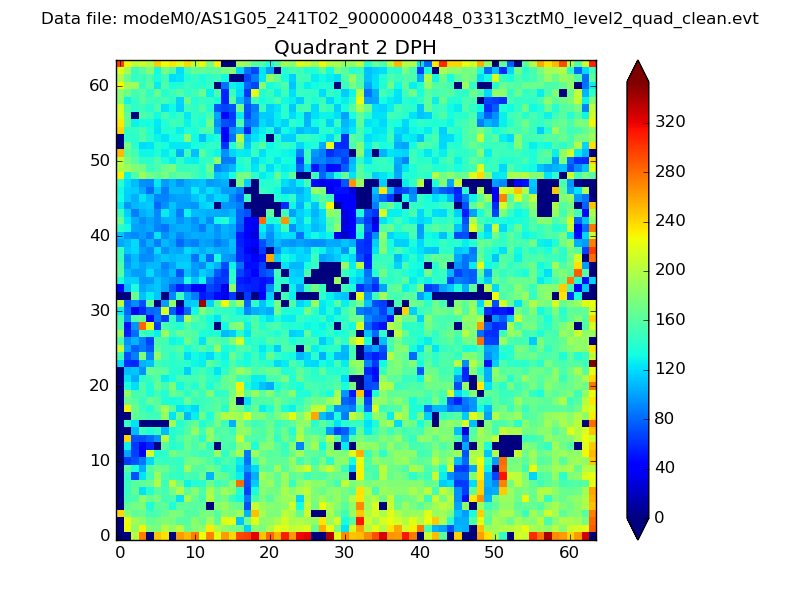 |
Quadrant C |
| Plot type | Count rate plots | Images |
|---|---|---|
| Comparison with Poisson distribution Blue bars denote a histogram of data divided into 1 sec bins. Red curve is a Poisson curve with rate = median count rate of data. |
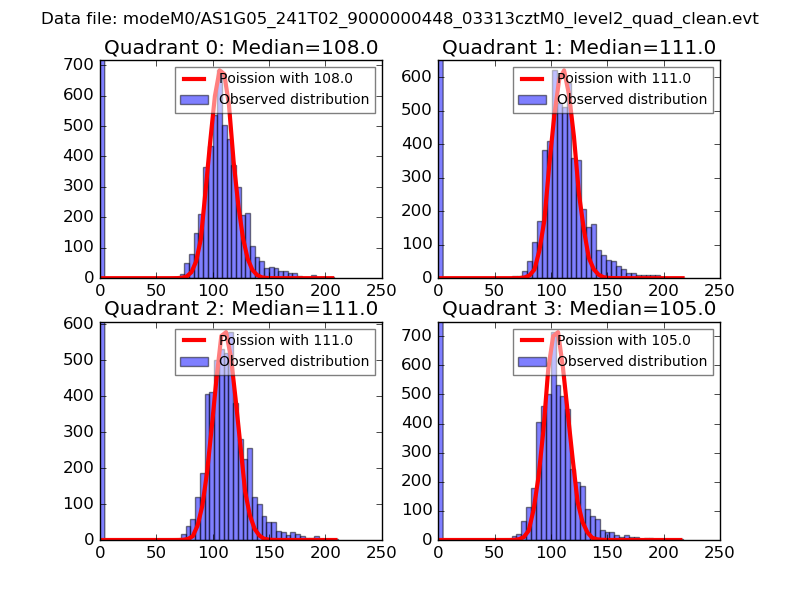 |
 |
| Quadrant-wise count rates Data is divided into 100 sec bins |
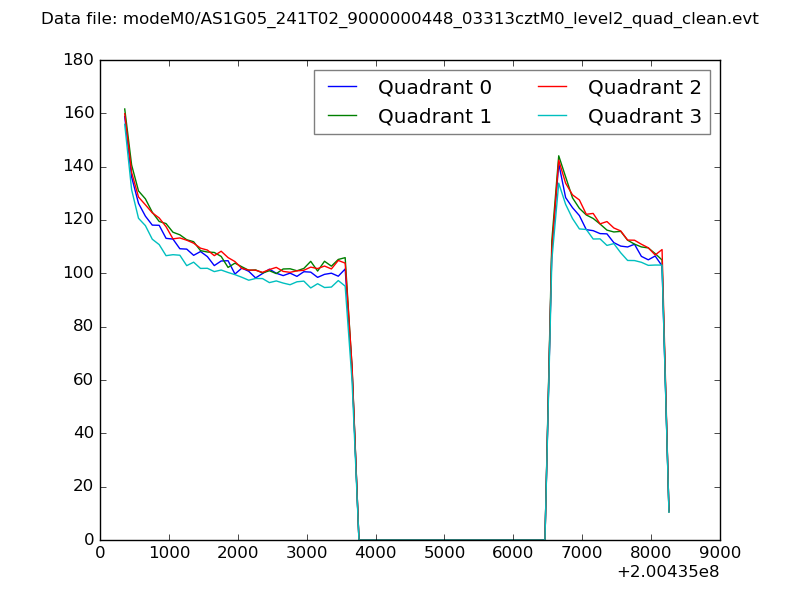 |
|
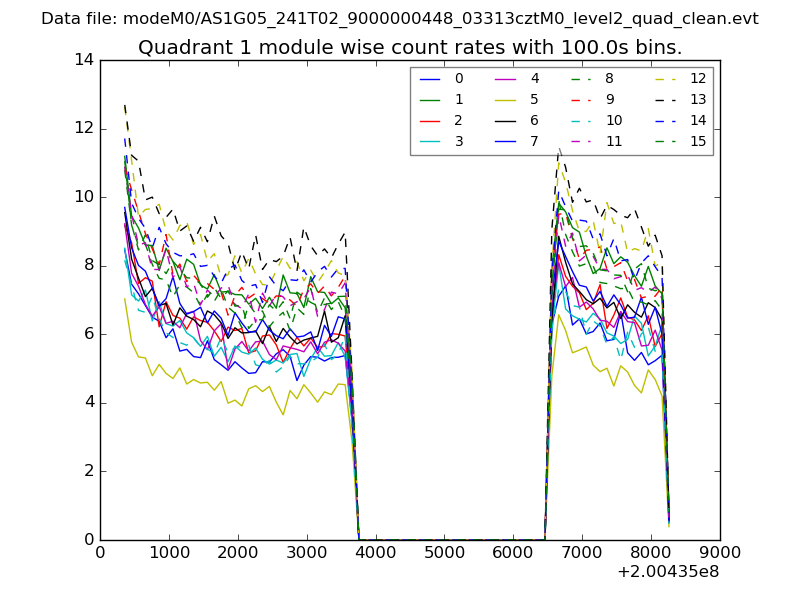
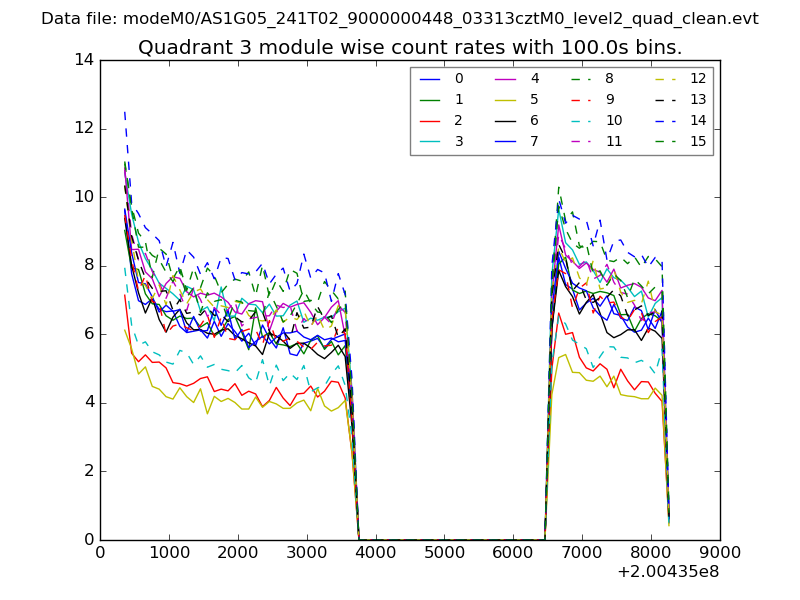
| Module-wise count rates for Quadrant A Data is divided into 100 sec bins |
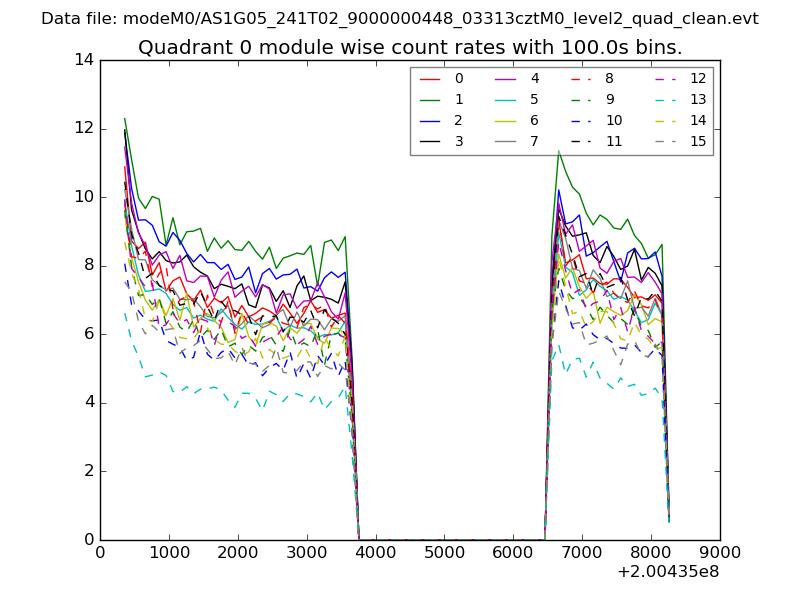 |
 |
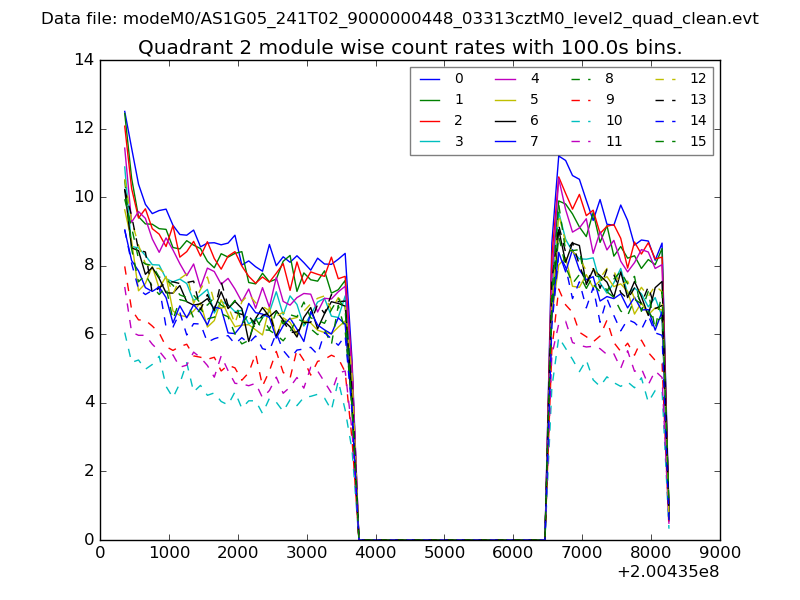
| Module-wise count rates for Quadrant B Data is divided into 100 sec bins |
 |
 |
| Module-wise count rates for Quadrant C Data is divided into 100 sec bins |
 |
 |
| Module-wise count rates for Quadrant D Data is divided into 100 sec bins |
 |
 |
| Parameter | Plot |
|---|---|
| CZT HV Monitor | 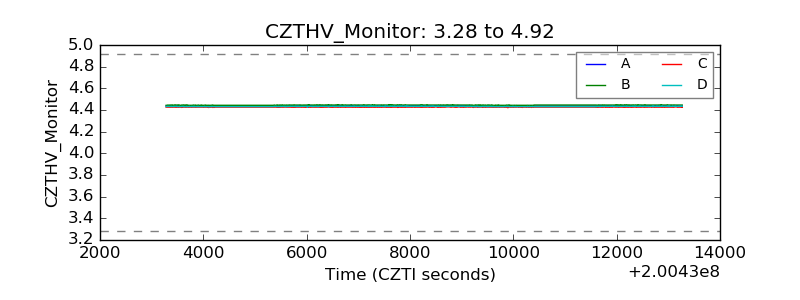 |
| D_VDD | 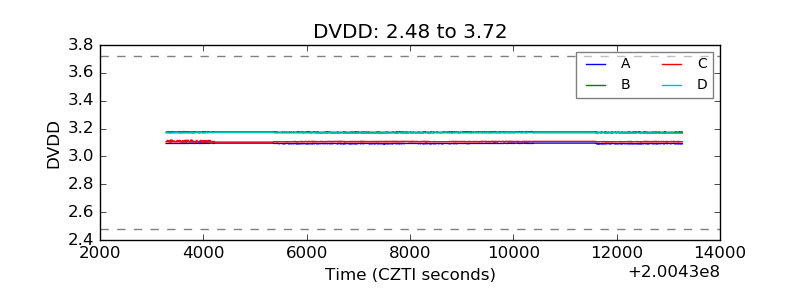 |
| Temperature 1 | 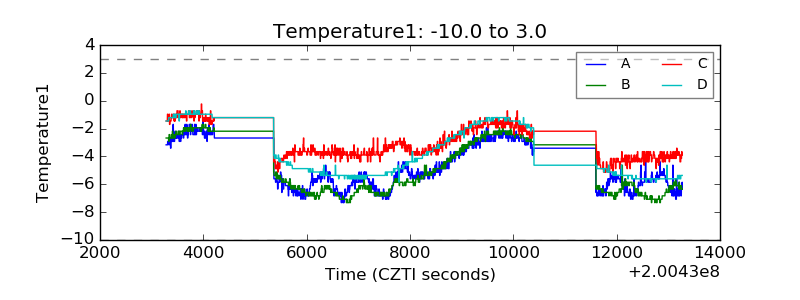 |
| Veto HV Monitor | 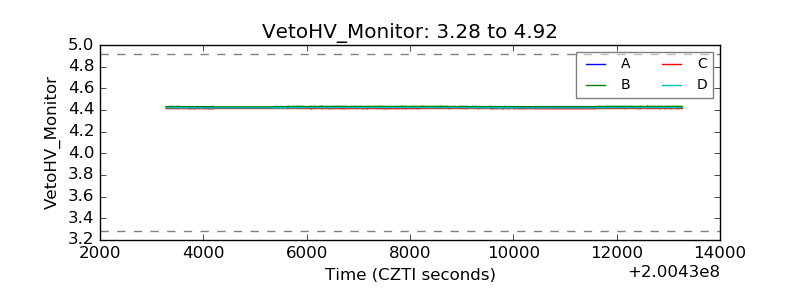 |
| Veto LLD | 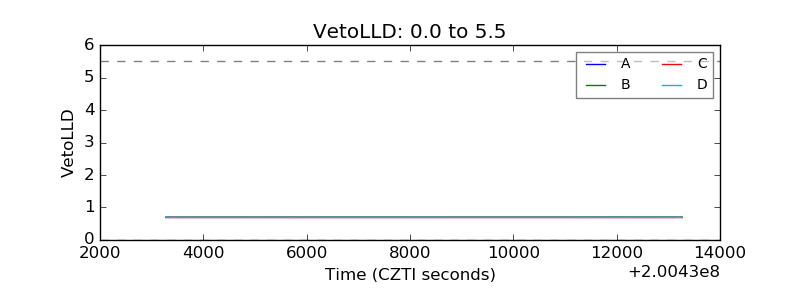 |
| Alpha Counter | 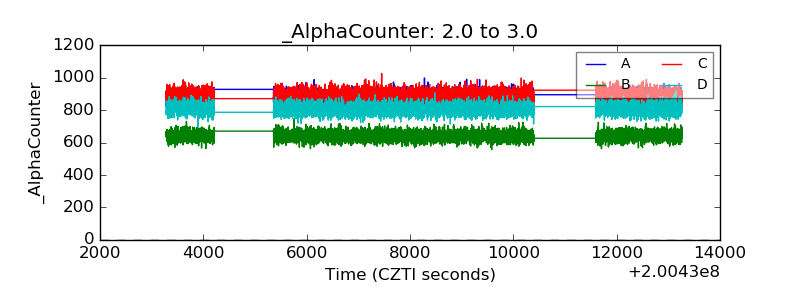 |
| _CPM_Rate | 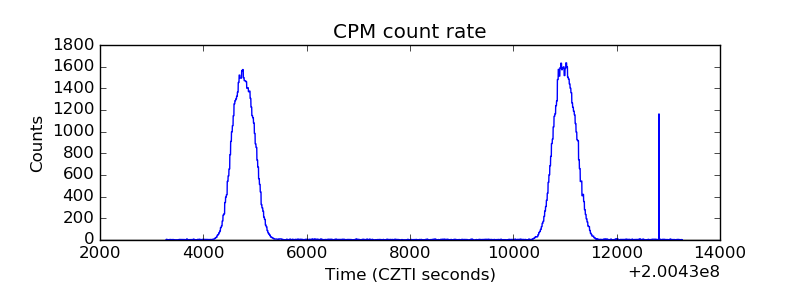 |
| CZT Counter | 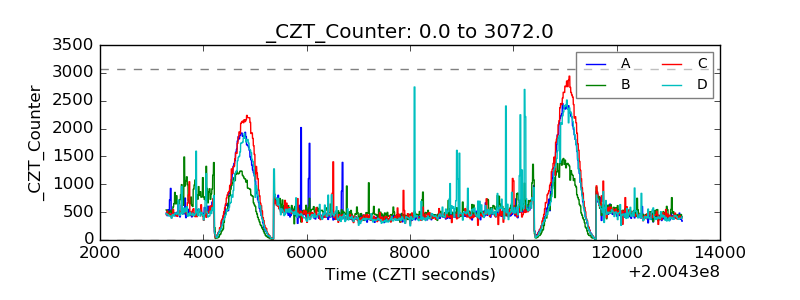 |
| +2.5 Volts monitor |  |
| +5 Volts monitor | 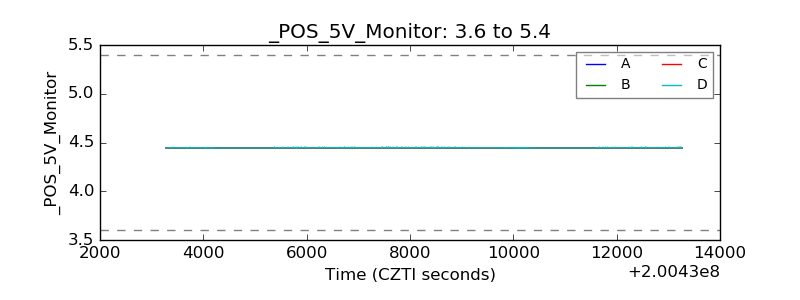 |
| _ROLL_ROT | 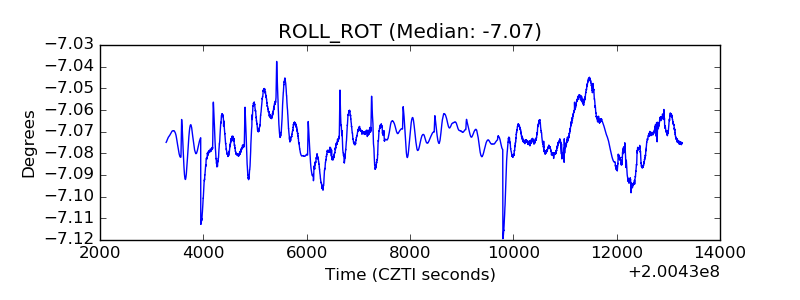 |
| _Roll_DEC | 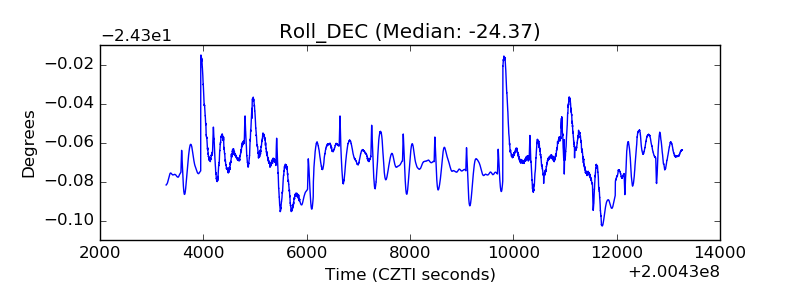 |
| _Roll_RA | 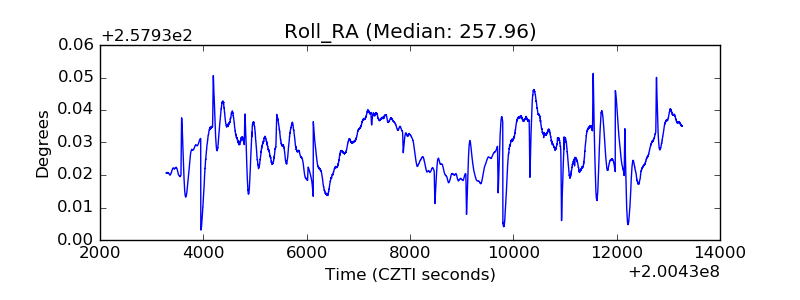 |
| Veto Counter | 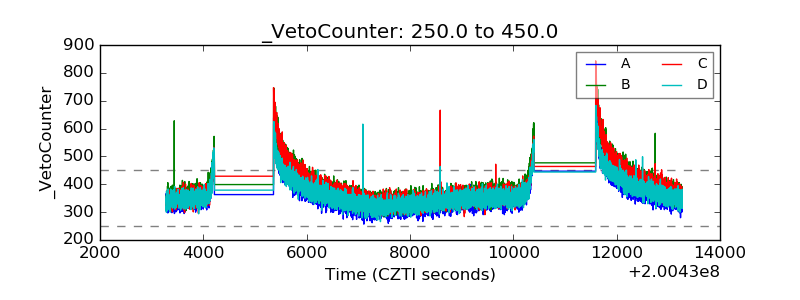 |