| Param | Original file | Final file |
|---|---|---|
| Filename | modeM0/AS1G05_241T02_9000000448_03314cztM0_level2.evt | modeM0/AS1G05_241T02_9000000448_03314cztM0_level2_quad_clean.evt |
| Size (bytes) | 451,255,680 | 82,091,520 |
| Size | 430.4 MB | 78.3 MB |
| Events in quadrant A | 3,042,163 | 503,110 |
| Events in quadrant B | 3,934,227 | 517,602 |
| Events in quadrant C | 3,138,671 | 518,177 |
| Events in quadrant D | 3,105,235 | 489,392 |
| Mode M0 | |||
|---|---|---|---|
| Quadrant | BADHDUFLAG | Total packets | Discarded packets |
| A | 0 | 13564 | 3 |
| B | 0 | 15922 | 2 |
| C | 0 | 13758 | 2 |
| D | 0 | 13972 | 2 |
| Mode SS | |||
|---|---|---|---|
| Quadrant | BADHDUFLAG | Total packets | Discarded packets |
| A | 0 | 134 | 0 |
| B | 0 | 134 | 0 |
| C | 0 | 134 | 0 |
| D | 0 | 134 | 0 |
| Mode M9 | |||
|---|---|---|---|
| Quadrant | BADHDUFLAG | Total packets | Discarded packets |
| A | 0 | 17 | 0 |
| B | 0 | 17 | 0 |
| C | 0 | 17 | 0 |
| D | 0 | 18 | 0 |
| Quadrant | Total seconds | Saturated seconds | Saturation percentage |
|---|---|---|---|
| A | 6560 | 41 | 0.625000% |
| B | 6560 | 128 | 1.951220% |
| C | 6560 | 37 | 0.564024% |
| D | 6560 | 43 | 0.655488% |
Noise dominated data is calculated using 1-second bins in cleaned event files. If a bin has >2000 counts, and if more than 50% of those come from <1% of pixels, then it is considered to be noise-dominated and hence unusable.
| Quadrant | # 1 sec bins | Bins with >0 counts | Bins with >2000 counts | High rate bins dominated by noise | Noise dominated (total time) | Noise dominated (detector-on time) | Marked lightcurve |
|---|---|---|---|---|---|---|---|
| A | 7770 | 6561 | 1 | 1 | 0.01% | 0.02% | 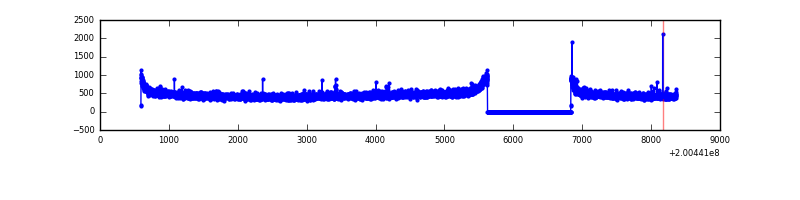 |
| B | 7770 | 6561 | 6 | 6 | 0.08% | 0.09% | 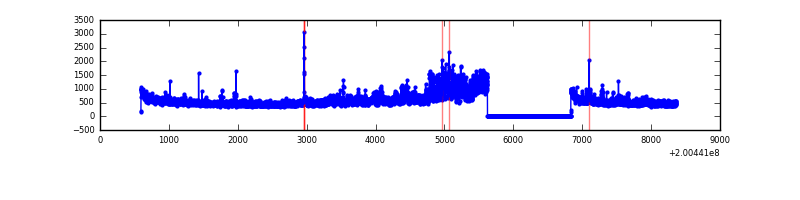 |
| C | 7770 | 6561 | 1 | 1 | 0.01% | 0.02% | 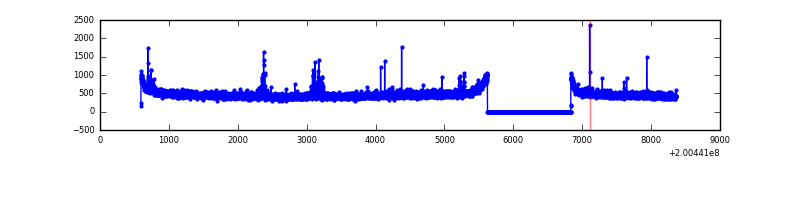 |
| D | 7770 | 6561 | 28 | 28 | 0.36% | 0.43% | 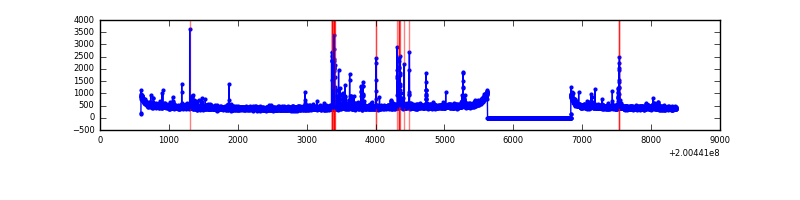 |
Top three noisy pixels from each quadrant. If the there are fewer than three noisy pixels in the level2.evt file, extra rows are filled as -1
| Pixel properties | Quadrant properties | ||||||
|---|---|---|---|---|---|---|---|
| Quadrant | DetID | PixID | Counts | Sigma | Mean | Median | Sigma |
| A | 8 | 15 | 18416 | 109.0 | 783 | 767 | 161.9 |
| A | 0 | 226 | 8576 | 48.23 | 783 | 767 | 161.9 |
| A | 12 | 194 | 8345 | 46.8 | 783 | 767 | 161.9 |
| B | 15 | 204 | 724607 | 4697.19 | 797 | 779 | 154.1 |
| B | 14 | 167 | 56485 | 361.5 | 797 | 779 | 154.1 |
| B | 2 | 249 | 26825 | 169.02 | 797 | 779 | 154.1 |
| C | 6 | 80 | 66041 | 355.04 | 779 | 783 | 183.8 |
| C | 1 | 16 | 15108 | 77.94 | 779 | 783 | 183.8 |
| C | 12 | 4 | 10427 | 52.47 | 779 | 783 | 183.8 |
| D | 13 | 223 | 93612 | 502.87 | 764 | 744 | 184.7 |
| D | 14 | 34 | 31681 | 167.52 | 764 | 744 | 184.7 |
| D | 5 | 233 | 21725 | 113.61 | 764 | 744 | 184.7 |
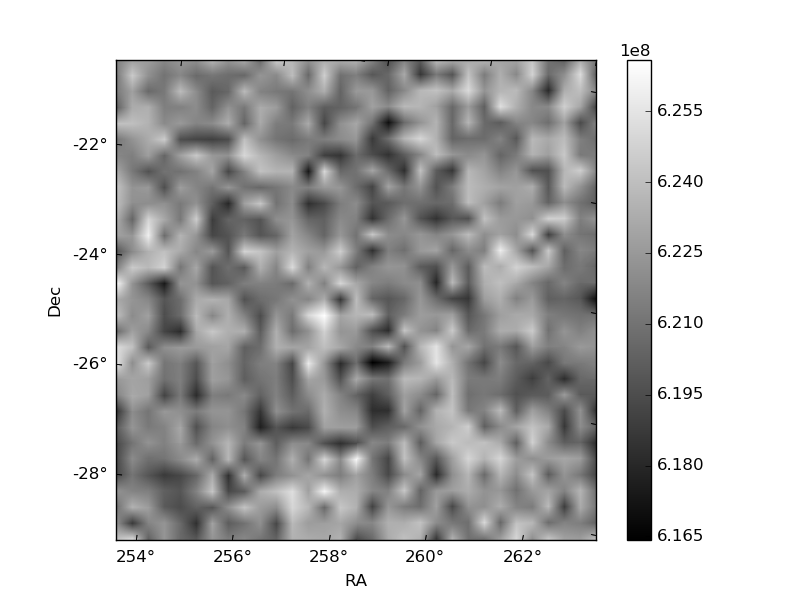
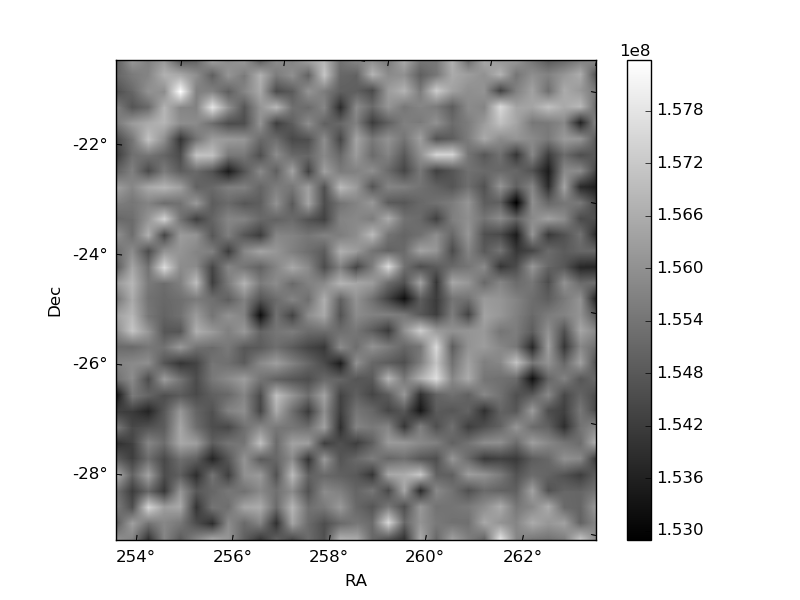
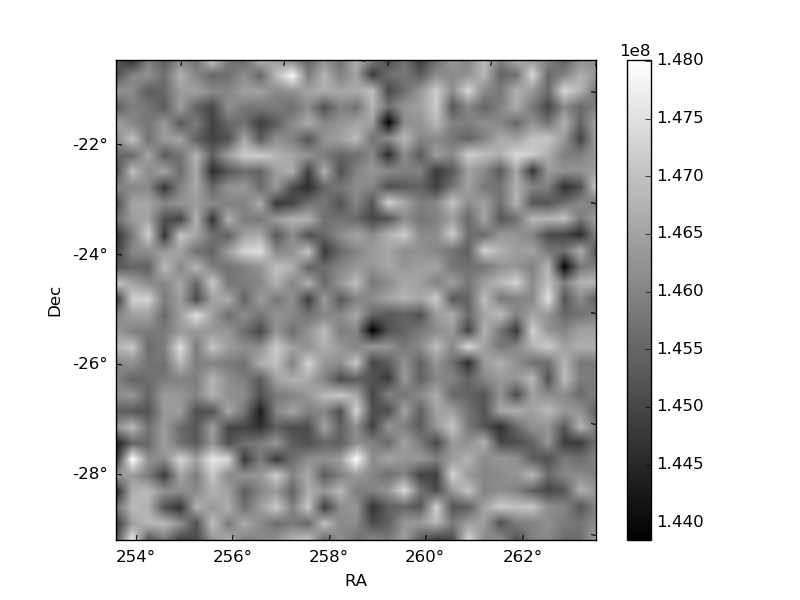
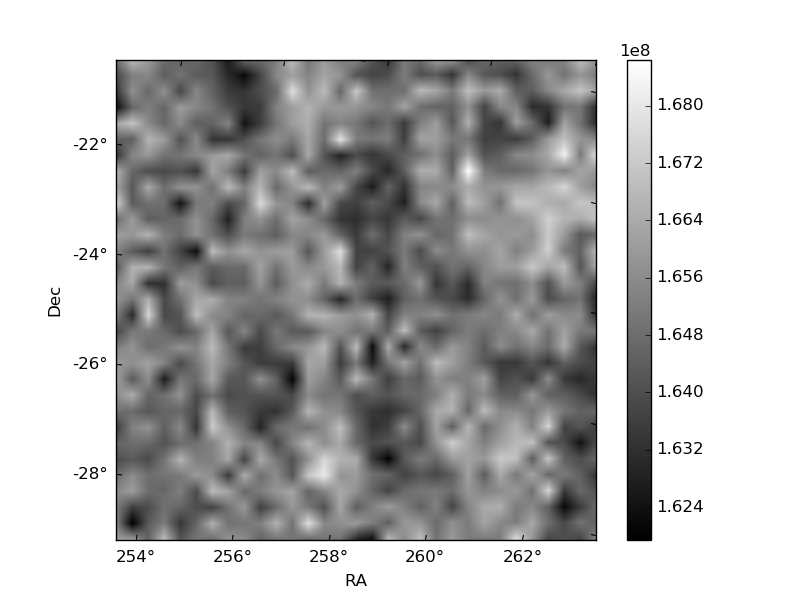
Histogram calculated using DETX and DETY for each event in the final _common_clean file
| Quadrant A | 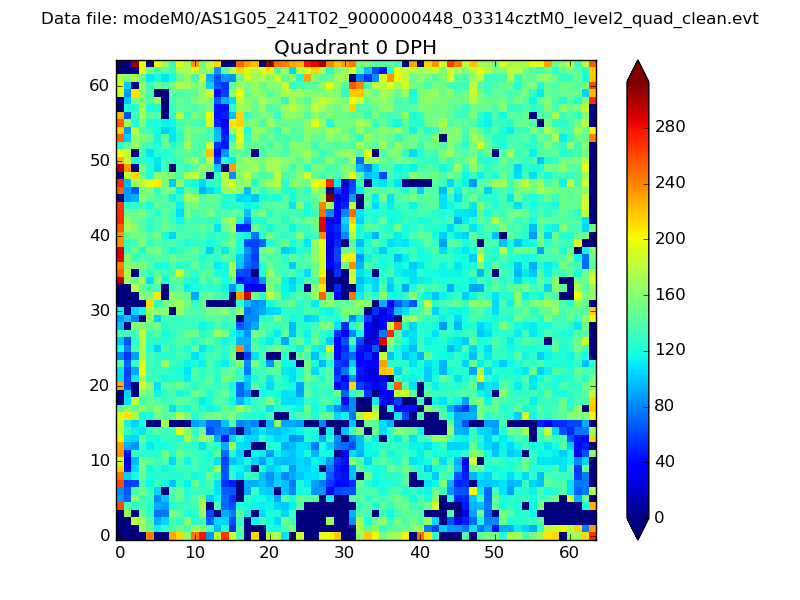 |
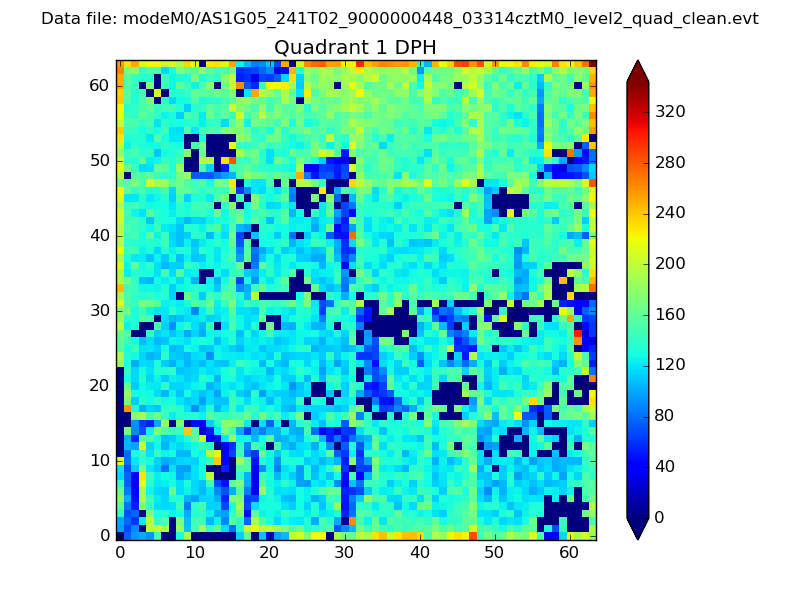 |
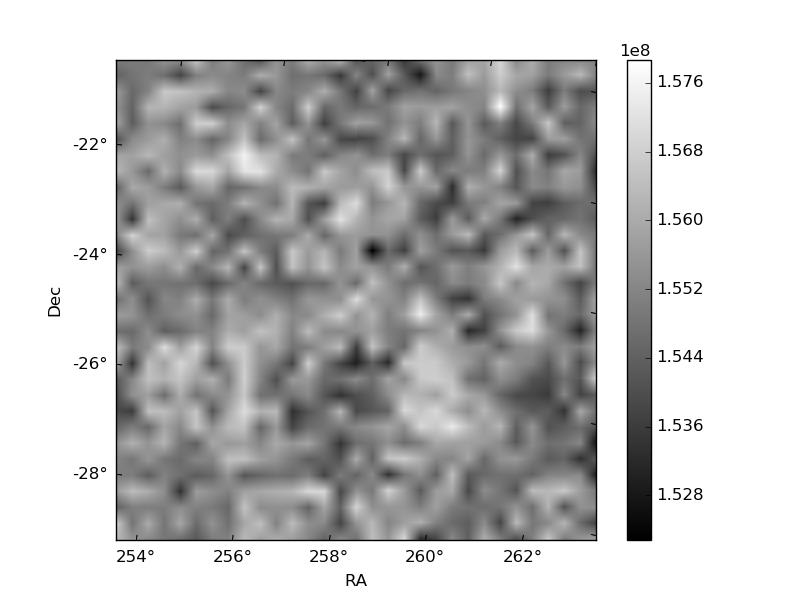
Quadrant B |
|---|---|---|---|
| Quadrant D | 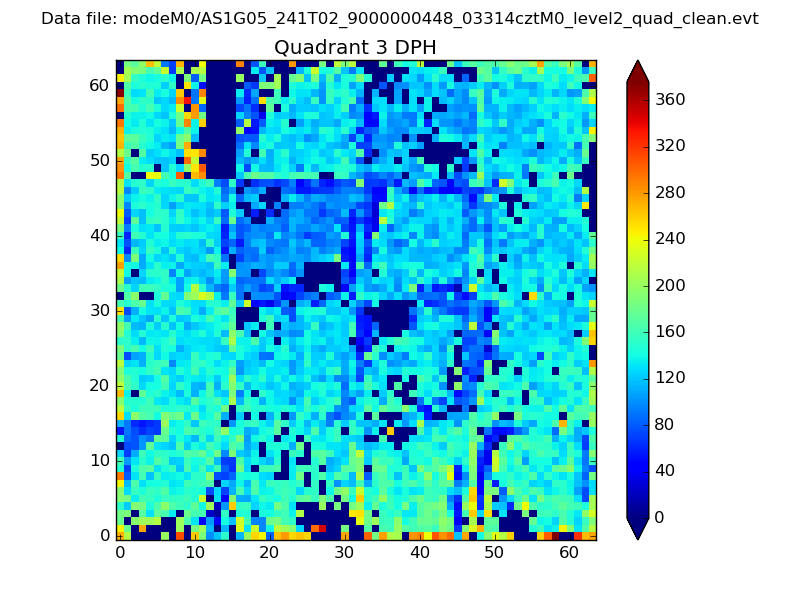 |
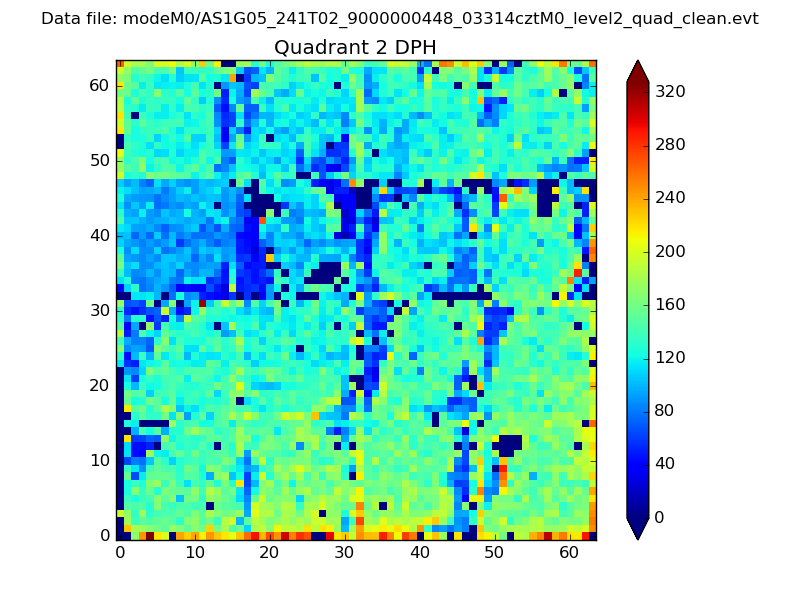 |
Quadrant C |
| Plot type | Count rate plots | Images |
|---|---|---|
| Comparison with Poisson distribution Blue bars denote a histogram of data divided into 1 sec bins. Red curve is a Poisson curve with rate = median count rate of data. |
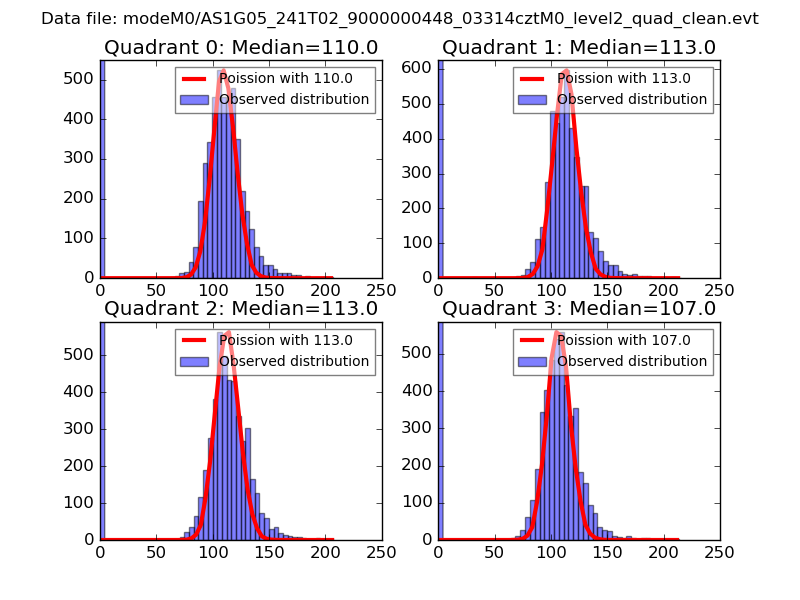 |
 |
| Quadrant-wise count rates Data is divided into 100 sec bins |
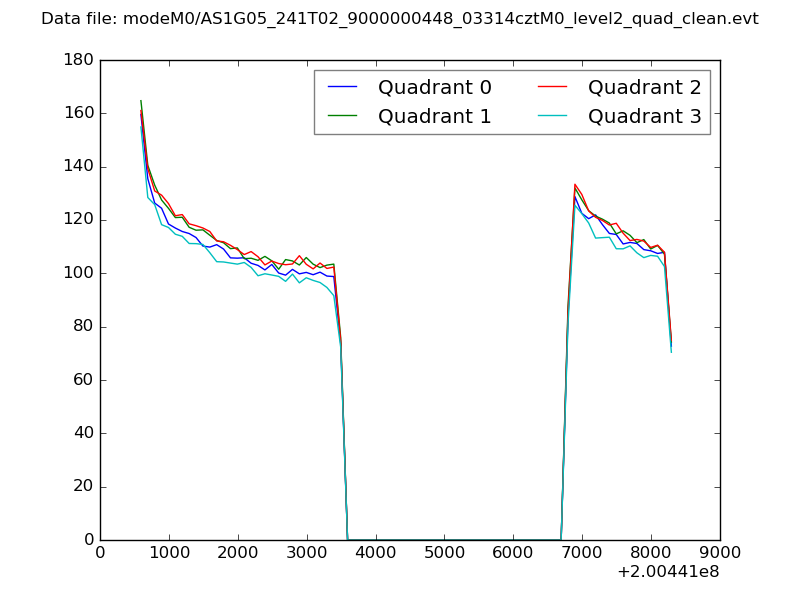 |
|
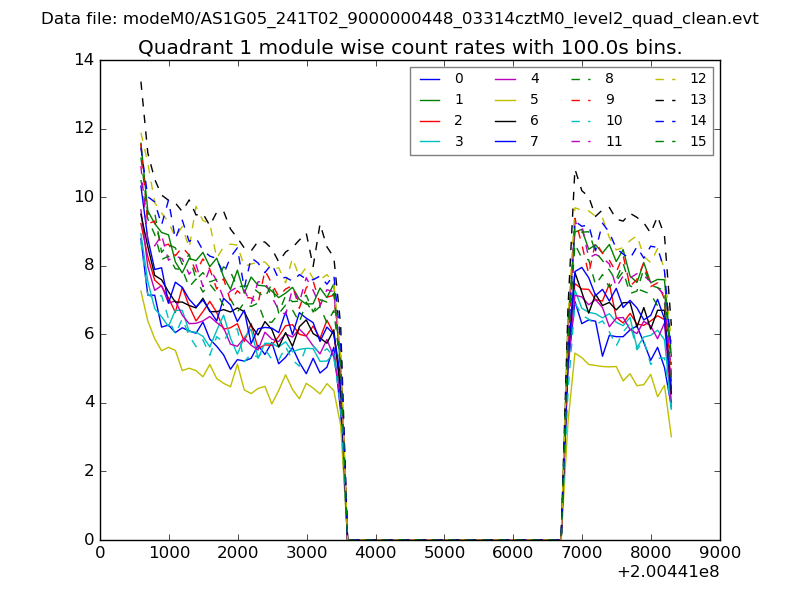
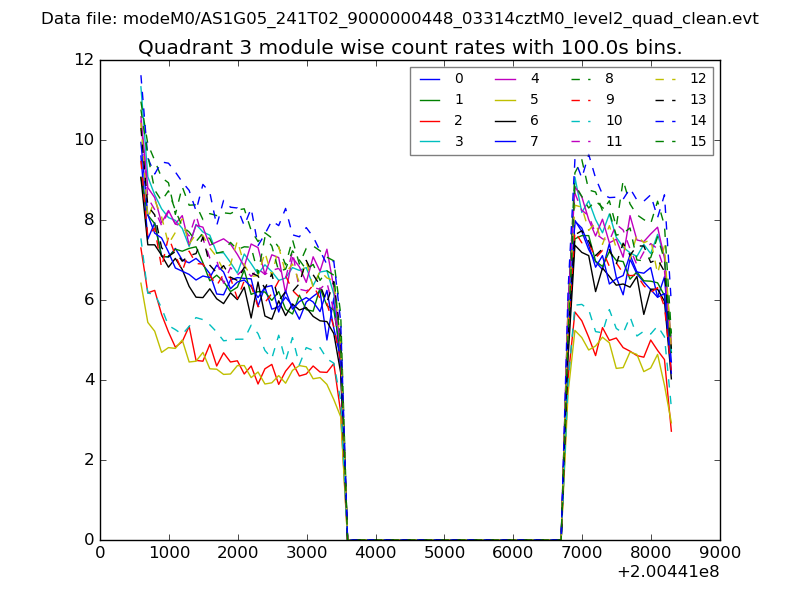
| Module-wise count rates for Quadrant A Data is divided into 100 sec bins |
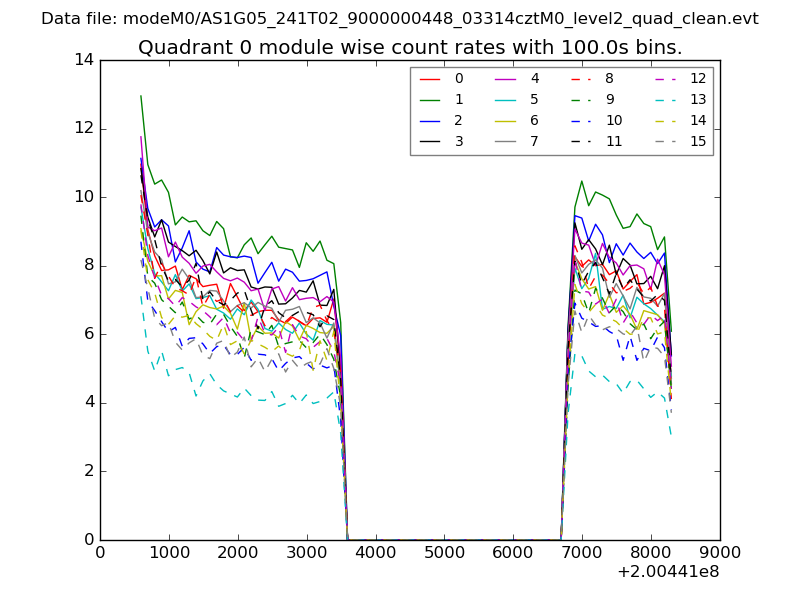 |
 |
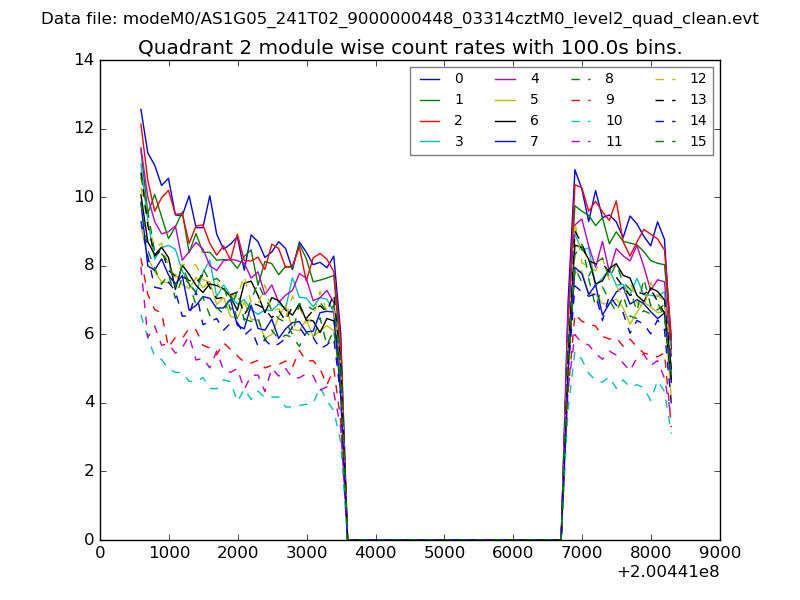
| Module-wise count rates for Quadrant B Data is divided into 100 sec bins |
 |
 |
| Module-wise count rates for Quadrant C Data is divided into 100 sec bins |
 |
 |
| Module-wise count rates for Quadrant D Data is divided into 100 sec bins |
 |
 |
| Parameter | Plot |
|---|---|
| CZT HV Monitor | 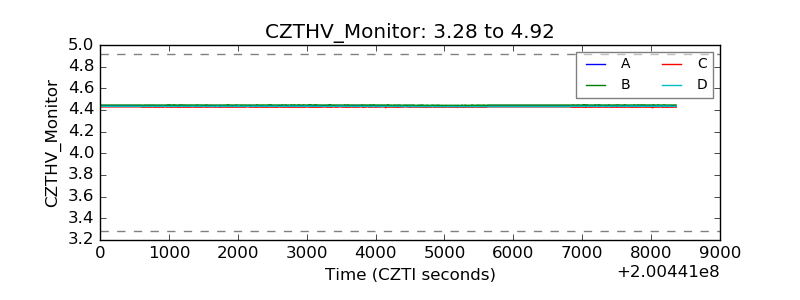 |
| D_VDD | 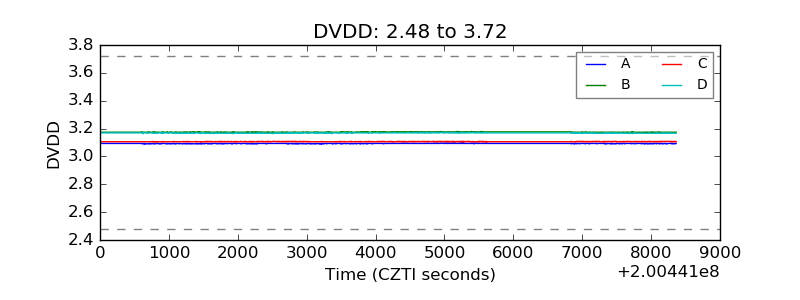 |
| Temperature 1 | 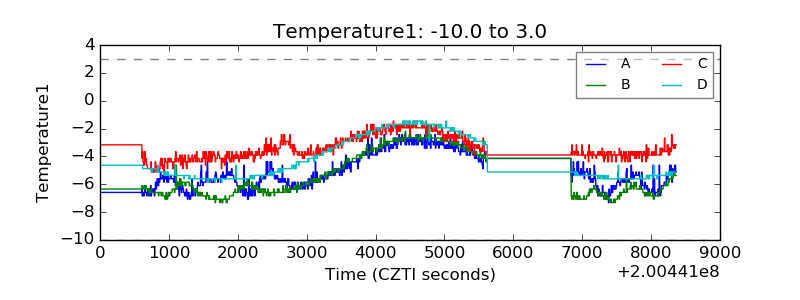 |
| Veto HV Monitor | 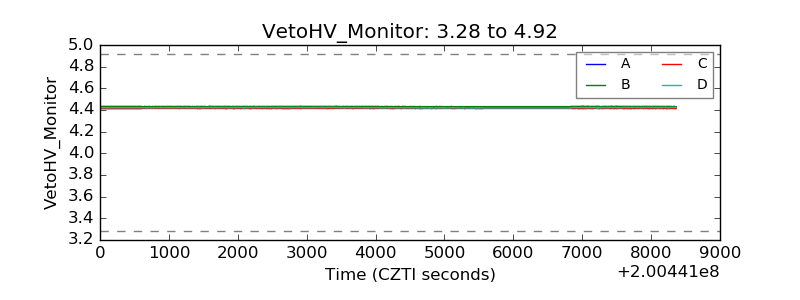 |
| Veto LLD | 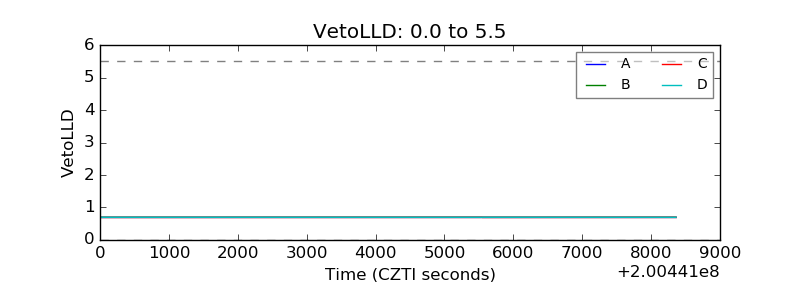 |
| Alpha Counter | 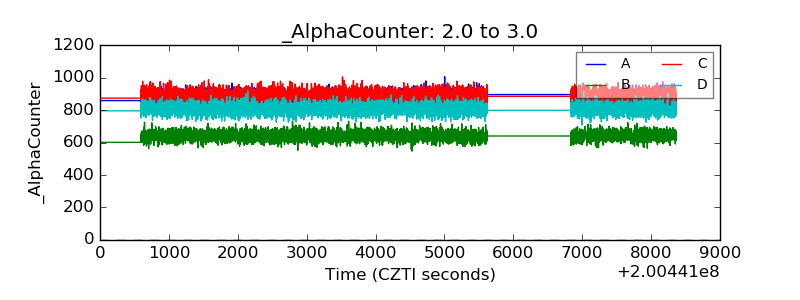 |
| _CPM_Rate | 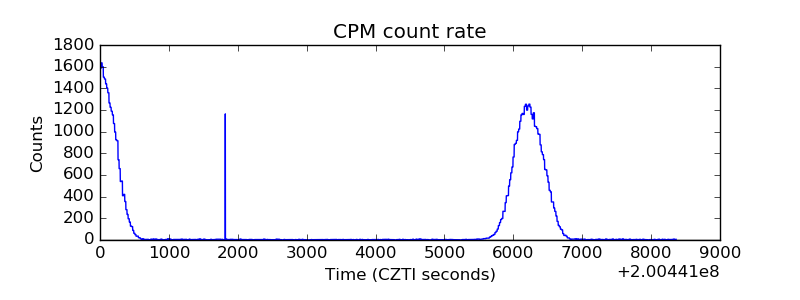 |
| CZT Counter | 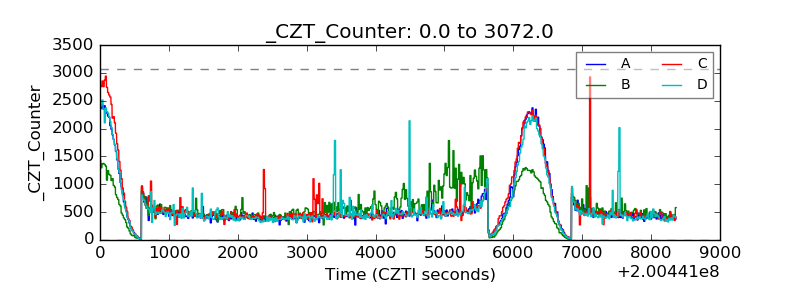 |
| +2.5 Volts monitor | 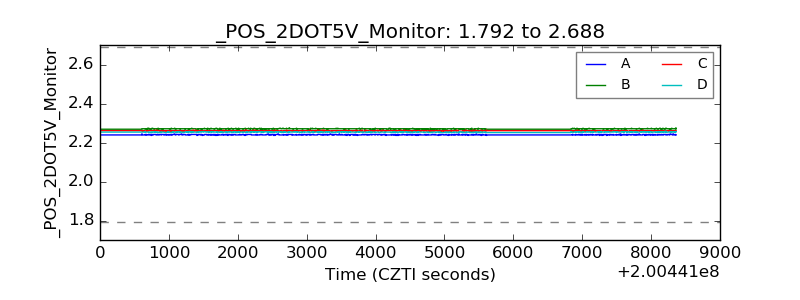 |
| +5 Volts monitor | 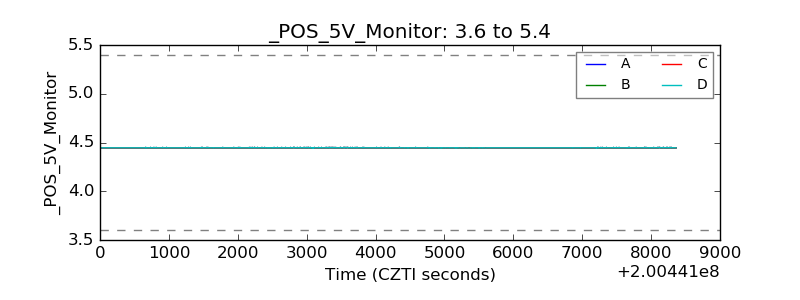 |
| _ROLL_ROT | 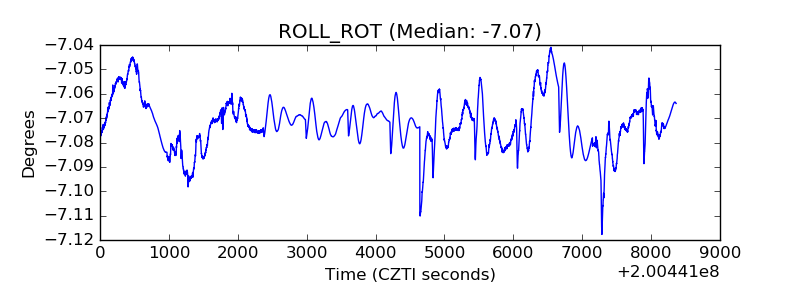 |
| _Roll_DEC | 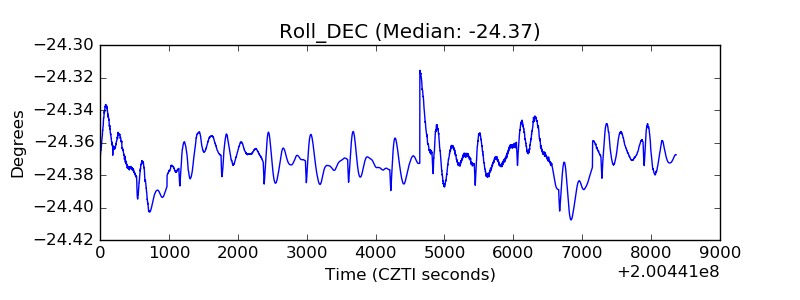 |
| _Roll_RA | 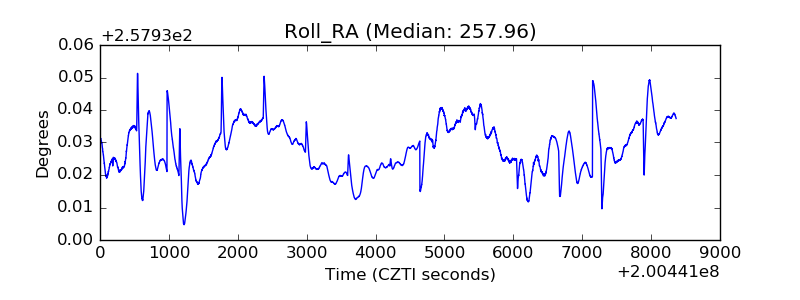 |
| Veto Counter | 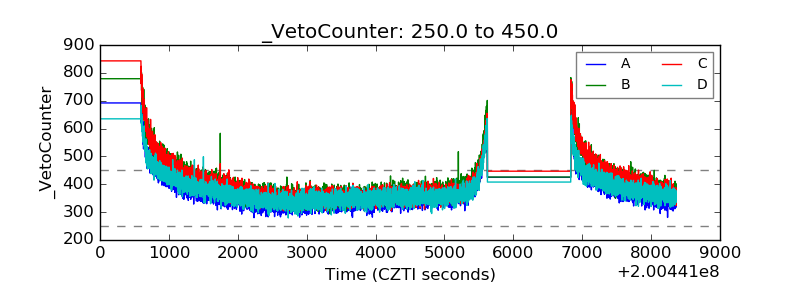 |