| Param | Original file | Final file |
|---|---|---|
| Filename | modeM0/AS1G05_241T02_9000000448_03315cztM0_level2.evt | modeM0/AS1G05_241T02_9000000448_03315cztM0_level2_quad_clean.evt |
| Size (bytes) | 481,633,920 | 77,123,520 |
| Size | 459.3 MB | 73.6 MB |
| Events in quadrant A | 3,002,713 | 471,118 |
| Events in quadrant B | 4,987,668 | 475,661 |
| Events in quadrant C | 3,140,205 | 480,545 |
| Events in quadrant D | 3,016,896 | 457,046 |
| Mode M0 | |||
|---|---|---|---|
| Quadrant | BADHDUFLAG | Total packets | Discarded packets |
| A | 0 | 13408 | 4 |
| B | 0 | 19259 | 3 |
| C | 0 | 13723 | 3 |
| D | 0 | 13626 | 3 |
| Mode SS | |||
|---|---|---|---|
| Quadrant | BADHDUFLAG | Total packets | Discarded packets |
| A | 0 | 132 | 0 |
| B | 0 | 132 | 0 |
| C | 0 | 132 | 0 |
| D | 0 | 132 | 0 |
| Mode M9 | |||
|---|---|---|---|
| Quadrant | BADHDUFLAG | Total packets | Discarded packets |
| A | 0 | 12 | 0 |
| B | 0 | 12 | 0 |
| C | 0 | 12 | 0 |
| D | 0 | 13 | 0 |
| Quadrant | Total seconds | Saturated seconds | Saturation percentage |
|---|---|---|---|
| A | 6461 | 50 | 0.773874% |
| B | 6461 | 174 | 2.693082% |
| C | 6461 | 38 | 0.588144% |
| D | 6461 | 34 | 0.526234% |
Noise dominated data is calculated using 1-second bins in cleaned event files. If a bin has >2000 counts, and if more than 50% of those come from <1% of pixels, then it is considered to be noise-dominated and hence unusable.
| Quadrant | # 1 sec bins | Bins with >0 counts | Bins with >2000 counts | High rate bins dominated by noise | Noise dominated (total time) | Noise dominated (detector-on time) | Marked lightcurve |
|---|---|---|---|---|---|---|---|
| A | 7656 | 6463 | 3 | 3 | 0.04% | 0.05% | 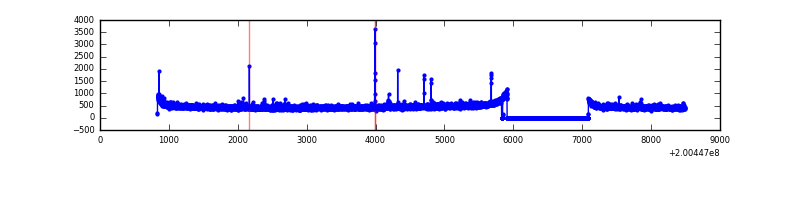 |
| B | 7656 | 6463 | 19 | 19 | 0.25% | 0.29% | 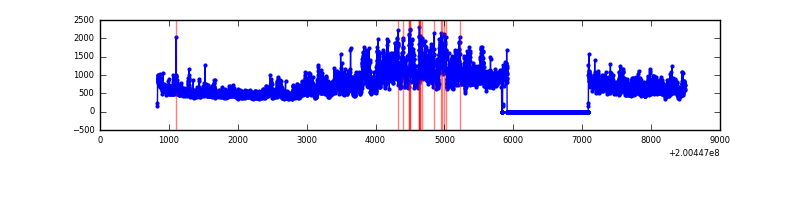 |
| C | 7656 | 6463 | 2 | 2 | 0.03% | 0.03% | 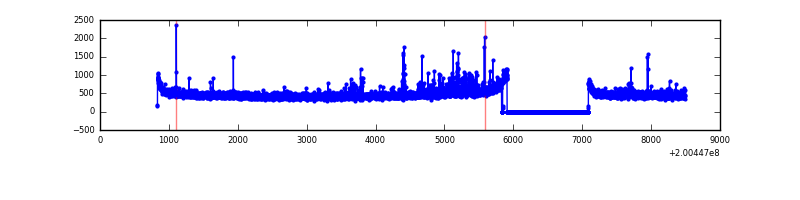 |
| D | 7656 | 6463 | 4 | 4 | 0.05% | 0.06% | 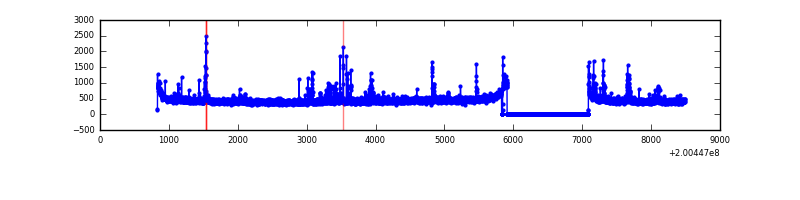 |
Top three noisy pixels from each quadrant. If the there are fewer than three noisy pixels in the level2.evt file, extra rows are filled as -1
| Pixel properties | Quadrant properties | ||||||
|---|---|---|---|---|---|---|---|
| Quadrant | DetID | PixID | Counts | Sigma | Mean | Median | Sigma |
| A | 0 | 118 | 25632 | 158.34 | 764 | 746 | 157.2 |
| A | 8 | 15 | 18433 | 112.53 | 764 | 746 | 157.2 |
| A | 0 | 226 | 10278 | 60.65 | 764 | 746 | 157.2 |
| B | 15 | 204 | 1888445 | 12520.08 | 775 | 757 | 150.8 |
| B | 14 | 167 | 48475 | 316.49 | 775 | 757 | 150.8 |
| B | 2 | 249 | 15886 | 100.34 | 775 | 757 | 150.8 |
| C | 1 | 192 | 50690 | 280.32 | 761 | 766 | 178.1 |
| C | 8 | 208 | 49468 | 273.46 | 761 | 766 | 178.1 |
| C | 12 | 4 | 21162 | 114.52 | 761 | 766 | 178.1 |
| D | 13 | 223 | 47270 | 256.75 | 750 | 729 | 181.3 |
| D | 12 | 233 | 46870 | 254.55 | 750 | 729 | 181.3 |
| D | 2 | 107 | 20976 | 111.7 | 750 | 729 | 181.3 |
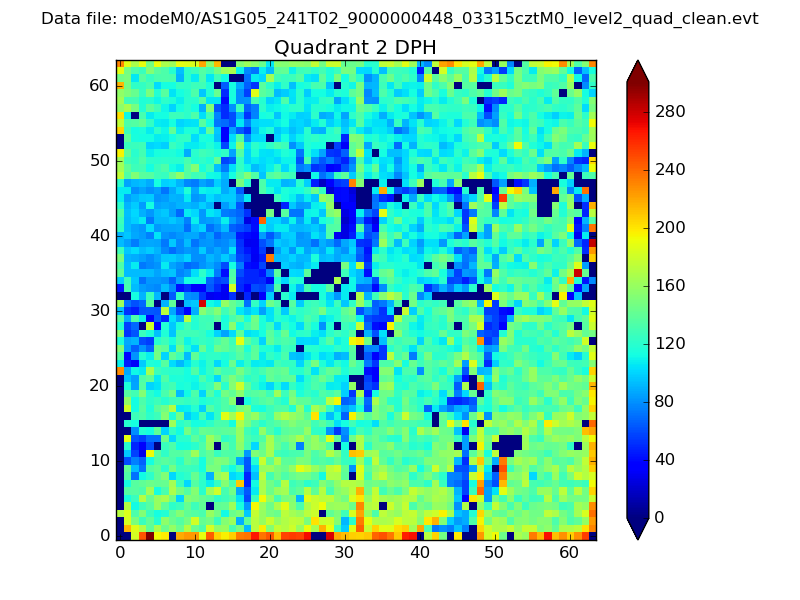
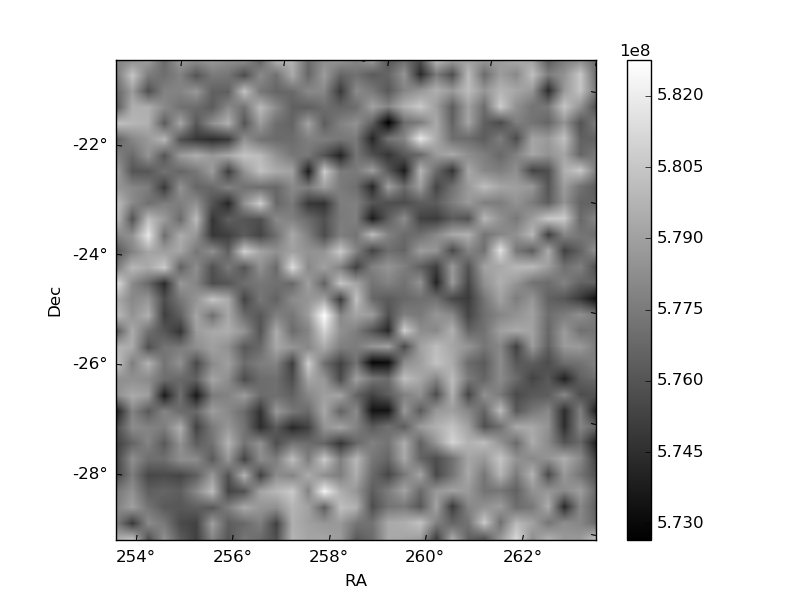
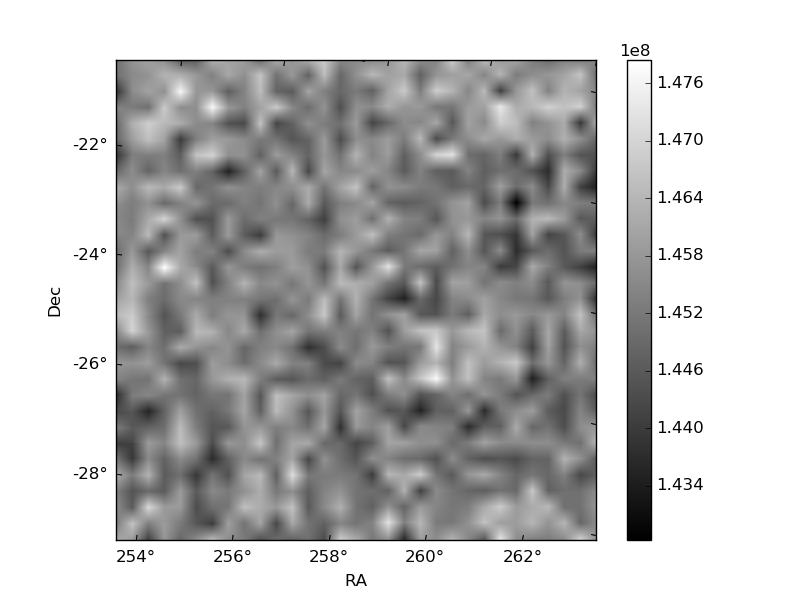
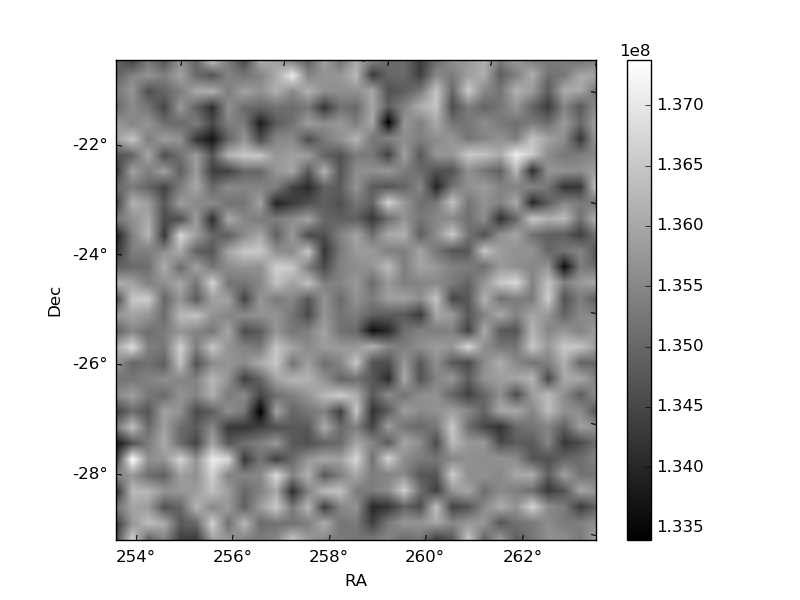
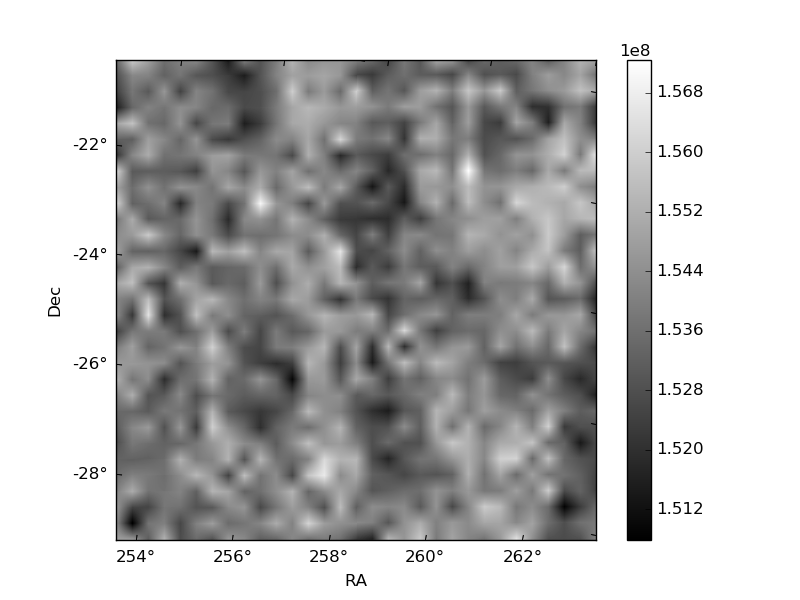
Histogram calculated using DETX and DETY for each event in the final _common_clean file
| Quadrant A | 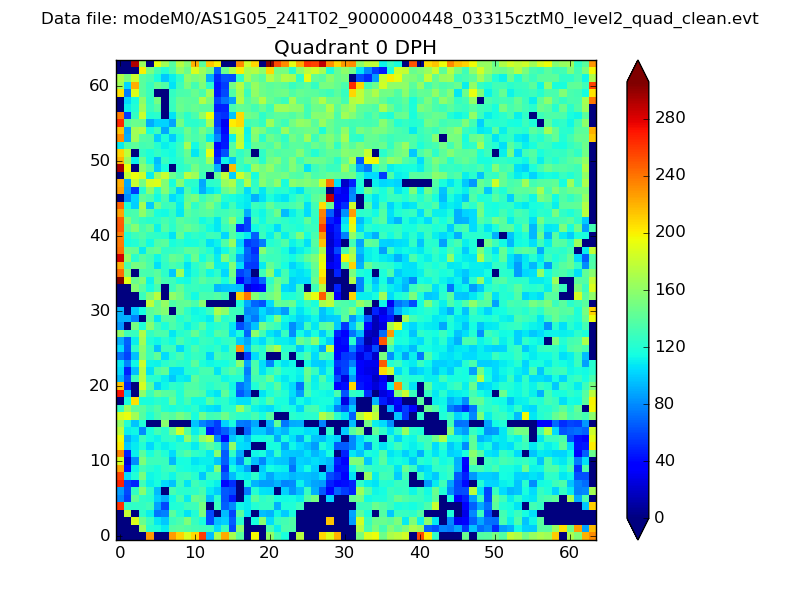 |
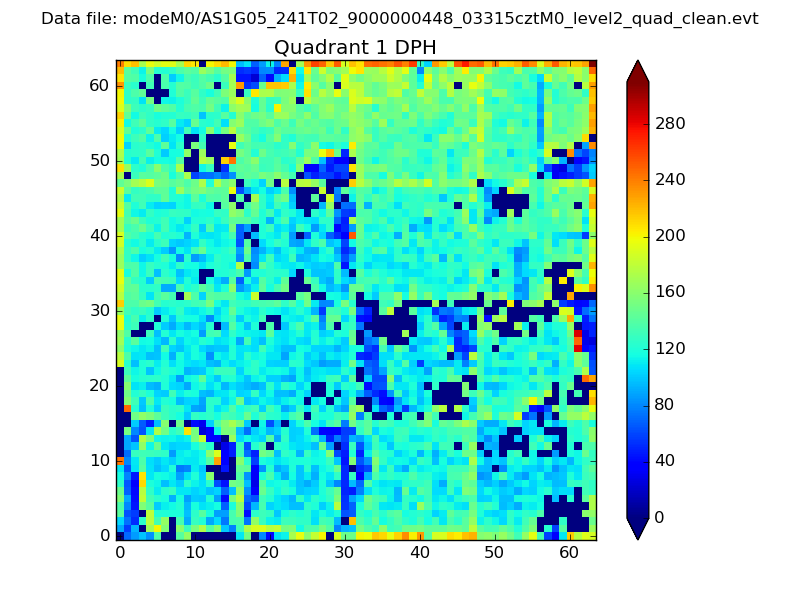 |
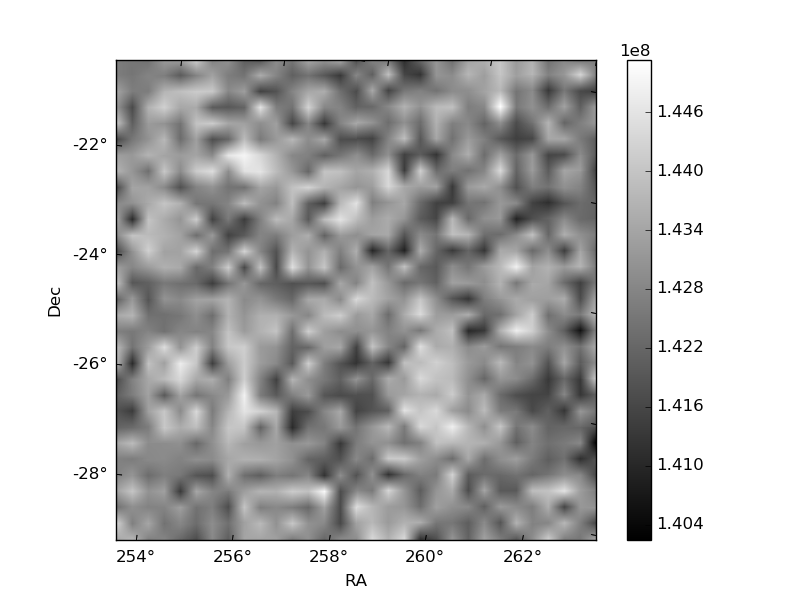
Quadrant B |
|---|---|---|---|
| Quadrant D | 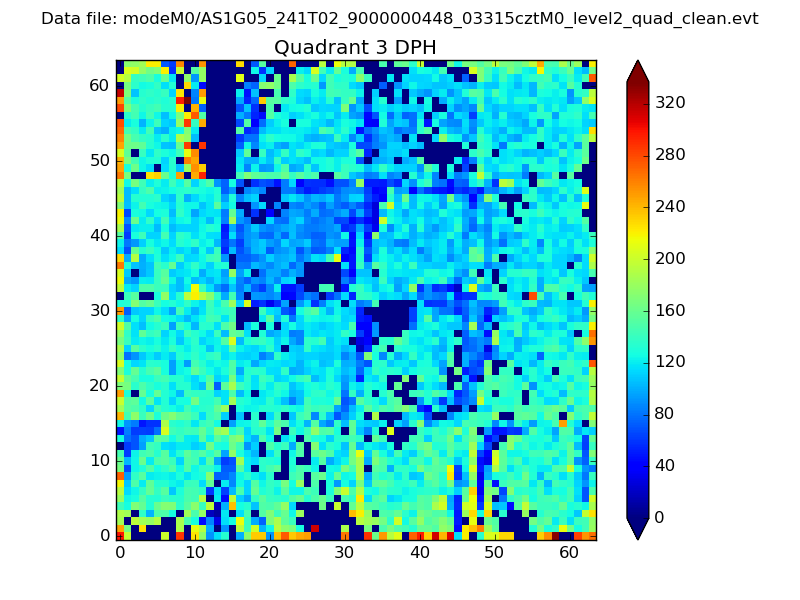 |
 |
Quadrant C |
| Plot type | Count rate plots | Images |
|---|---|---|
| Comparison with Poisson distribution Blue bars denote a histogram of data divided into 1 sec bins. Red curve is a Poisson curve with rate = median count rate of data. |
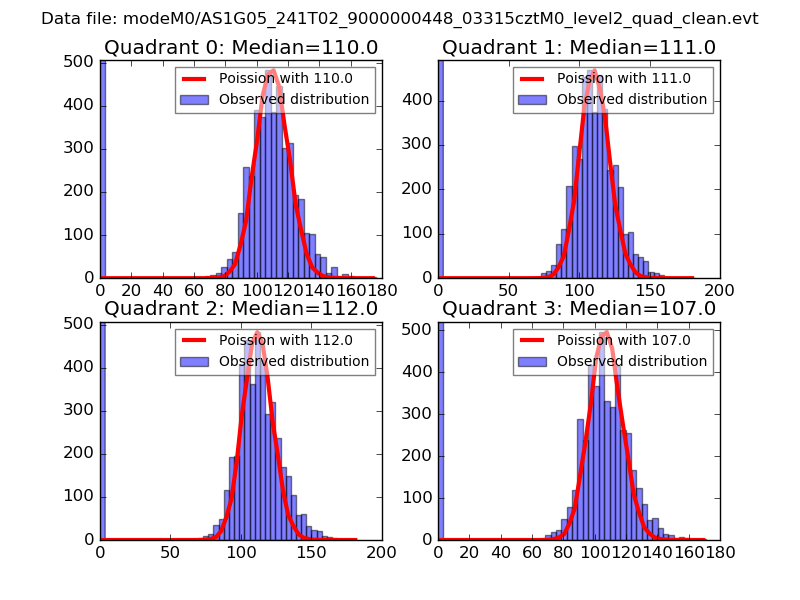 |
 |
| Quadrant-wise count rates Data is divided into 100 sec bins |
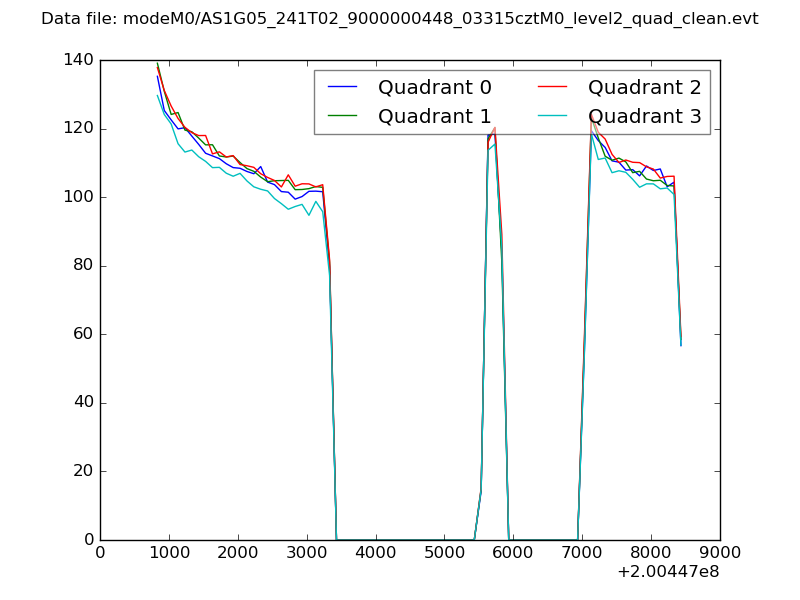 |
|
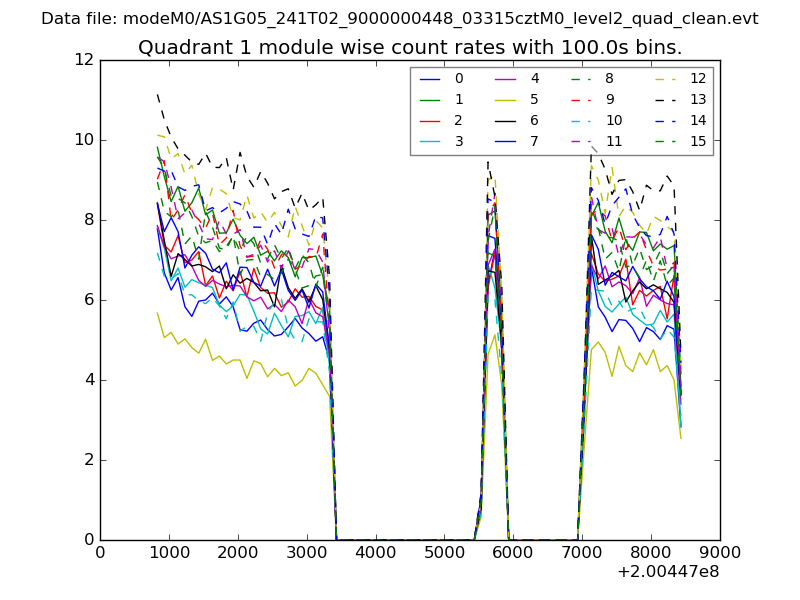
| Module-wise count rates for Quadrant A Data is divided into 100 sec bins |
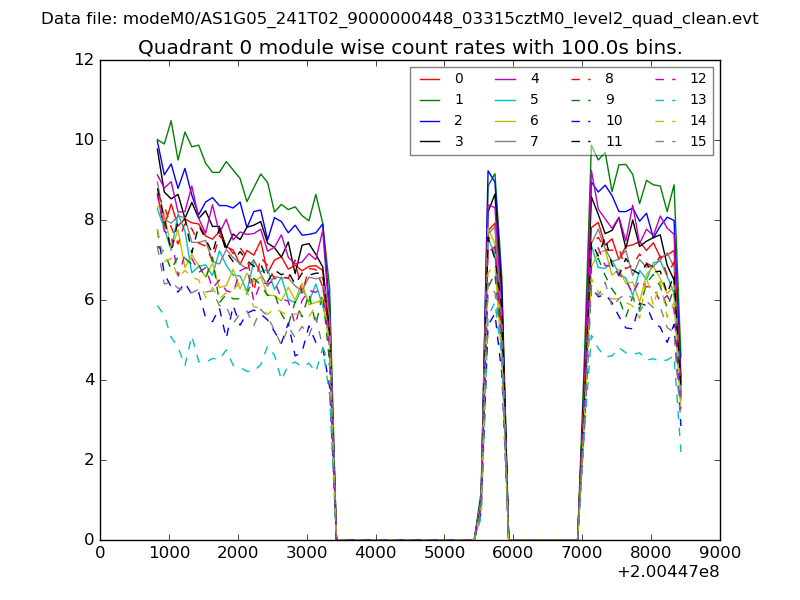 |
 |
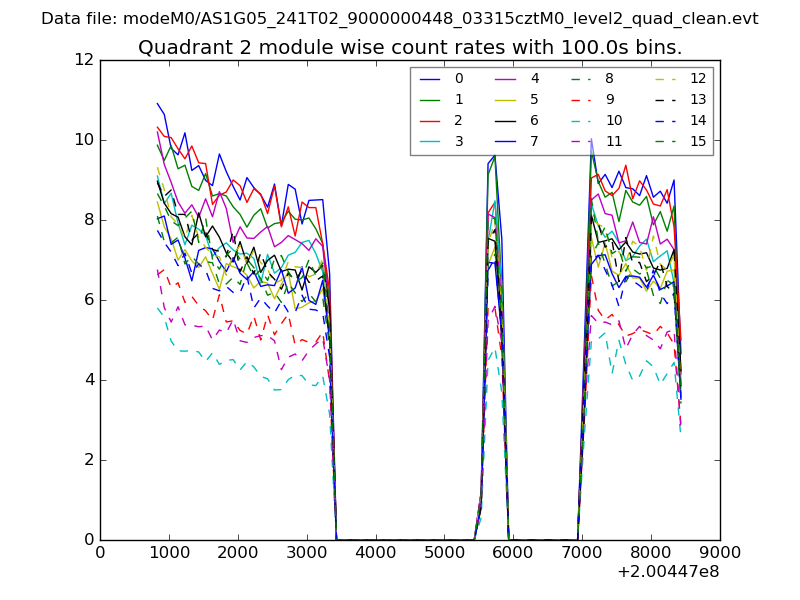
| Module-wise count rates for Quadrant B Data is divided into 100 sec bins |
 |
 |
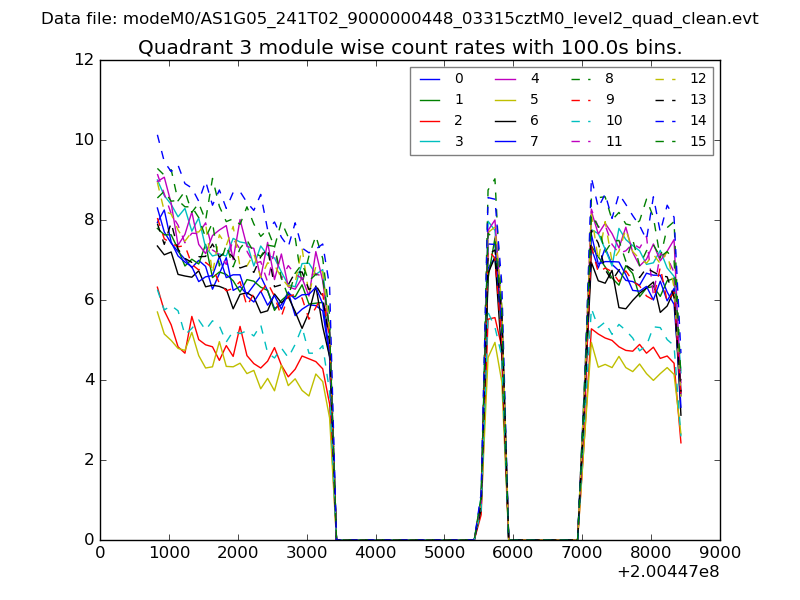
| Module-wise count rates for Quadrant C Data is divided into 100 sec bins |
 |
 |
| Module-wise count rates for Quadrant D Data is divided into 100 sec bins |
 |
 |
| Parameter | Plot |
|---|---|
| CZT HV Monitor | 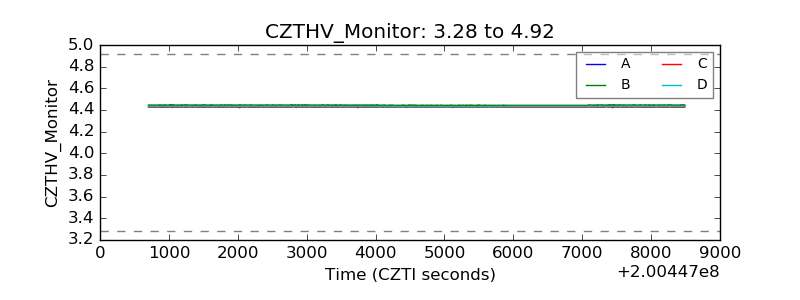 |
| D_VDD | 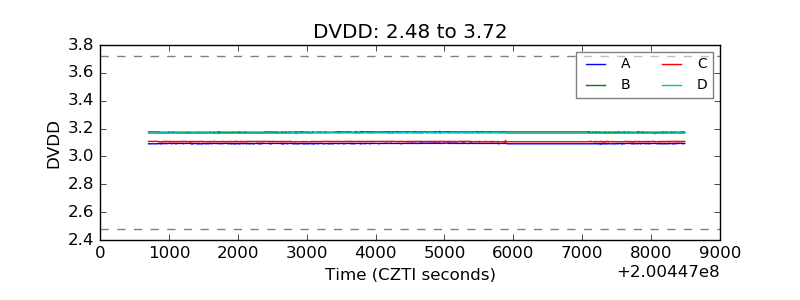 |
| Temperature 1 | 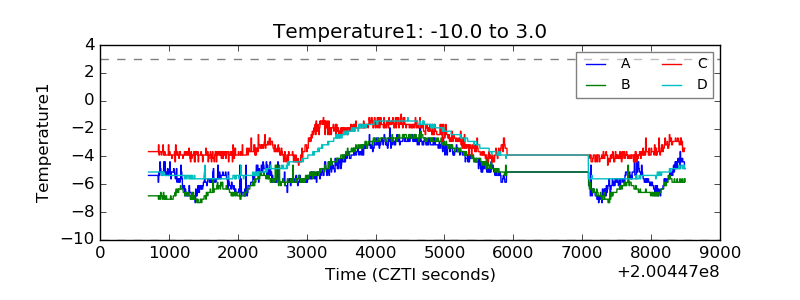 |
| Veto HV Monitor | 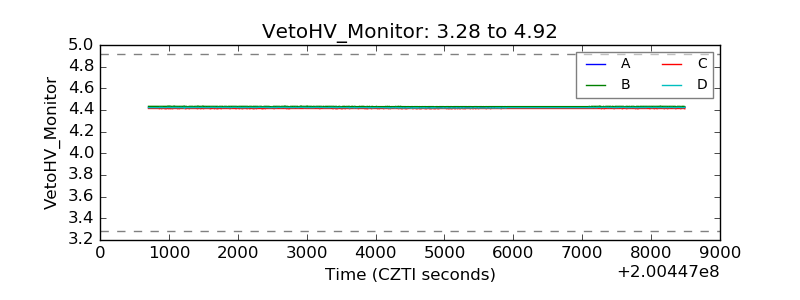 |
| Veto LLD | 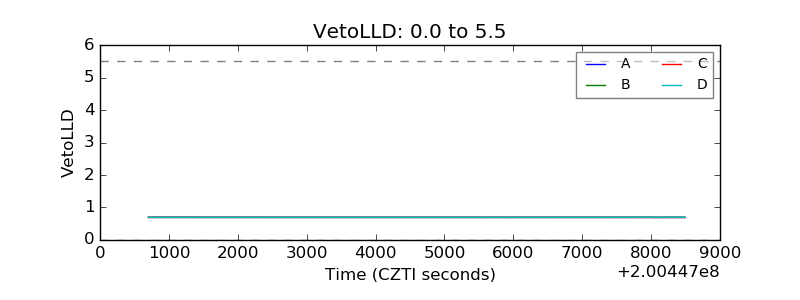 |
| Alpha Counter | 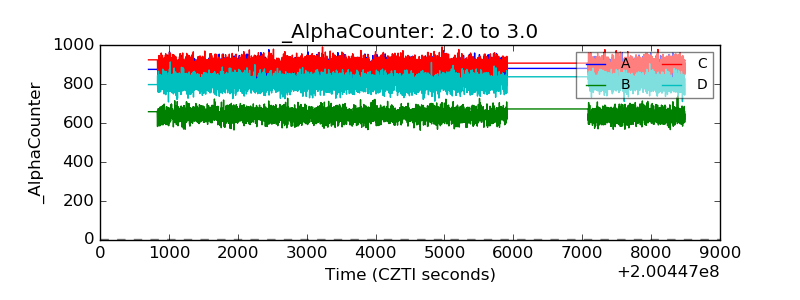 |
| _CPM_Rate | 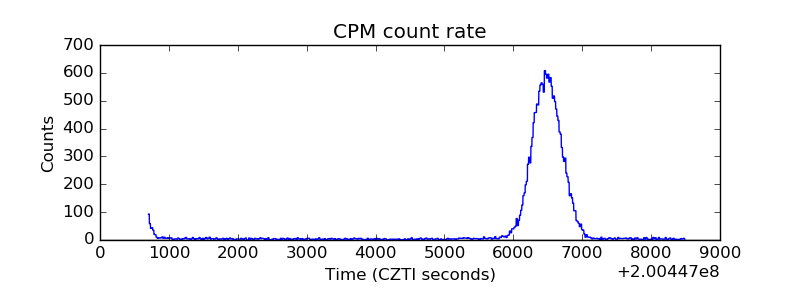 |
| CZT Counter | 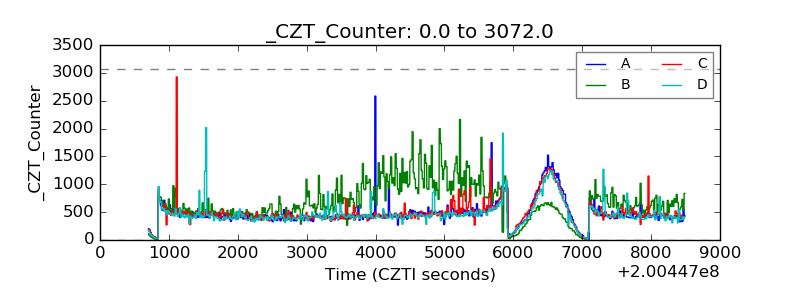 |
| +2.5 Volts monitor | 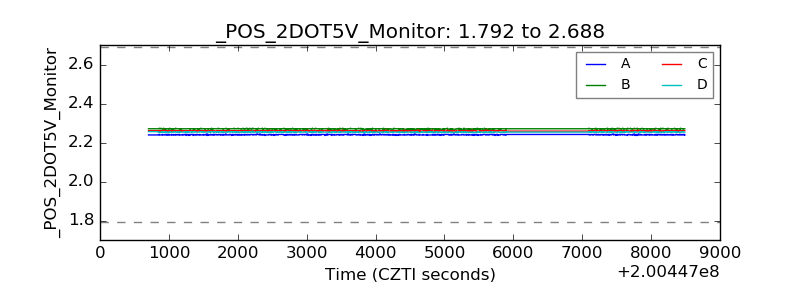 |
| +5 Volts monitor | 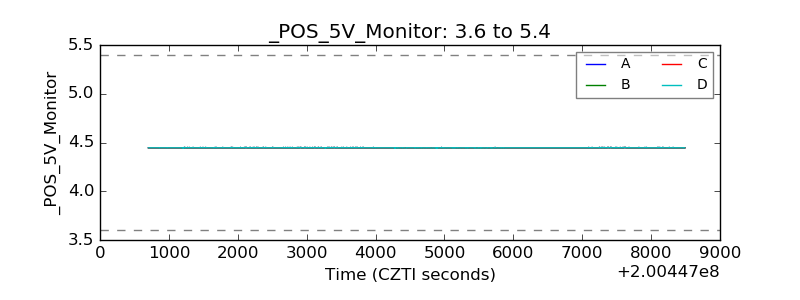 |
| _ROLL_ROT | 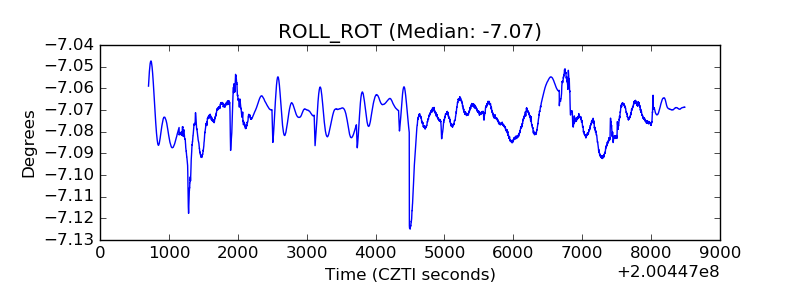 |
| _Roll_DEC | 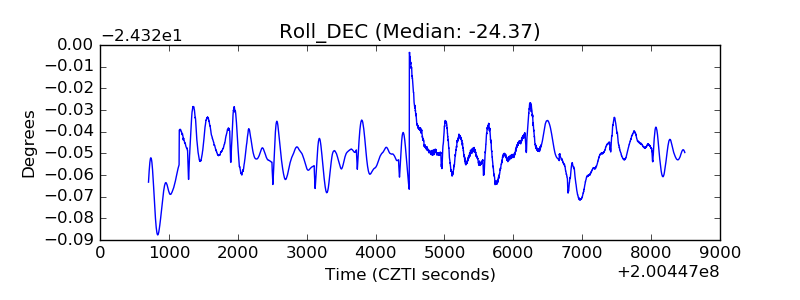 |
| _Roll_RA | 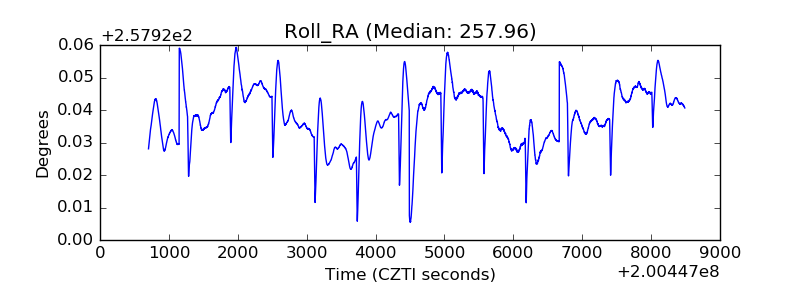 |
| Veto Counter | 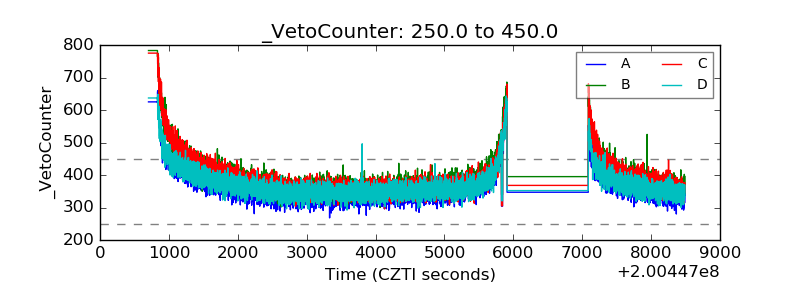 |