| Param | Original file | Final file |
|---|---|---|
| Filename | modeM0/AS1G05_241T02_9000000448_03317cztM0_level2.evt | modeM0/AS1G05_241T02_9000000448_03317cztM0_level2_quad_clean.evt |
| Size (bytes) | 669,646,080 | 101,678,400 |
| Size | 638.6 MB | 97.0 MB |
| Events in quadrant A | 4,354,914 | 619,436 |
| Events in quadrant B | 6,370,260 | 612,811 |
| Events in quadrant C | 4,535,820 | 607,682 |
| Events in quadrant D | 4,391,926 | 596,637 |
| Mode M0 | |||
|---|---|---|---|
| Quadrant | BADHDUFLAG | Total packets | Discarded packets |
| A | 0 | 19428 | 3 |
| B | 0 | 25343 | 2 |
| C | 0 | 19708 | 2 |
| D | 0 | 19819 | 2 |
| Mode SS | |||
|---|---|---|---|
| Quadrant | BADHDUFLAG | Total packets | Discarded packets |
| A | 0 | 188 | 0 |
| B | 0 | 188 | 0 |
| C | 0 | 188 | 0 |
| D | 0 | 188 | 0 |
| Mode M9 | |||
|---|---|---|---|
| Quadrant | BADHDUFLAG | Total packets | Discarded packets |
| A | 0 | 18 | 0 |
| B | 0 | 18 | 0 |
| C | 0 | 18 | 0 |
| D | 0 | 18 | 0 |
| Quadrant | Total seconds | Saturated seconds | Saturation percentage |
|---|---|---|---|
| A | 9262 | 217 | 2.342906% |
| B | 9262 | 268 | 2.893544% |
| C | 9262 | 154 | 1.662708% |
| D | 9262 | 191 | 2.062190% |
Noise dominated data is calculated using 1-second bins in cleaned event files. If a bin has >2000 counts, and if more than 50% of those come from <1% of pixels, then it is considered to be noise-dominated and hence unusable.
| Quadrant | # 1 sec bins | Bins with >0 counts | Bins with >2000 counts | High rate bins dominated by noise | Noise dominated (total time) | Noise dominated (detector-on time) | Marked lightcurve |
|---|---|---|---|---|---|---|---|
| A | 10957 | 9264 | 11 | 11 | 0.10% | 0.12% | 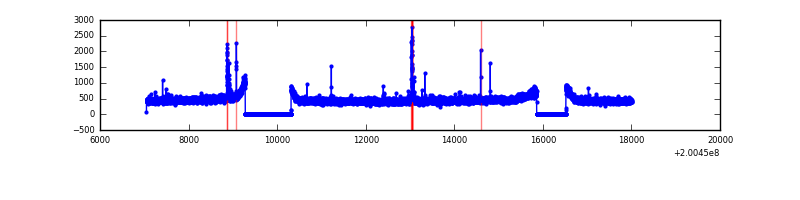 |
| B | 10957 | 9264 | 25 | 25 | 0.23% | 0.27% | 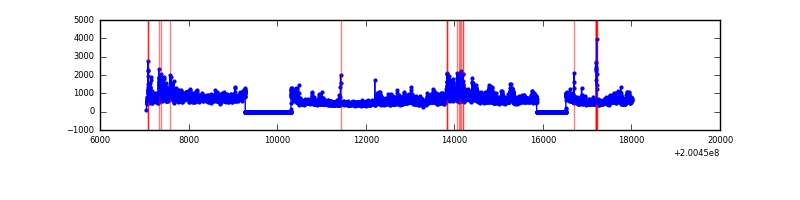 |
| C | 10957 | 9264 | 8 | 8 | 0.07% | 0.09% | 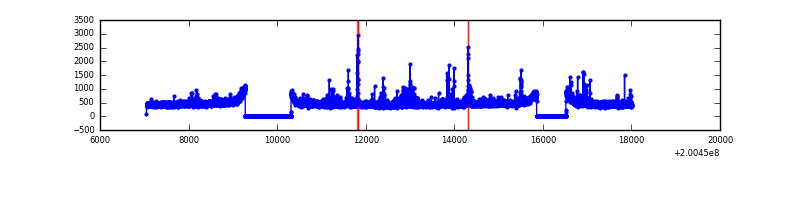 |
| D | 10957 | 9264 | 29 | 29 | 0.26% | 0.31% | 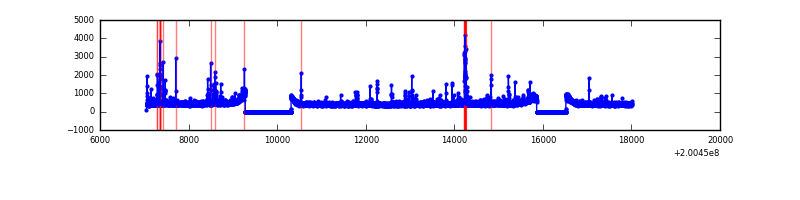 |
Top three noisy pixels from each quadrant. If the there are fewer than three noisy pixels in the level2.evt file, extra rows are filled as -1
| Pixel properties | Quadrant properties | ||||||
|---|---|---|---|---|---|---|---|
| Quadrant | DetID | PixID | Counts | Sigma | Mean | Median | Sigma |
| A | 0 | 118 | 50231 | 215.55 | 1106 | 1081 | 228.0 |
| A | 0 | 50 | 33675 | 142.95 | 1106 | 1081 | 228.0 |
| A | 0 | 226 | 16056 | 65.67 | 1106 | 1081 | 228.0 |
| B | 15 | 204 | 1939769 | 8936.37 | 1110 | 1083 | 216.9 |
| B | 2 | 249 | 40851 | 183.31 | 1110 | 1083 | 216.9 |
| B | 0 | 229 | 29347 | 130.28 | 1110 | 1083 | 216.9 |
| C | 1 | 192 | 118274 | 460.74 | 1080 | 1087 | 254.3 |
| C | 1 | 16 | 100763 | 391.9 | 1080 | 1087 | 254.3 |
| C | 12 | 4 | 40772 | 156.03 | 1080 | 1087 | 254.3 |
| D | 13 | 223 | 204807 | 773.7 | 1079 | 1048 | 263.4 |
| D | 12 | 233 | 41025 | 151.8 | 1079 | 1048 | 263.4 |
| D | 5 | 233 | 21504 | 77.67 | 1079 | 1048 | 263.4 |
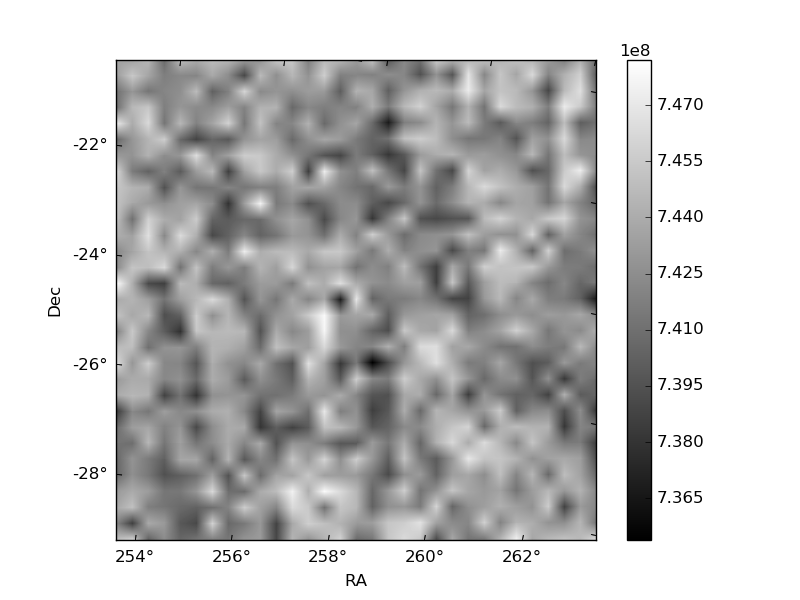
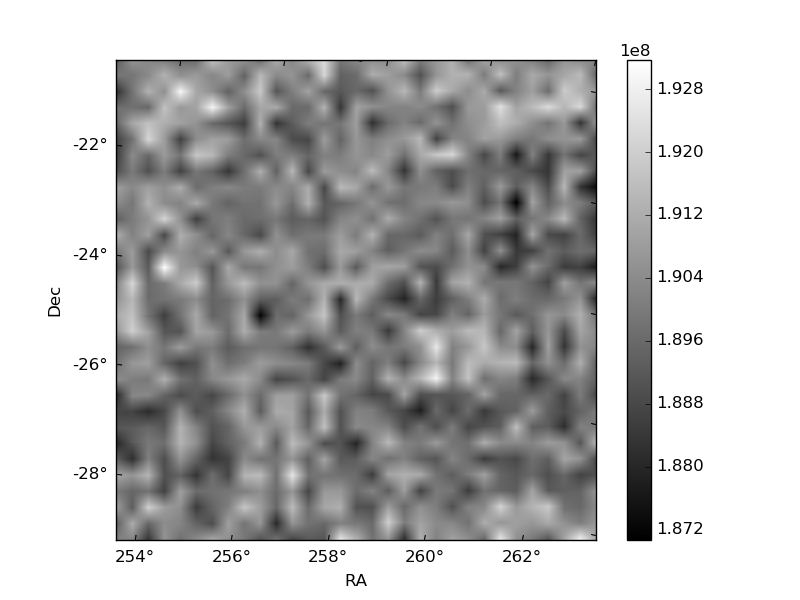
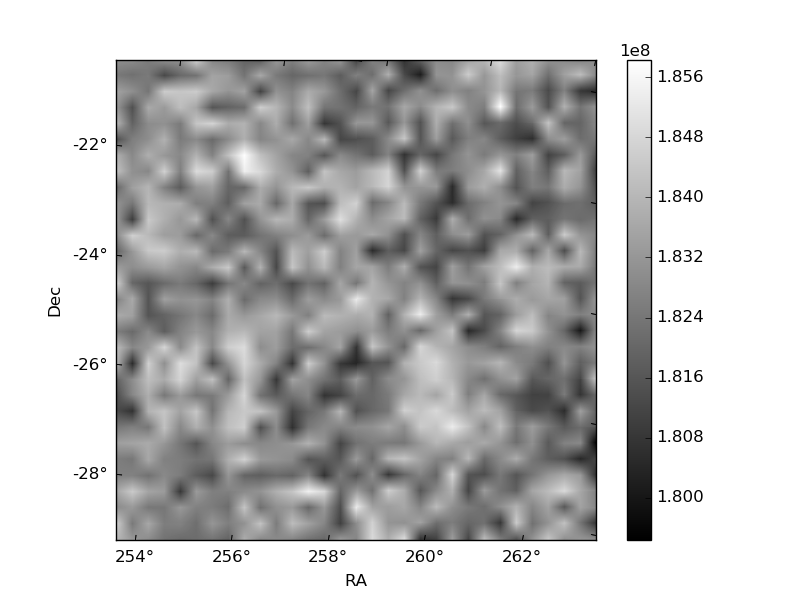
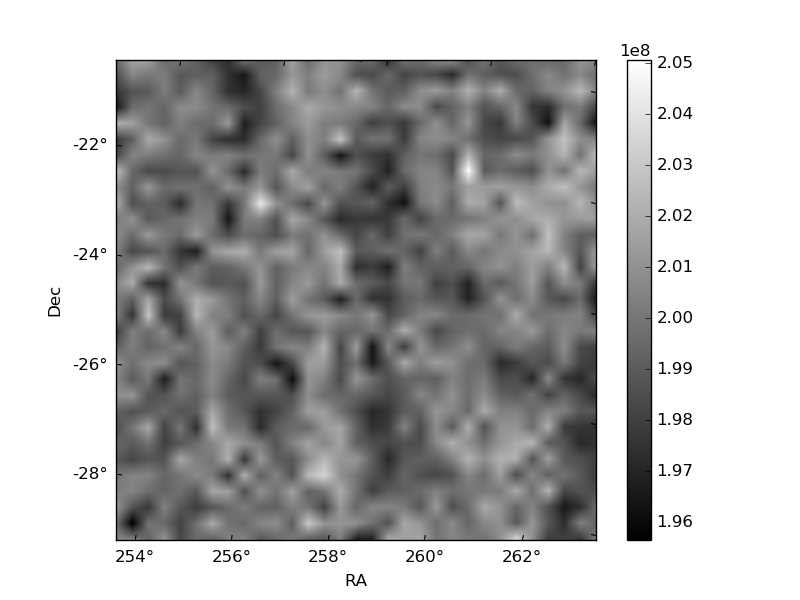
Histogram calculated using DETX and DETY for each event in the final _common_clean file
| Quadrant A | 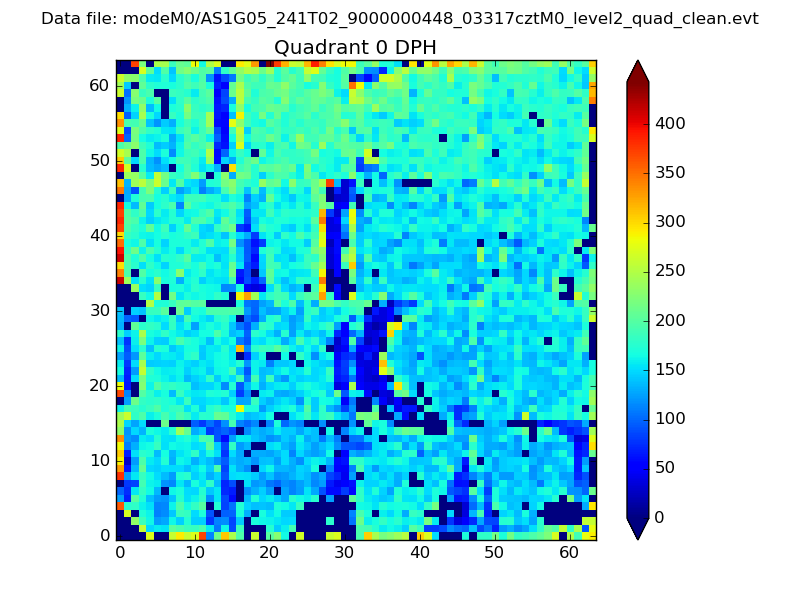 |
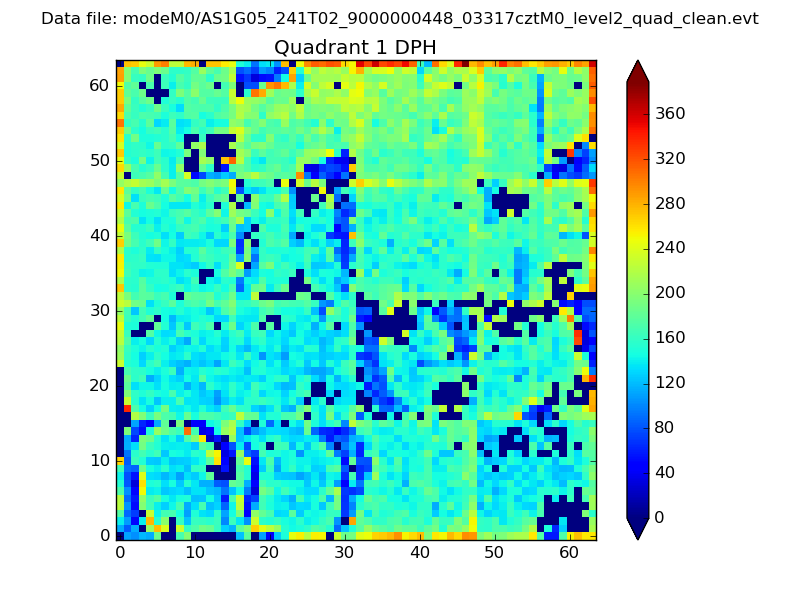 |
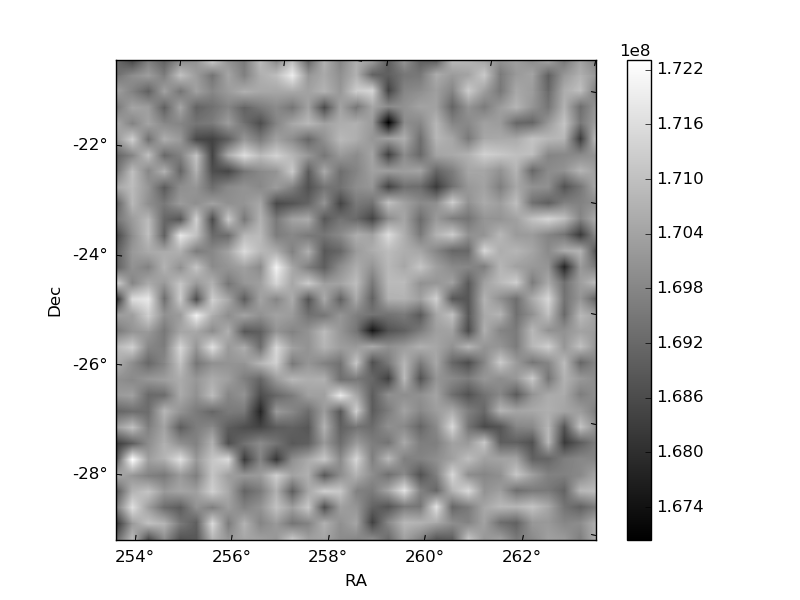
Quadrant B |
|---|---|---|---|
| Quadrant D | 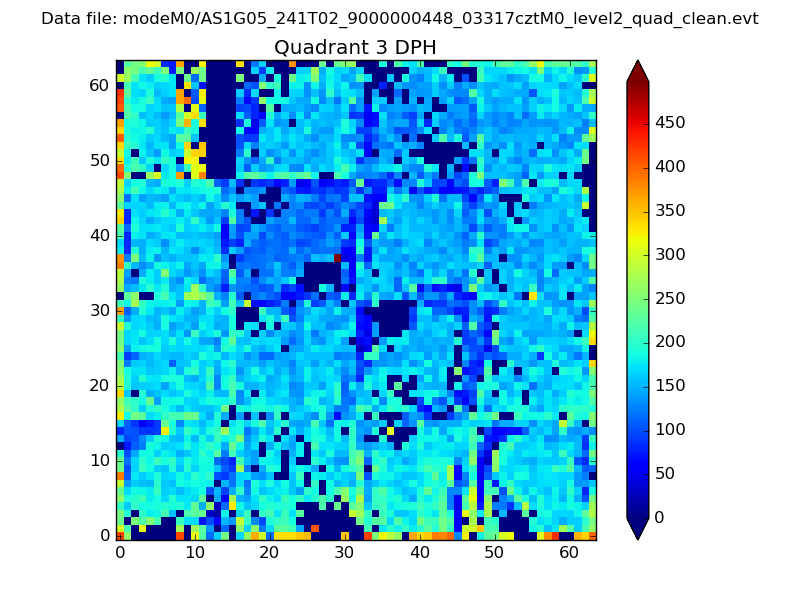 |
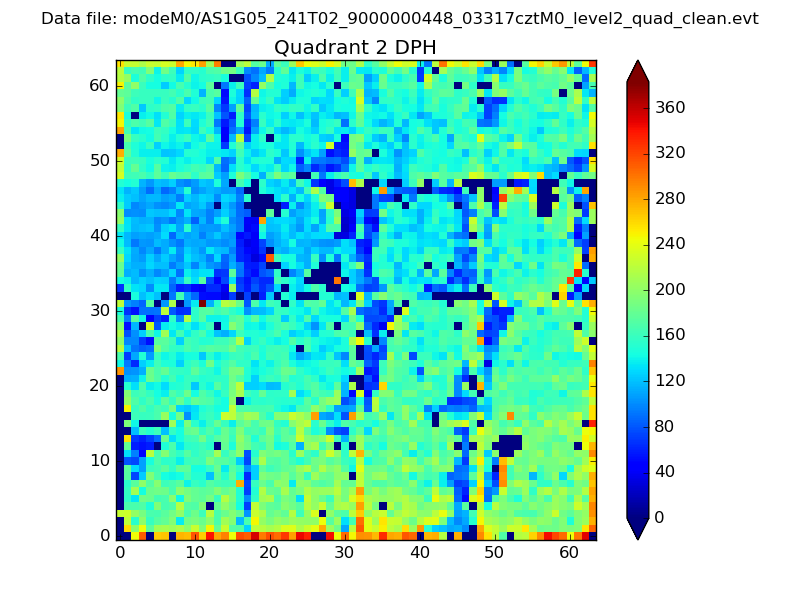 |
Quadrant C |
| Plot type | Count rate plots | Images |
|---|---|---|
| Comparison with Poisson distribution Blue bars denote a histogram of data divided into 1 sec bins. Red curve is a Poisson curve with rate = median count rate of data. |
 |
 |
| Quadrant-wise count rates Data is divided into 100 sec bins |
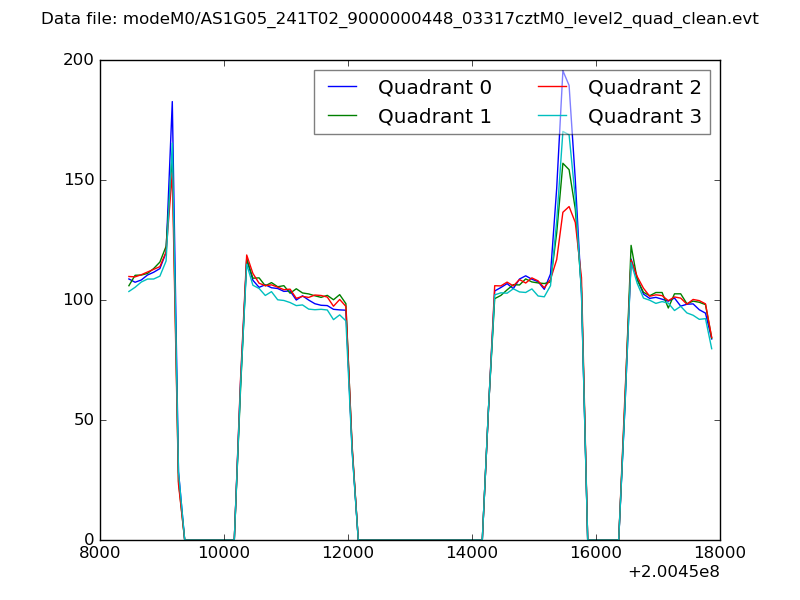 |
|
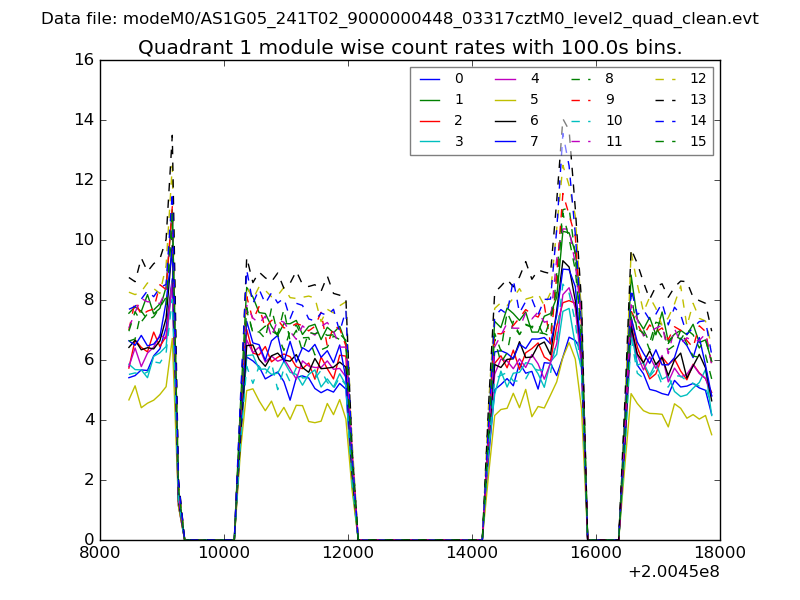
| Module-wise count rates for Quadrant A Data is divided into 100 sec bins |
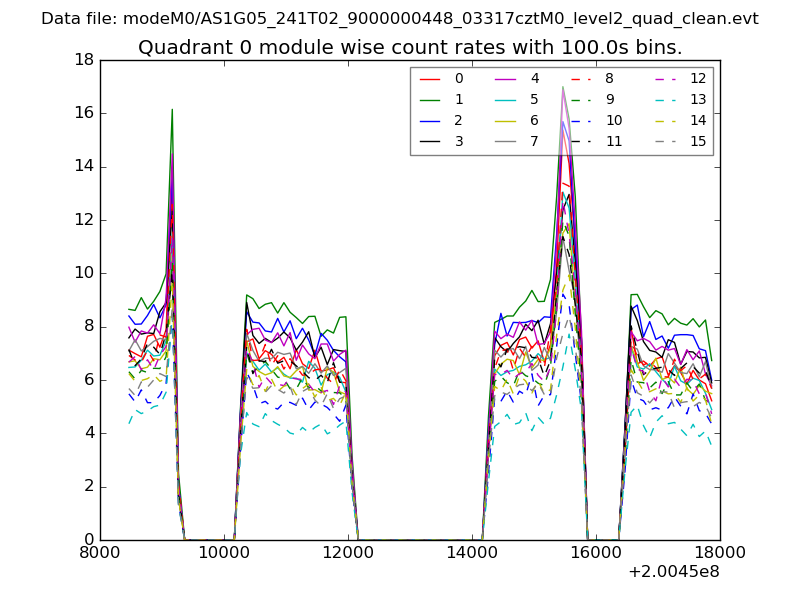 |
 |
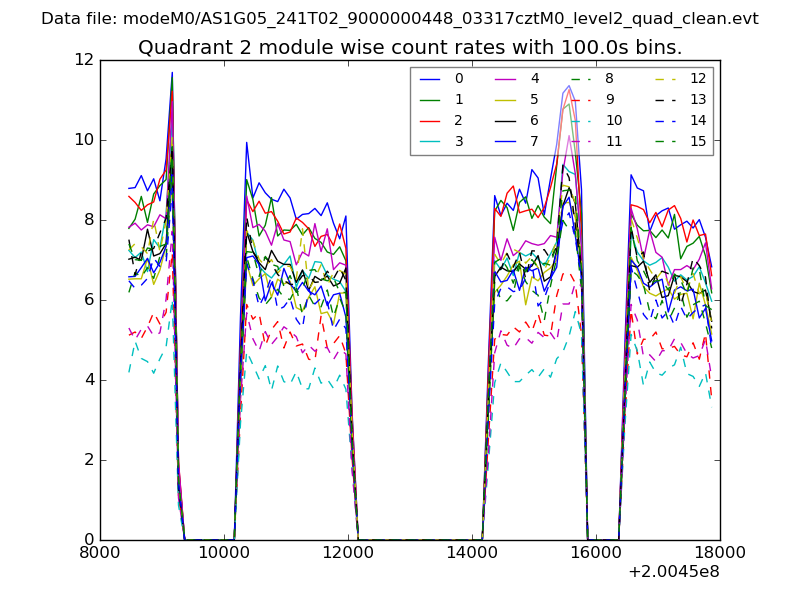
| Module-wise count rates for Quadrant B Data is divided into 100 sec bins |
 |
 |
| Module-wise count rates for Quadrant C Data is divided into 100 sec bins |
 |
 |
| Module-wise count rates for Quadrant D Data is divided into 100 sec bins |
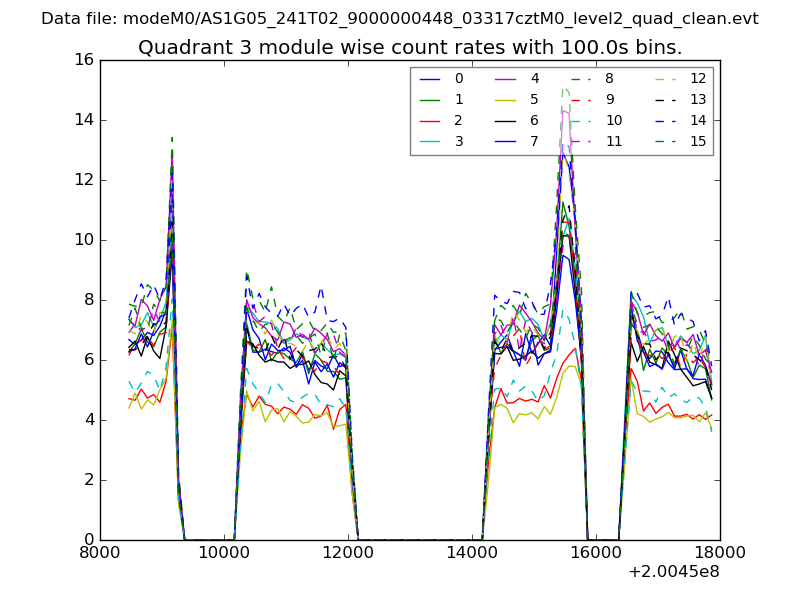 |
 |
| Parameter | Plot |
|---|---|
| CZT HV Monitor |  |
| D_VDD | 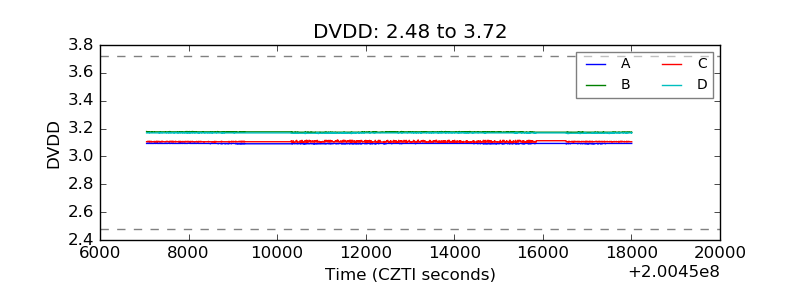 |
| Temperature 1 | 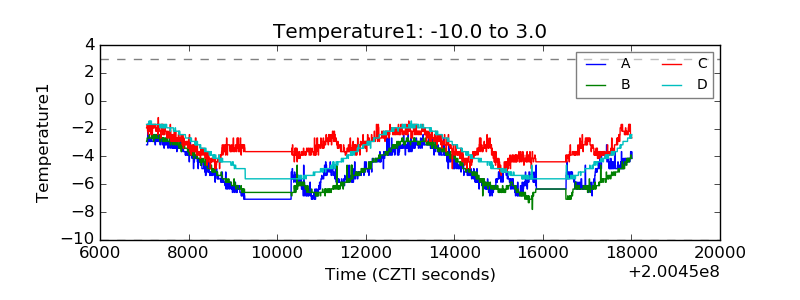 |
| Veto HV Monitor | 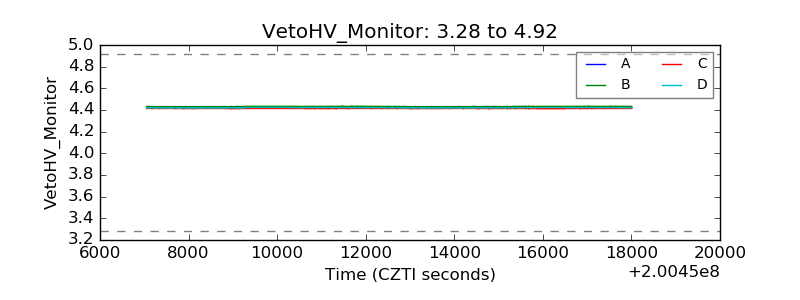 |
| Veto LLD | 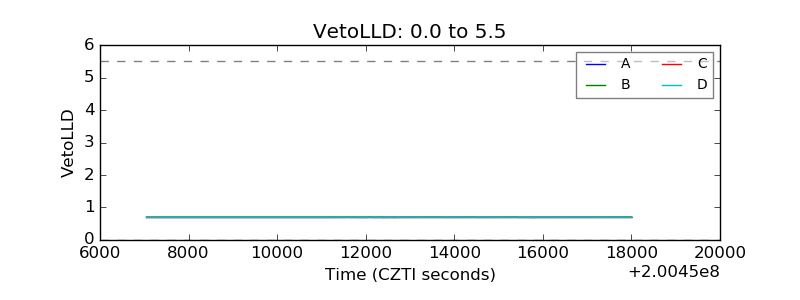 |
| Alpha Counter | 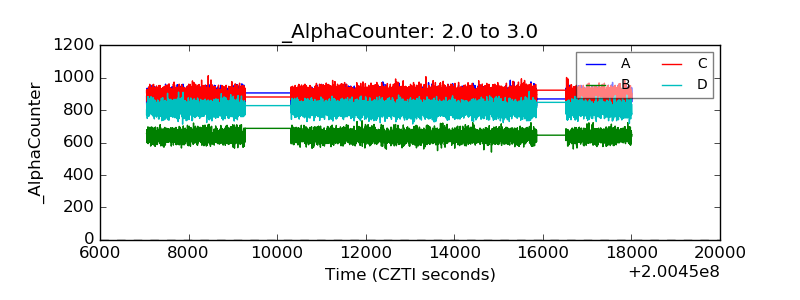 |
| _CPM_Rate | 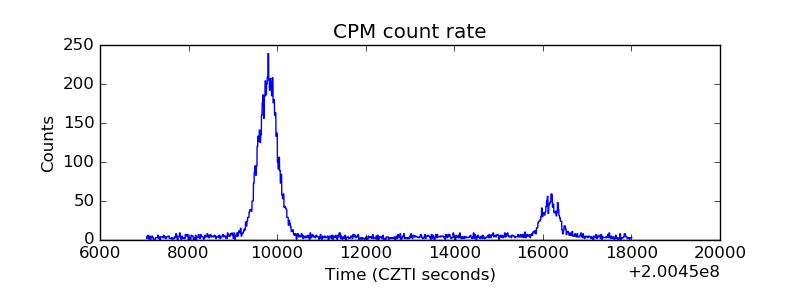 |
| CZT Counter | 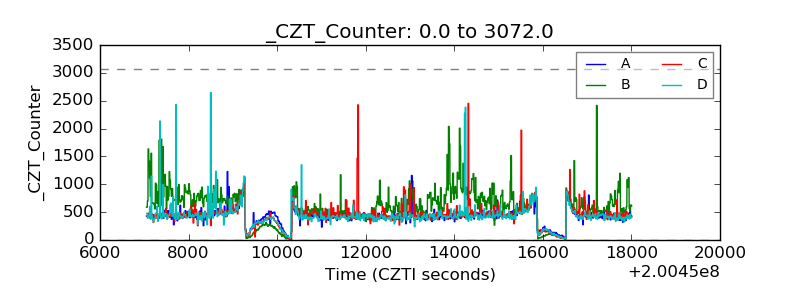 |
| +2.5 Volts monitor |  |
| +5 Volts monitor | 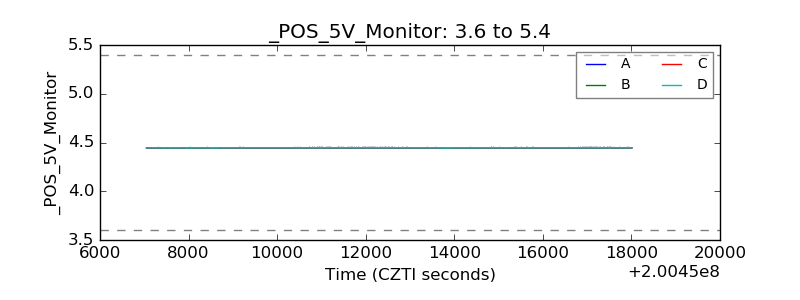 |
| Veto Counter | 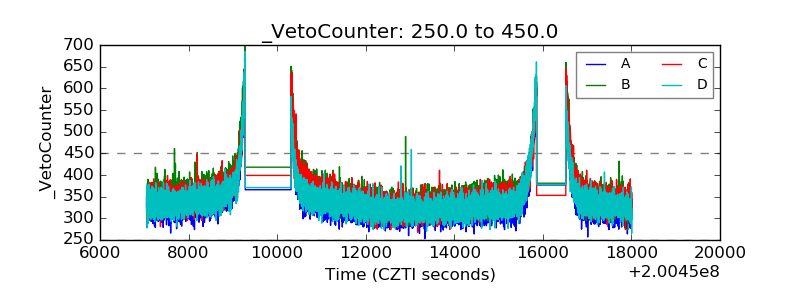 |