| Param | Original file | Final file |
|---|---|---|
| Filename | modeM0/AS1G05_241T02_9000000448_03319cztM0_level2.evt | modeM0/AS1G05_241T02_9000000448_03319cztM0_level2_quad_clean.evt |
| Size (bytes) | 519,465,600 | 76,132,800 |
| Size | 495.4 MB | 72.6 MB |
| Events in quadrant A | 3,448,336 | 445,843 |
| Events in quadrant B | 4,725,238 | 451,783 |
| Events in quadrant C | 3,486,686 | 451,983 |
| Events in quadrant D | 3,562,397 | 433,709 |
| Mode M0 | |||
|---|---|---|---|
| Quadrant | BADHDUFLAG | Total packets | Discarded packets |
| A | 0 | 15727 | 2 |
| B | 0 | 19000 | 1 |
| C | 0 | 15774 | 1 |
| D | 0 | 16258 | 1 |
| Mode SS | |||
|---|---|---|---|
| Quadrant | BADHDUFLAG | Total packets | Discarded packets |
| A | 0 | 150 | 0 |
| B | 0 | 150 | 0 |
| C | 0 | 150 | 0 |
| D | 0 | 150 | 0 |
| Quadrant | Total seconds | Saturated seconds | Saturation percentage |
|---|---|---|---|
| A | 7498 | 218 | 2.907442% |
| B | 7498 | 262 | 3.494265% |
| C | 7498 | 106 | 1.413710% |
| D | 7498 | 149 | 1.987197% |
Noise dominated data is calculated using 1-second bins in cleaned event files. If a bin has >2000 counts, and if more than 50% of those come from <1% of pixels, then it is considered to be noise-dominated and hence unusable.
| Quadrant | # 1 sec bins | Bins with >0 counts | Bins with >2000 counts | High rate bins dominated by noise | Noise dominated (total time) | Noise dominated (detector-on time) | Marked lightcurve |
|---|---|---|---|---|---|---|---|
| A | 7523 | 7499 | 2 | 2 | 0.03% | 0.03% | 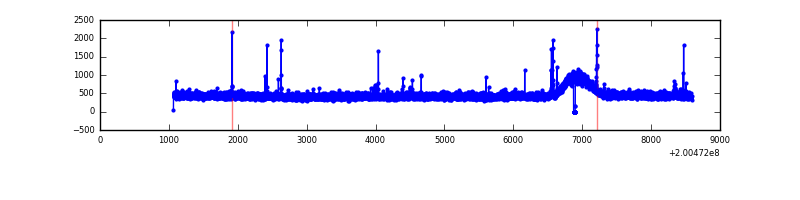 |
| B | 7523 | 7499 | 33 | 33 | 0.44% | 0.44% | 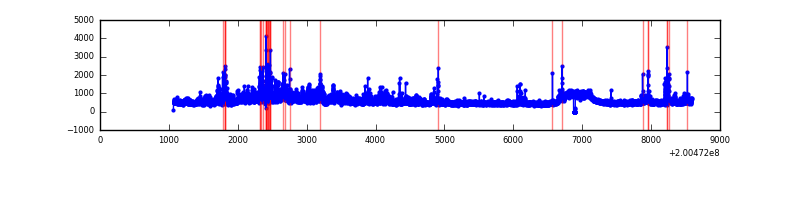 |
| C | 7523 | 7499 | 2 | 2 | 0.03% | 0.03% | 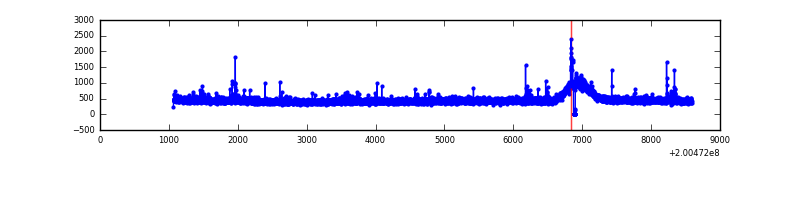 |
| D | 7523 | 7499 | 34 | 34 | 0.45% | 0.45% | 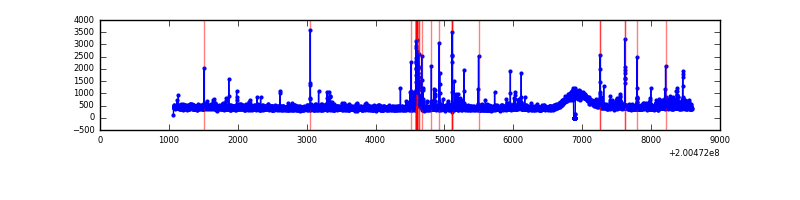 |
Top three noisy pixels from each quadrant. If the there are fewer than three noisy pixels in the level2.evt file, extra rows are filled as -1
| Pixel properties | Quadrant properties | ||||||
|---|---|---|---|---|---|---|---|
| Quadrant | DetID | PixID | Counts | Sigma | Mean | Median | Sigma |
| A | 0 | 50 | 20639 | 107.33 | 882 | 857 | 184.3 |
| A | 0 | 118 | 19811 | 102.84 | 882 | 857 | 184.3 |
| A | 0 | 226 | 10943 | 54.72 | 882 | 857 | 184.3 |
| B | 15 | 204 | 951468 | 5420.16 | 887 | 865 | 175.4 |
| B | 2 | 249 | 233831 | 1328.33 | 887 | 865 | 175.4 |
| B | 0 | 229 | 50562 | 283.36 | 887 | 865 | 175.4 |
| C | 12 | 4 | 37275 | 178.21 | 861 | 864 | 204.3 |
| C | 1 | 192 | 25966 | 122.86 | 861 | 864 | 204.3 |
| C | 1 | 16 | 15899 | 73.59 | 861 | 864 | 204.3 |
| D | 13 | 223 | 136169 | 644.79 | 860 | 833 | 209.9 |
| D | 5 | 233 | 60634 | 284.91 | 860 | 833 | 209.9 |
| D | 12 | 233 | 22791 | 104.62 | 860 | 833 | 209.9 |
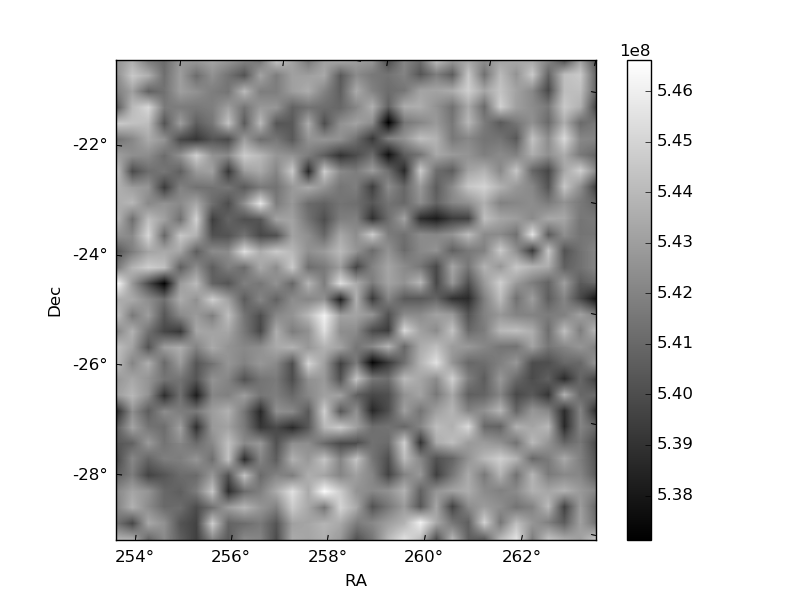
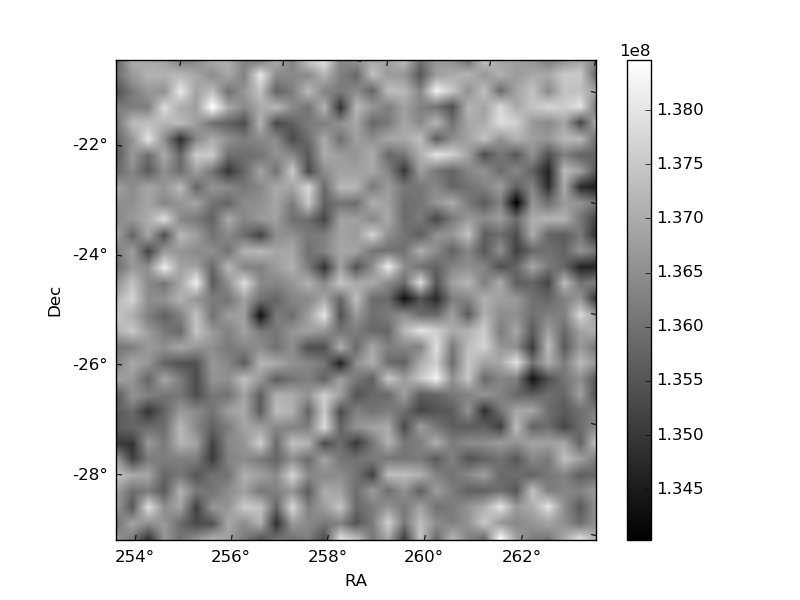
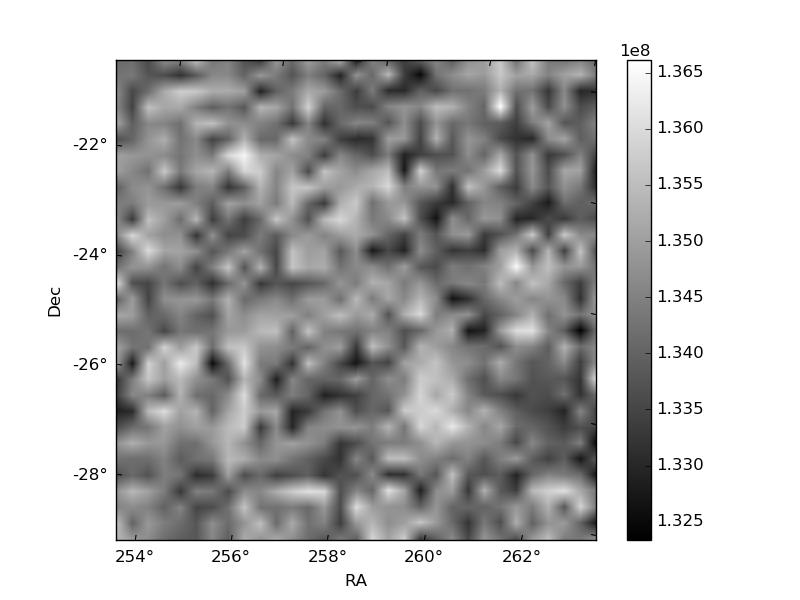
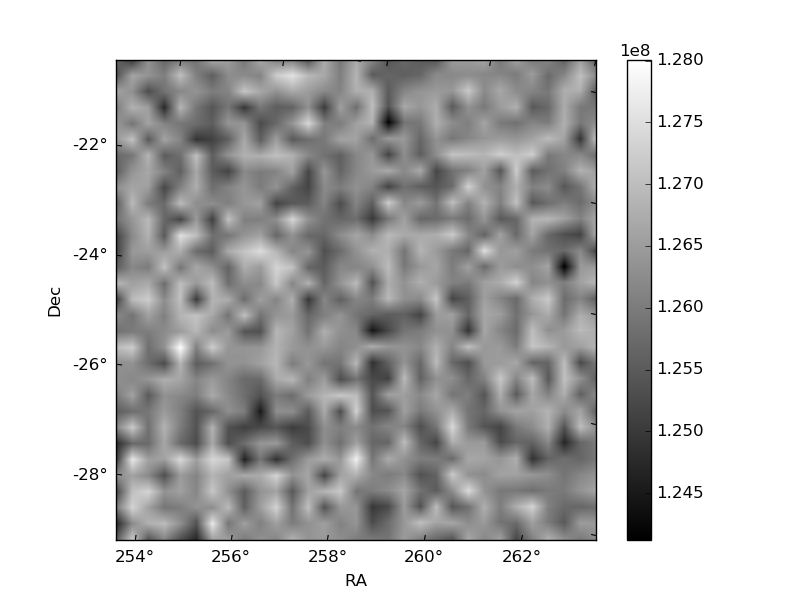
Histogram calculated using DETX and DETY for each event in the final _common_clean file
| Quadrant A | 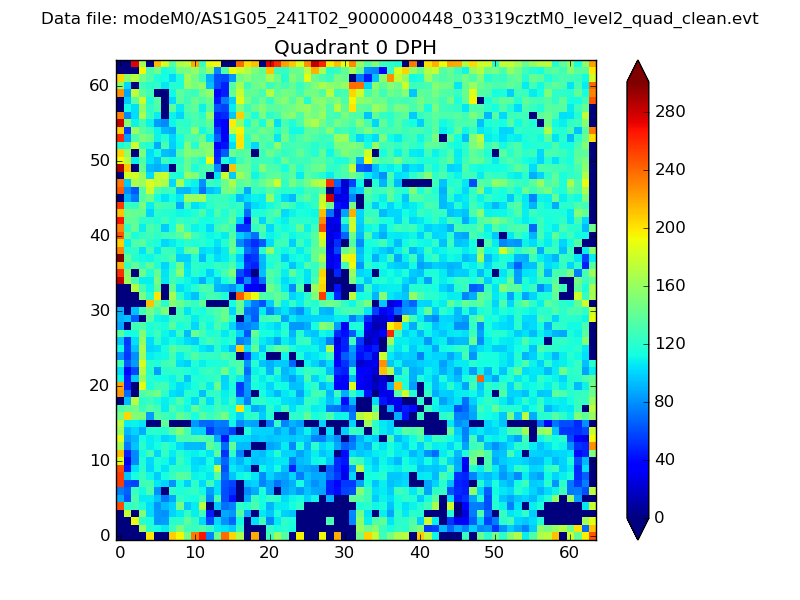 |
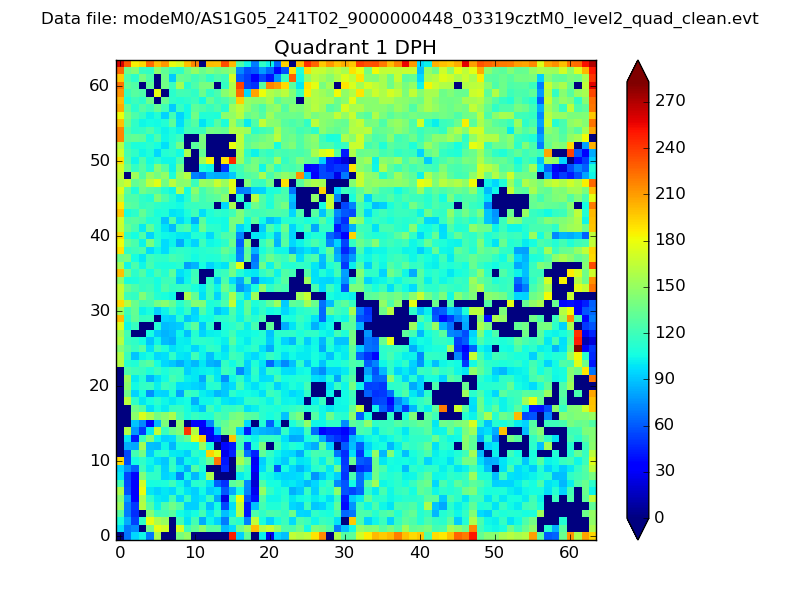 |
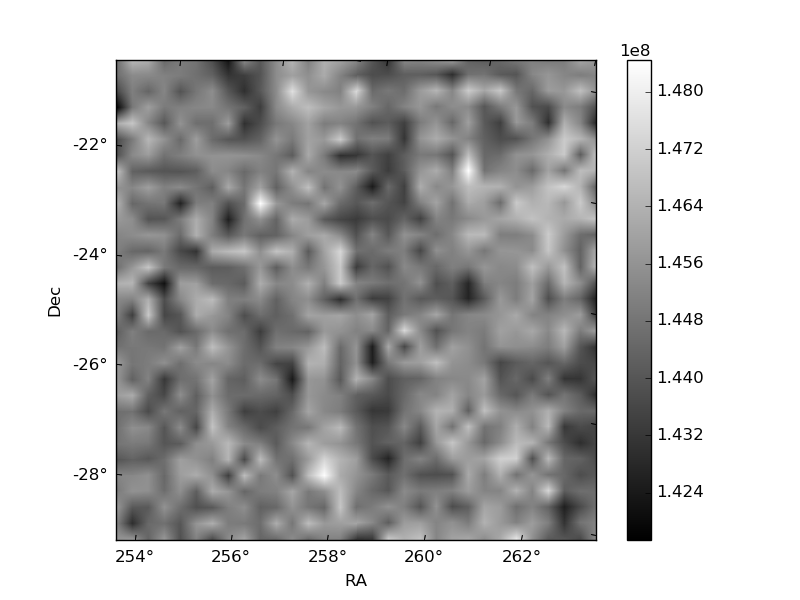
Quadrant B |
|---|---|---|---|
| Quadrant D | 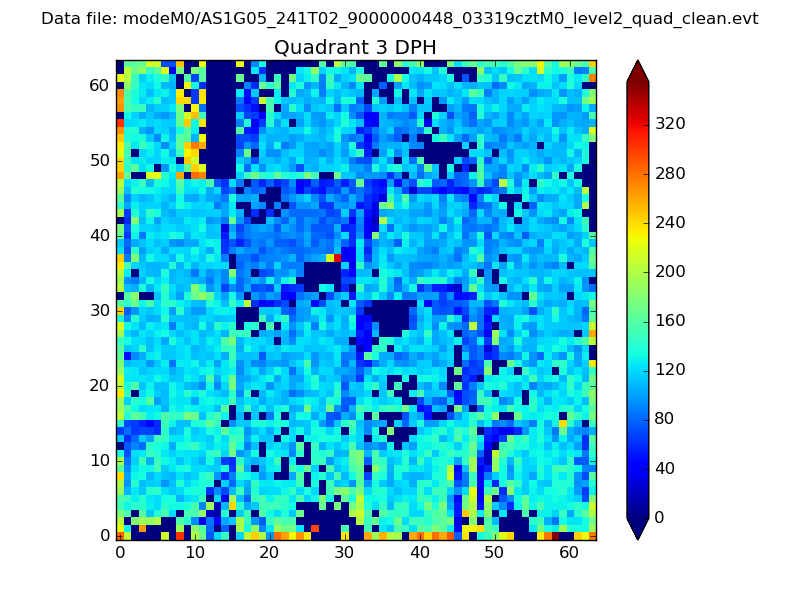 |
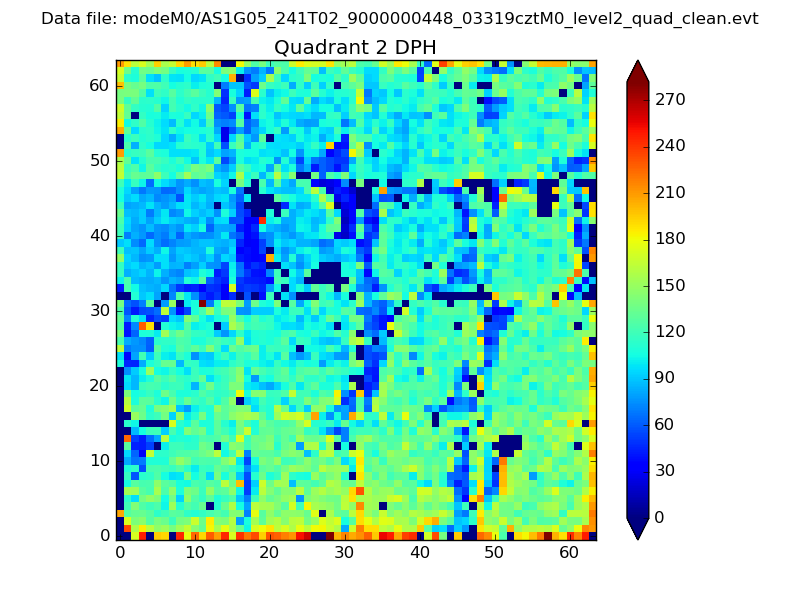 |
Quadrant C |
| Plot type | Count rate plots | Images |
|---|---|---|
| Comparison with Poisson distribution Blue bars denote a histogram of data divided into 1 sec bins. Red curve is a Poisson curve with rate = median count rate of data. |
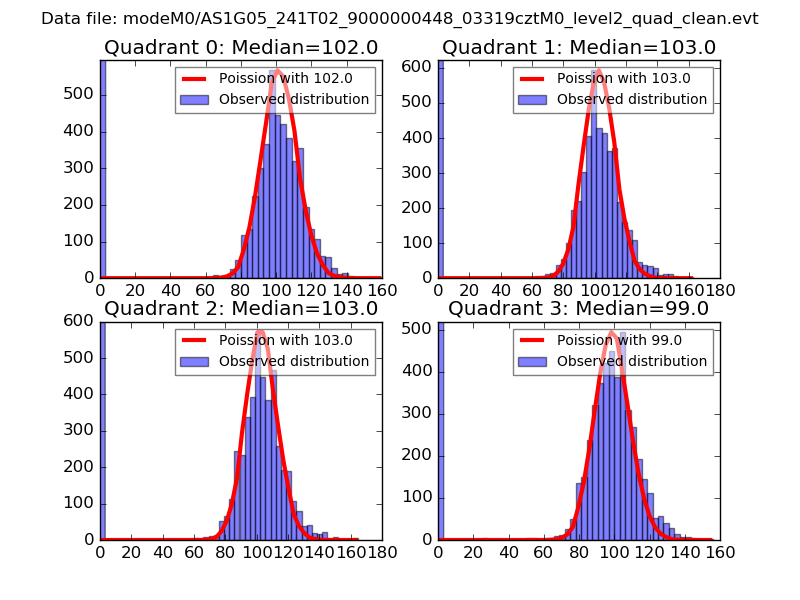 |
 |
| Quadrant-wise count rates Data is divided into 100 sec bins |
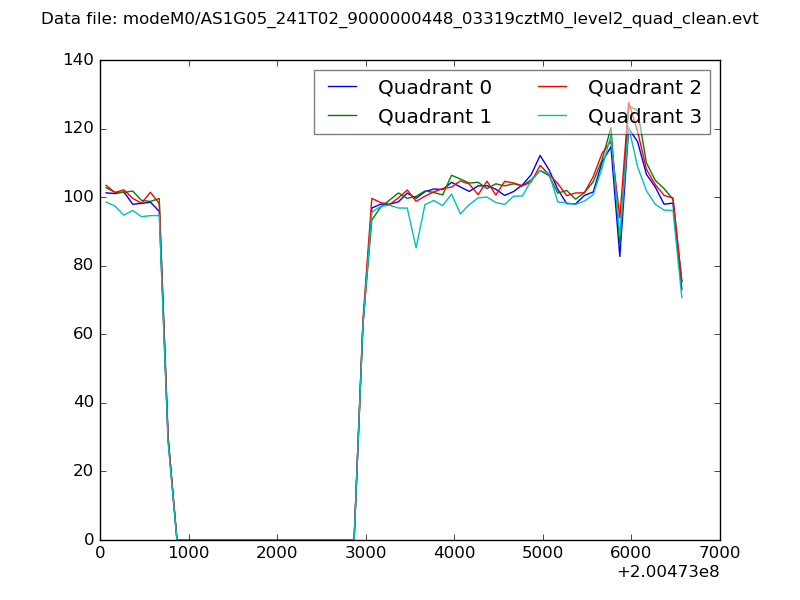 |
|
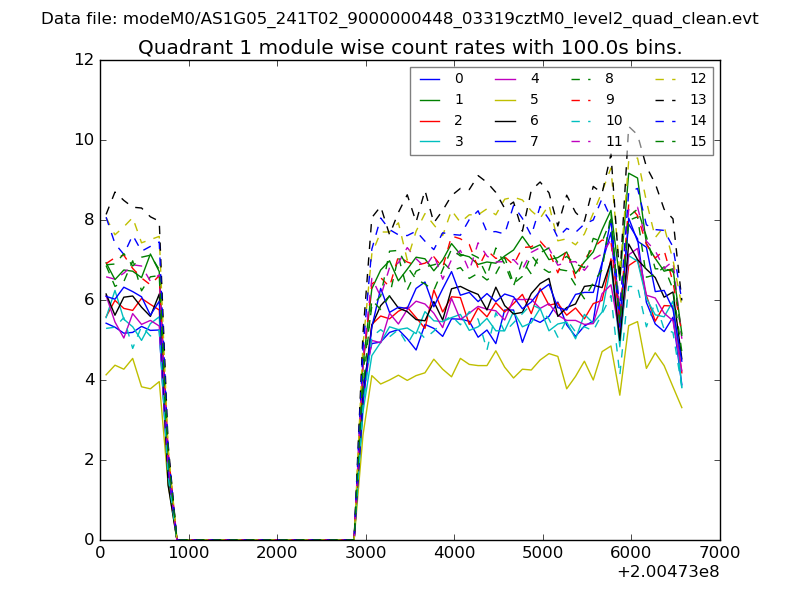
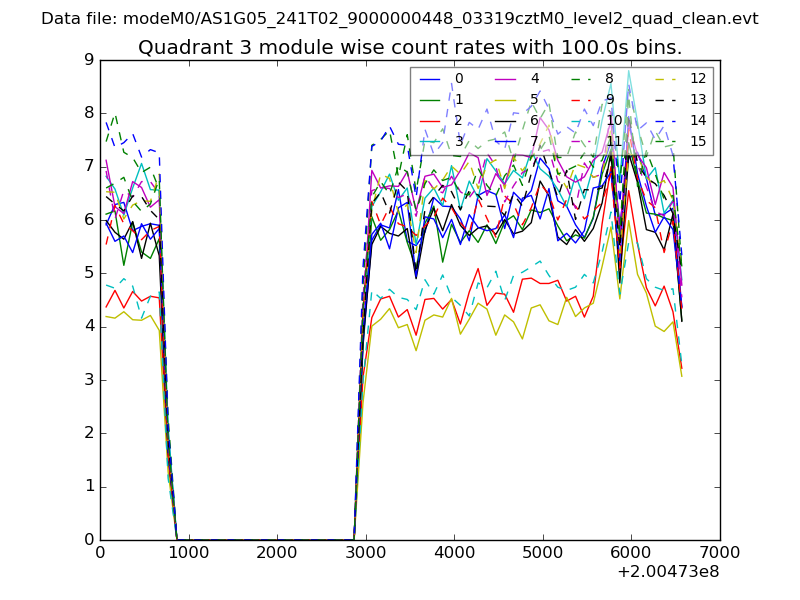
| Module-wise count rates for Quadrant A Data is divided into 100 sec bins |
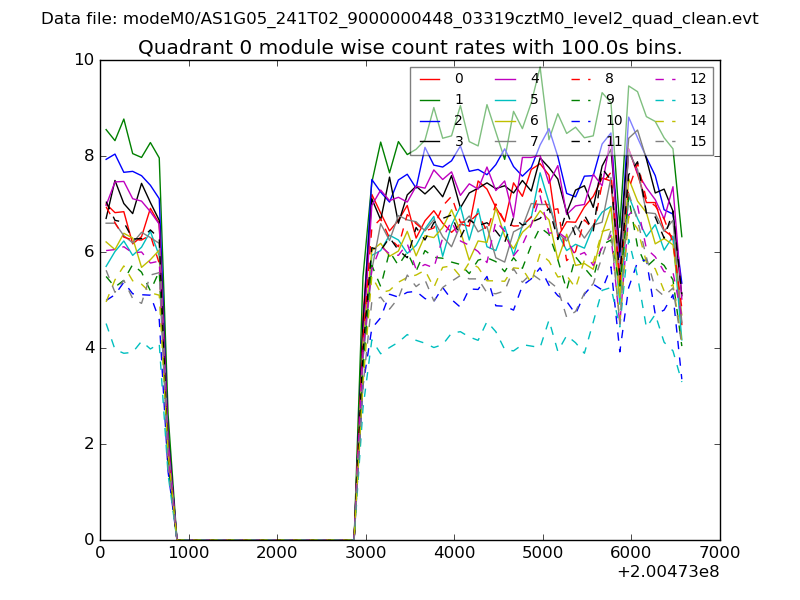 |
 |
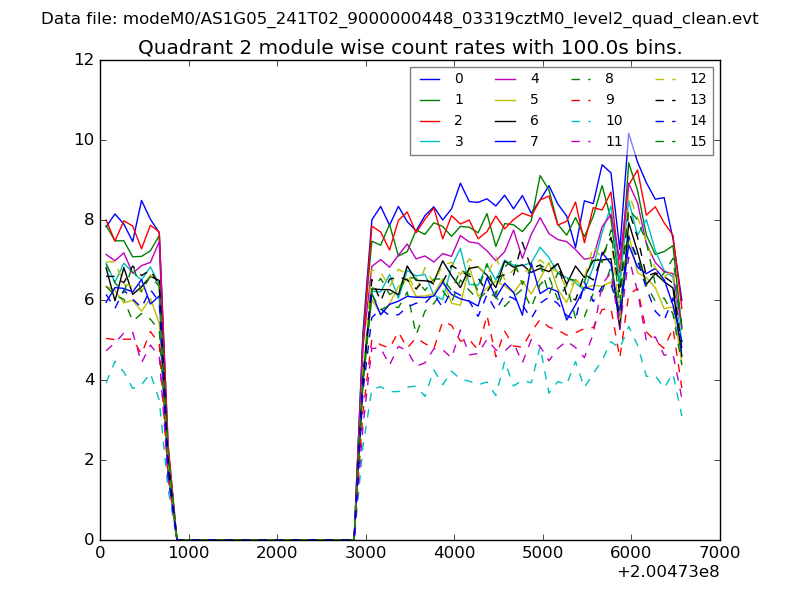
| Module-wise count rates for Quadrant B Data is divided into 100 sec bins |
 |
 |
| Module-wise count rates for Quadrant C Data is divided into 100 sec bins |
 |
 |
| Module-wise count rates for Quadrant D Data is divided into 100 sec bins |
 |
 |
| Parameter | Plot |
|---|---|
| CZT HV Monitor | 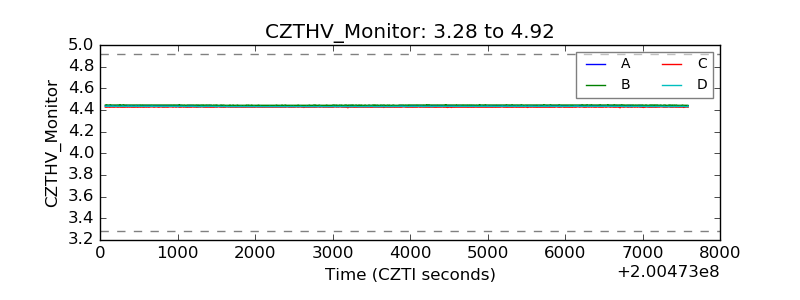 |
| D_VDD | 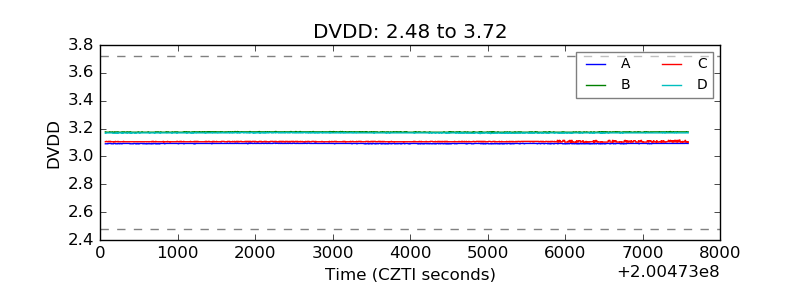 |
| Temperature 1 | 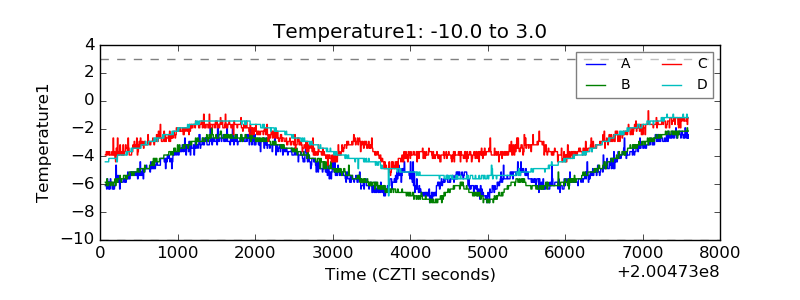 |
| Veto HV Monitor | 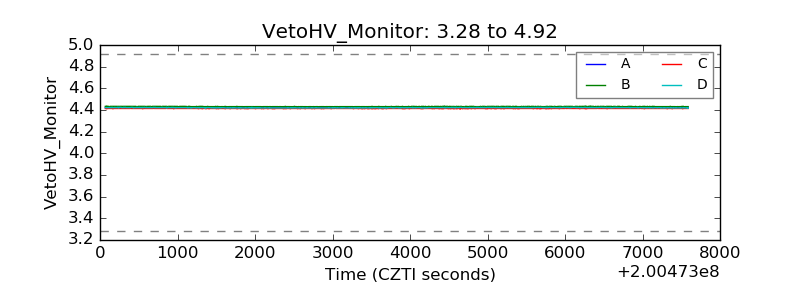 |
| Veto LLD | 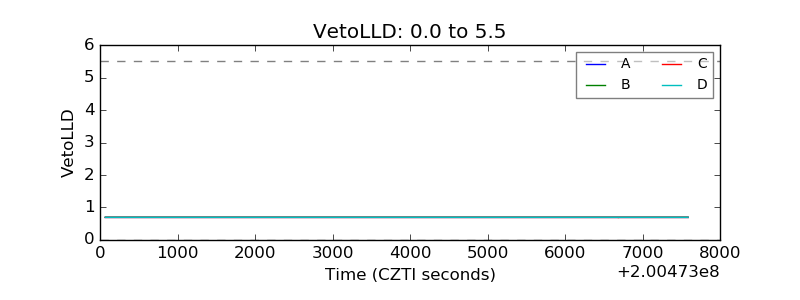 |
| Alpha Counter | 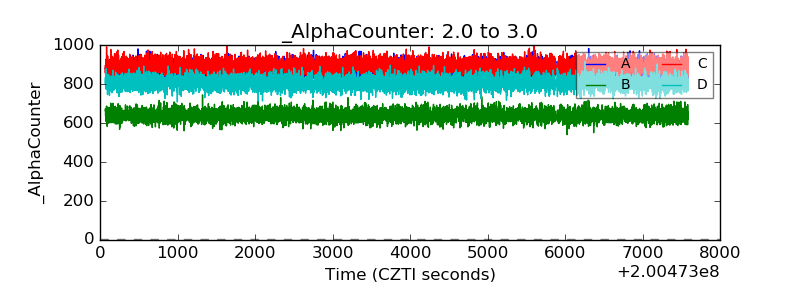 |
| _CPM_Rate | 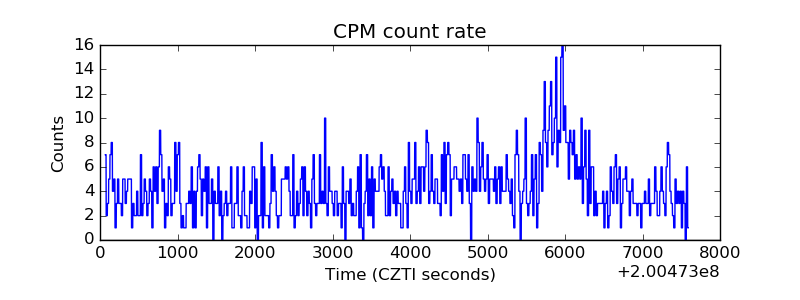 |
| CZT Counter | 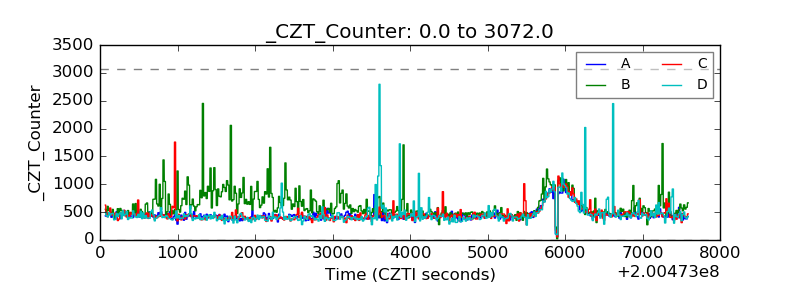 |
| +2.5 Volts monitor | 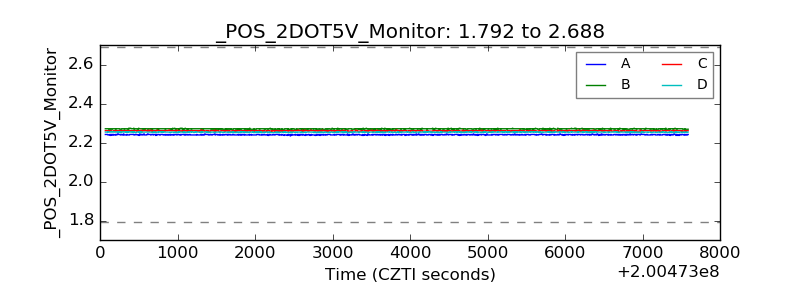 |
| +5 Volts monitor | 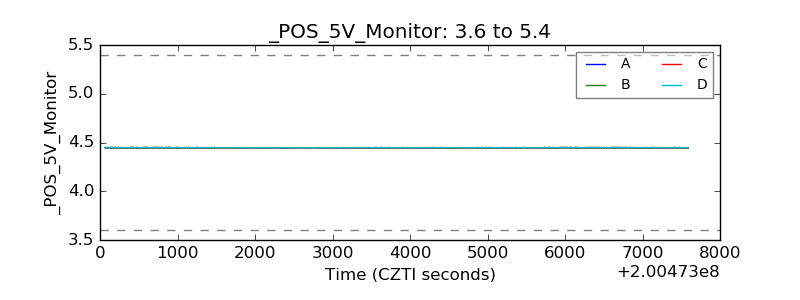 |
| _ROLL_ROT | 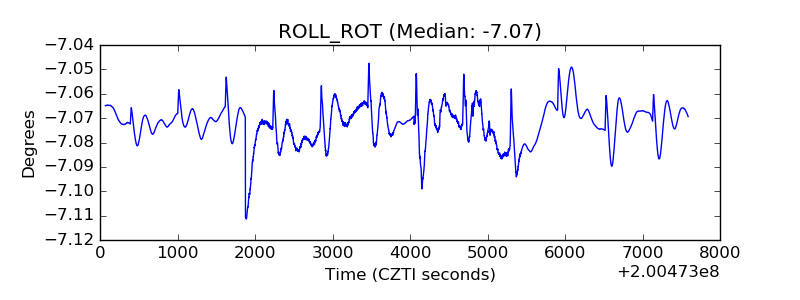 |
| _Roll_DEC | 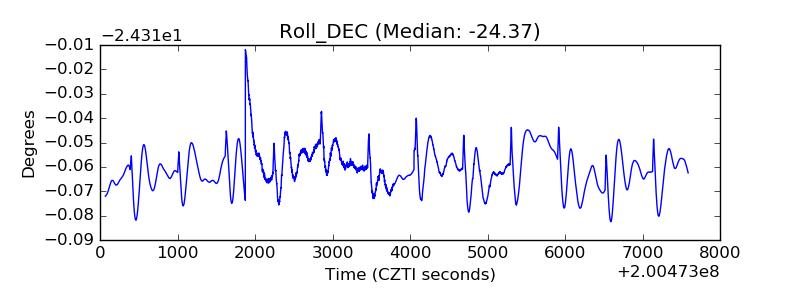 |
| _Roll_RA | 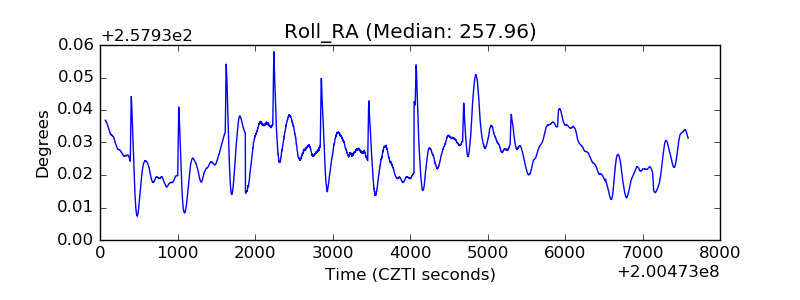 |
| Veto Counter | 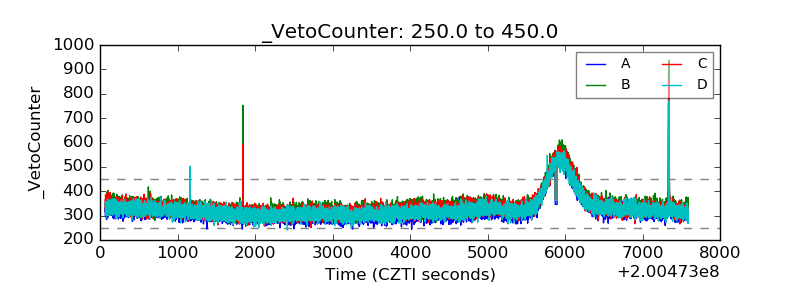 |