| Param | Original file | Final file |
|---|---|---|
| Filename | modeM0/AS1G05_241T02_9000000448_03320cztM0_level2.evt | modeM0/AS1G05_241T02_9000000448_03320cztM0_level2_quad_clean.evt |
| Size (bytes) | 602,760,960 | 78,932,160 |
| Size | 574.8 MB | 75.3 MB |
| Events in quadrant A | 4,023,145 | 455,827 |
| Events in quadrant B | 5,458,325 | 457,251 |
| Events in quadrant C | 4,088,394 | 464,041 |
| Events in quadrant D | 4,131,135 | 445,436 |
| Mode M0 | |||
|---|---|---|---|
| Quadrant | BADHDUFLAG | Total packets | Discarded packets |
| A | 0 | 17860 | 5 |
| B | 0 | 21623 | 4 |
| C | 0 | 17820 | 4 |
| D | 0 | 18383 | 4 |
| Mode SS | |||
|---|---|---|---|
| Quadrant | BADHDUFLAG | Total packets | Discarded packets |
| A | 0 | 166 | 0 |
| B | 0 | 166 | 0 |
| C | 0 | 166 | 0 |
| D | 0 | 166 | 0 |
| Mode M9 | |||
|---|---|---|---|
| Quadrant | BADHDUFLAG | Total packets | Discarded packets |
| A | 0 | 1 | 0 |
| B | 0 | 1 | 0 |
| C | 0 | 1 | 0 |
| D | 0 | 1 | 0 |
| Quadrant | Total seconds | Saturated seconds | Saturation percentage |
|---|---|---|---|
| A | 8152 | 437 | 5.360648% |
| B | 8152 | 667 | 8.182041% |
| C | 8152 | 276 | 3.385672% |
| D | 8152 | 348 | 4.268891% |
Noise dominated data is calculated using 1-second bins in cleaned event files. If a bin has >2000 counts, and if more than 50% of those come from <1% of pixels, then it is considered to be noise-dominated and hence unusable.
| Quadrant | # 1 sec bins | Bins with >0 counts | Bins with >2000 counts | High rate bins dominated by noise | Noise dominated (total time) | Noise dominated (detector-on time) | Marked lightcurve |
|---|---|---|---|---|---|---|---|
| A | 8327 | 8156 | 15 | 15 | 0.18% | 0.18% | 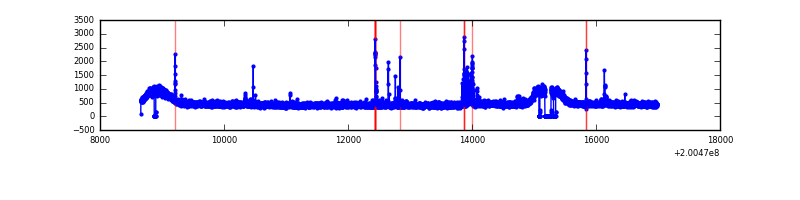 |
| B | 8327 | 8156 | 108 | 108 | 1.30% | 1.32% | 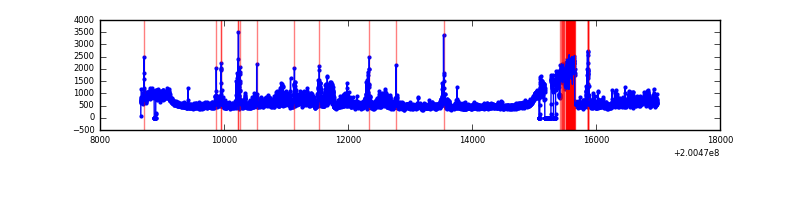 |
| C | 8327 | 8156 | 8 | 8 | 0.10% | 0.10% | 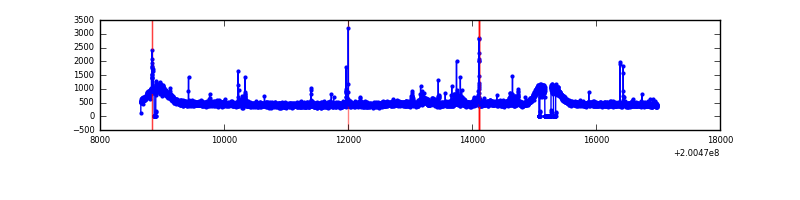 |
| D | 8327 | 8156 | 57 | 57 | 0.68% | 0.70% | 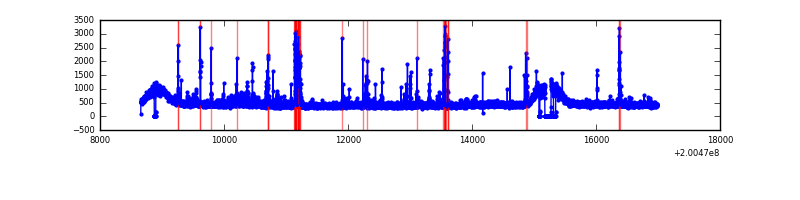 |
Top three noisy pixels from each quadrant. If the there are fewer than three noisy pixels in the level2.evt file, extra rows are filled as -1
| Pixel properties | Quadrant properties | ||||||
|---|---|---|---|---|---|---|---|
| Quadrant | DetID | PixID | Counts | Sigma | Mean | Median | Sigma |
| A | 0 | 50 | 110171 | 521.69 | 1002 | 976 | 209.3 |
| A | 0 | 118 | 44001 | 205.56 | 1002 | 976 | 209.3 |
| A | 0 | 226 | 14209 | 63.22 | 1002 | 976 | 209.3 |
| B | 15 | 204 | 820543 | 4119.97 | 994 | 971 | 198.9 |
| B | 6 | 203 | 444463 | 2229.42 | 994 | 971 | 198.9 |
| B | 2 | 249 | 158253 | 790.65 | 994 | 971 | 198.9 |
| C | 1 | 192 | 147331 | 626.57 | 979 | 982 | 233.6 |
| C | 1 | 16 | 29763 | 123.22 | 979 | 982 | 233.6 |
| C | 8 | 128 | 22410 | 91.74 | 979 | 982 | 233.6 |
| D | 13 | 223 | 218391 | 888.87 | 981 | 950 | 244.6 |
| D | 2 | 206 | 62410 | 251.24 | 981 | 950 | 244.6 |
| D | 5 | 233 | 54985 | 220.89 | 981 | 950 | 244.6 |
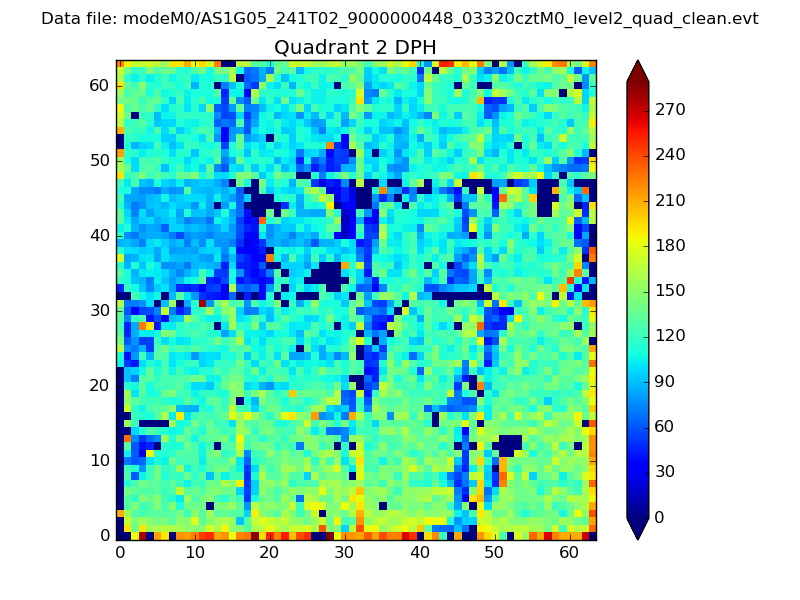
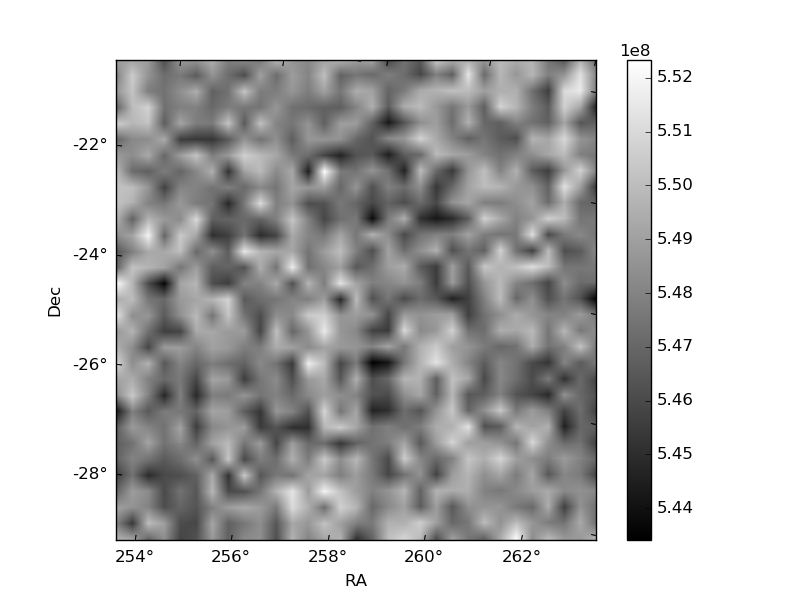
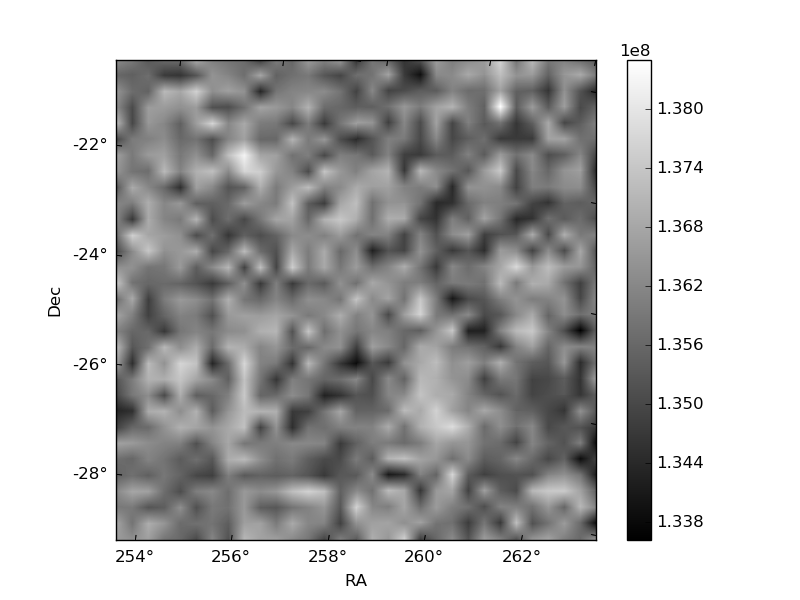
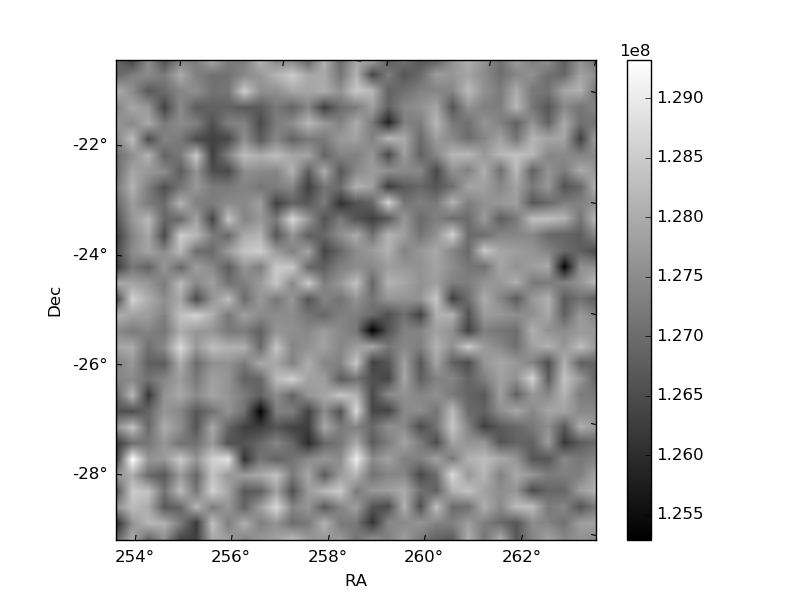
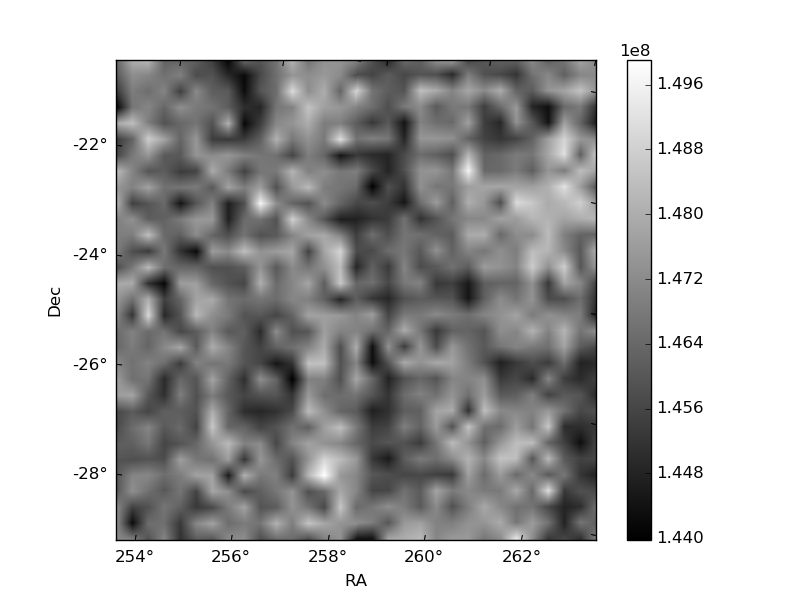
Histogram calculated using DETX and DETY for each event in the final _common_clean file
| Quadrant A | 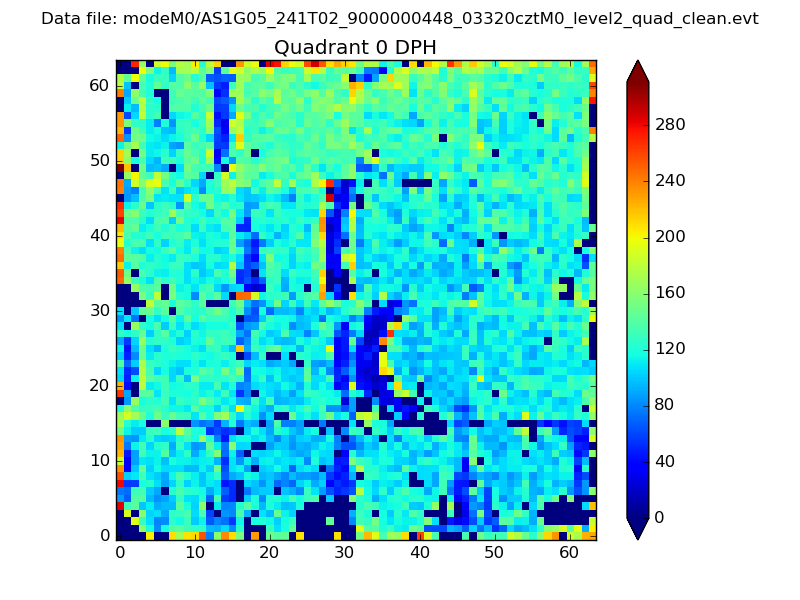 |
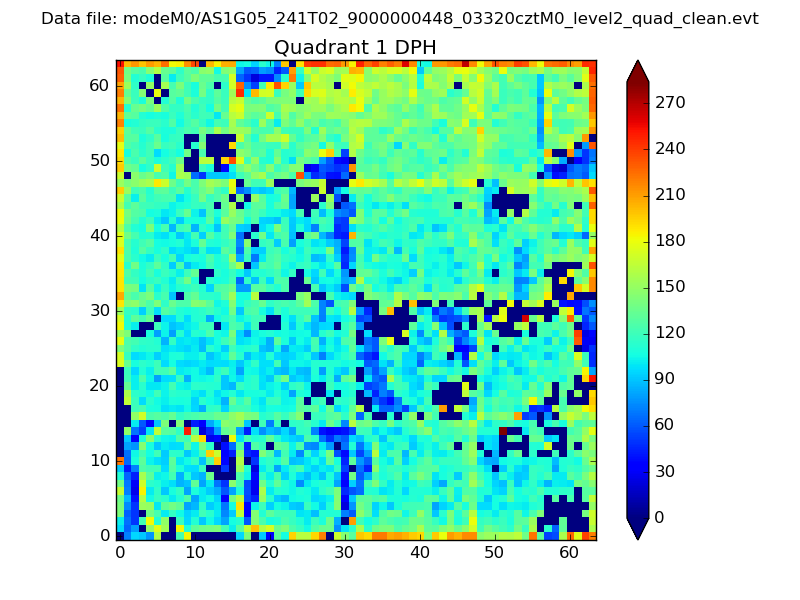 |
Quadrant B |
|---|---|---|---|
| Quadrant D | 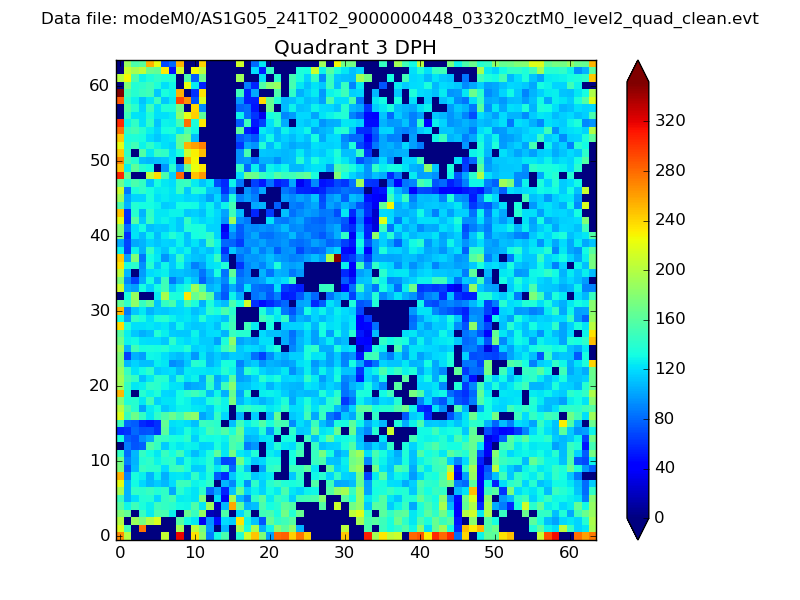 |
 |
Quadrant C |
| Plot type | Count rate plots | Images |
|---|---|---|
| Comparison with Poisson distribution Blue bars denote a histogram of data divided into 1 sec bins. Red curve is a Poisson curve with rate = median count rate of data. |
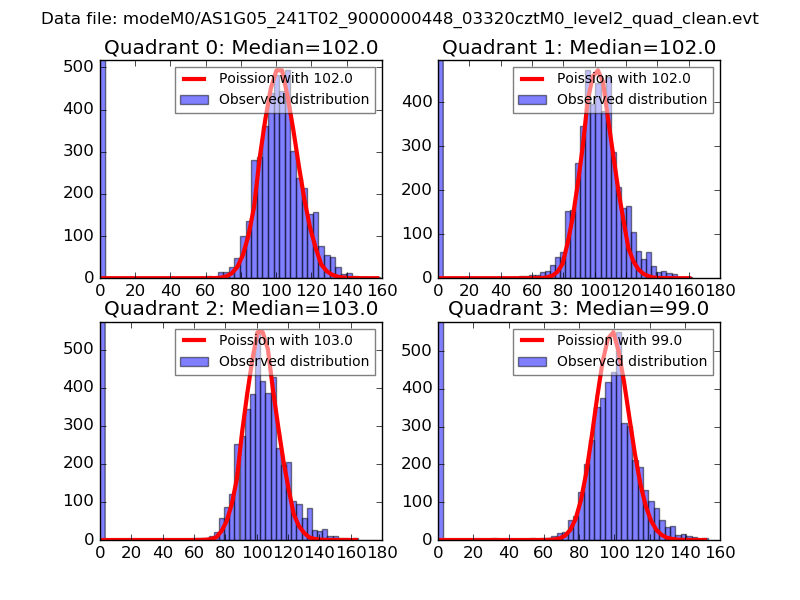 |
 |
| Quadrant-wise count rates Data is divided into 100 sec bins |
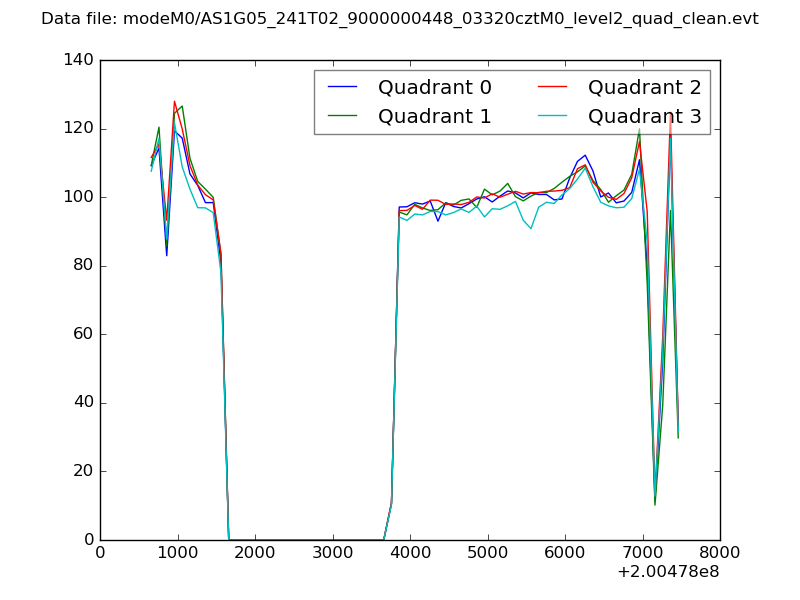 |
|
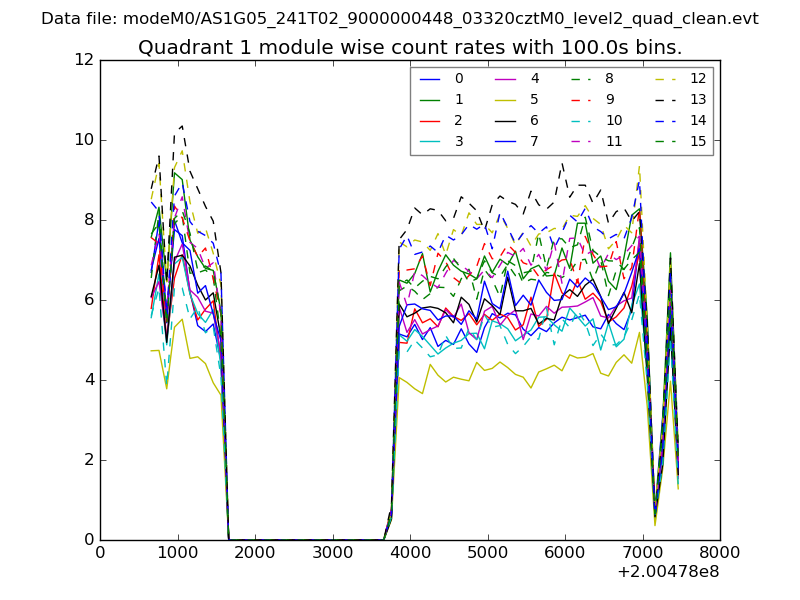
| Module-wise count rates for Quadrant A Data is divided into 100 sec bins |
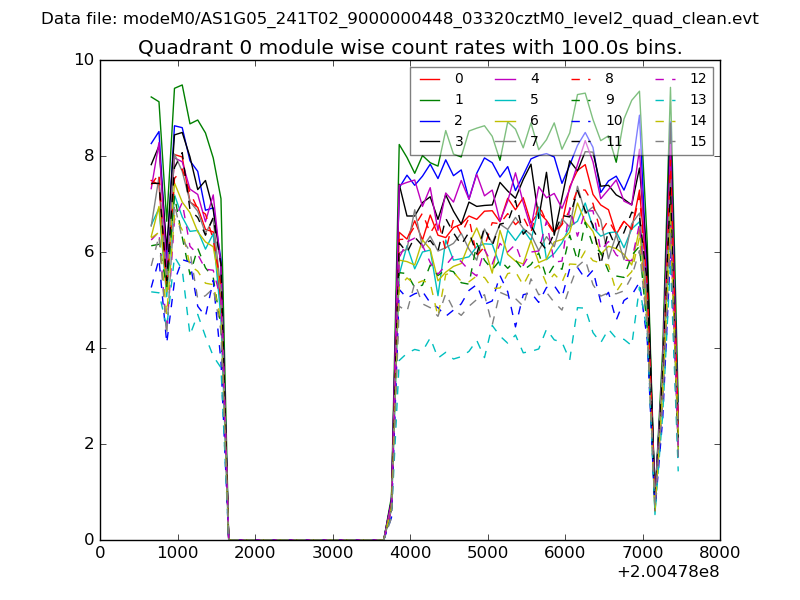 |
 |
| Module-wise count rates for Quadrant B Data is divided into 100 sec bins |
 |
 |
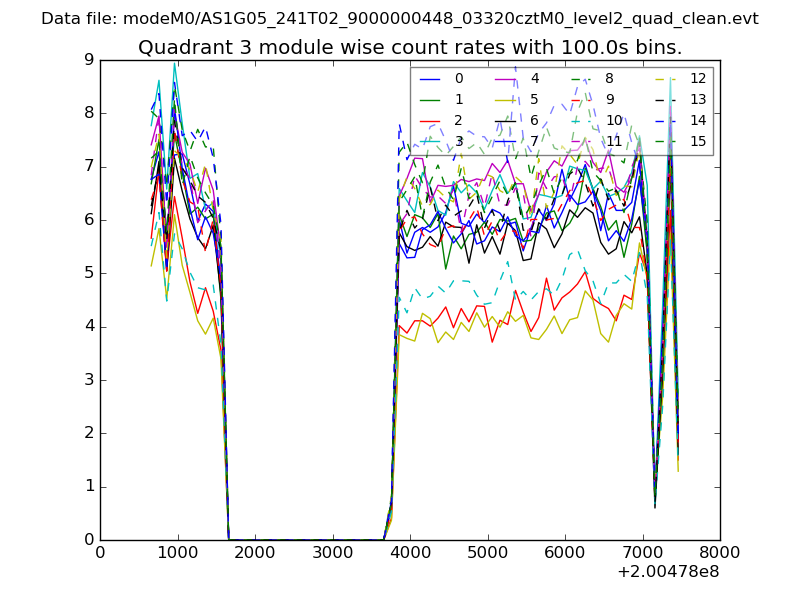
| Module-wise count rates for Quadrant C Data is divided into 100 sec bins |
 |
 |
| Module-wise count rates for Quadrant D Data is divided into 100 sec bins |
 |
 |
| Parameter | Plot |
|---|---|
| CZT HV Monitor | 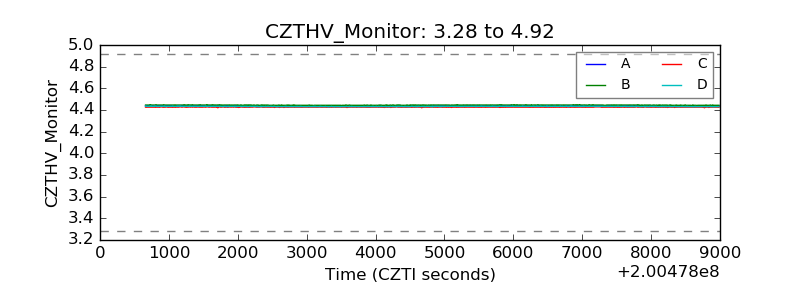 |
| D_VDD | 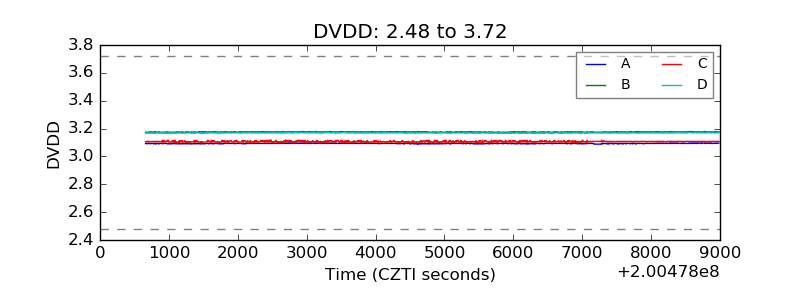 |
| Temperature 1 | 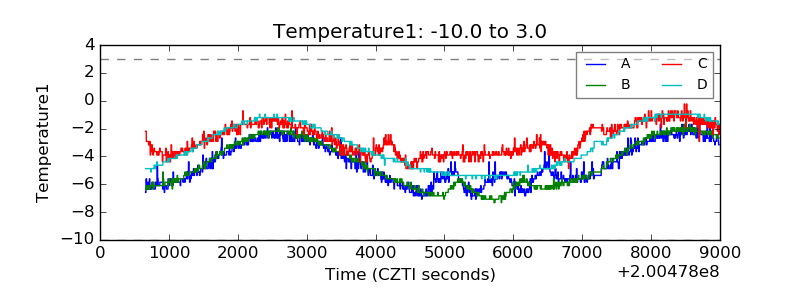 |
| Veto HV Monitor | 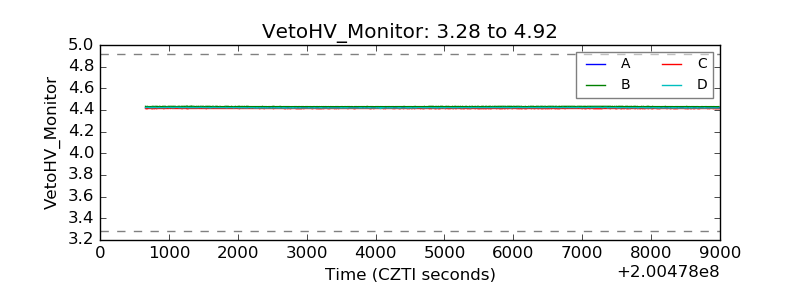 |
| Veto LLD | 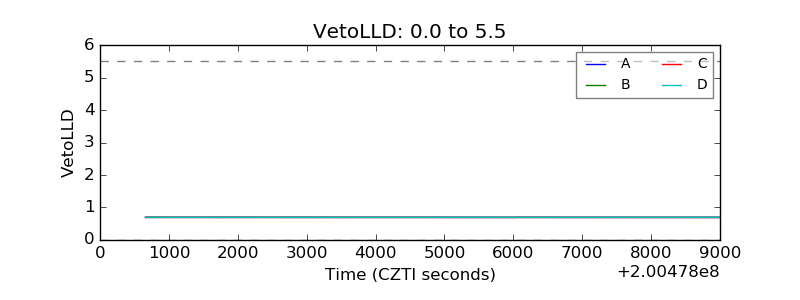 |
| Alpha Counter | 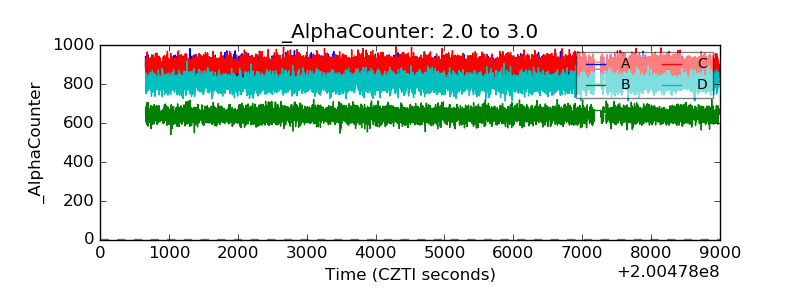 |
| _CPM_Rate | 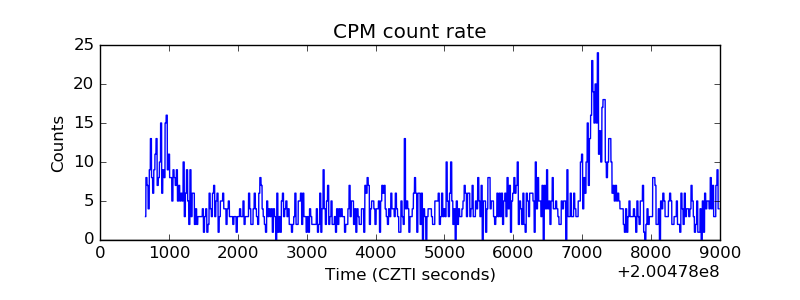 |
| CZT Counter | 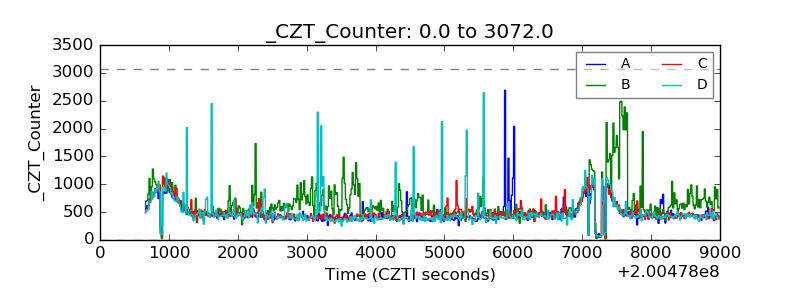 |
| +2.5 Volts monitor |  |
| +5 Volts monitor |  |
| _ROLL_ROT | 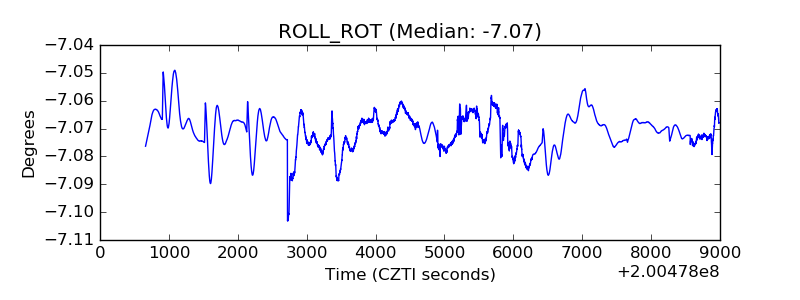 |
| _Roll_DEC | 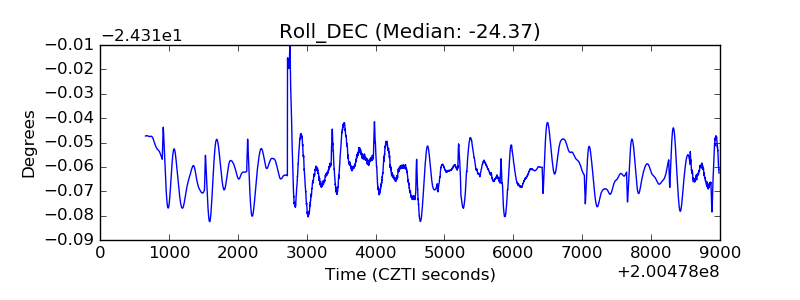 |
| _Roll_RA | 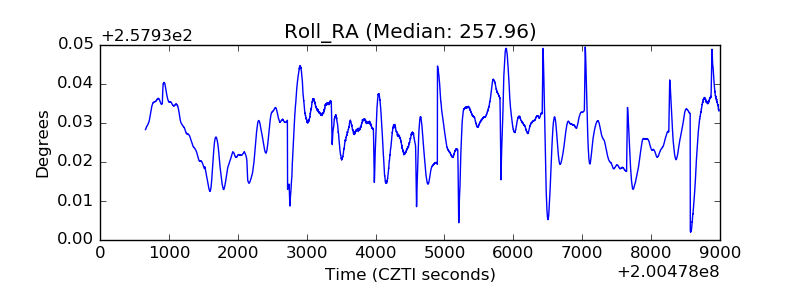 |
| Veto Counter |  |