| Param | Original file | Final file |
|---|---|---|
| Filename | modeM0/AS1G05_241T02_9000000448_03324cztM0_level2.evt | modeM0/AS1G05_241T02_9000000448_03324cztM0_level2_quad_clean.evt |
| Size (bytes) | 327,133,440 | 57,666,240 |
| Size | 312.0 MB | 55.0 MB |
| Events in quadrant A | 2,130,322 | 353,240 |
| Events in quadrant B | 2,664,833 | 354,476 |
| Events in quadrant C | 2,631,198 | 351,027 |
| Events in quadrant D | 2,147,330 | 343,875 |
| Mode M0 | |||
|---|---|---|---|
| Quadrant | BADHDUFLAG | Total packets | Discarded packets |
| A | 0 | 10020 | 0 |
| B | 0 | 11186 | 0 |
| C | 0 | 11358 | 0 |
| D | 0 | 10202 | 0 |
| Mode SS | |||
|---|---|---|---|
| Quadrant | BADHDUFLAG | Total packets | Discarded packets |
| A | 0 | 98 | 0 |
| B | 0 | 98 | 0 |
| C | 0 | 98 | 0 |
| D | 0 | 98 | 0 |
| Quadrant | Total seconds | Saturated seconds | Saturation percentage |
|---|---|---|---|
| A | 4891 | 50 | 1.022286% |
| B | 4891 | 63 | 1.288080% |
| C | 4891 | 122 | 2.494377% |
| D | 4891 | 38 | 0.776937% |
Noise dominated data is calculated using 1-second bins in cleaned event files. If a bin has >2000 counts, and if more than 50% of those come from <1% of pixels, then it is considered to be noise-dominated and hence unusable.
| Quadrant | # 1 sec bins | Bins with >0 counts | Bins with >2000 counts | High rate bins dominated by noise | Noise dominated (total time) | Noise dominated (detector-on time) | Marked lightcurve |
|---|---|---|---|---|---|---|---|
| A | 4891 | 4891 | 4 | 4 | 0.08% | 0.08% | 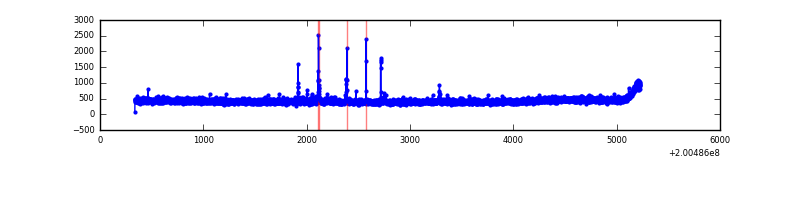 |
| B | 4891 | 4891 | 15 | 15 | 0.31% | 0.31% | 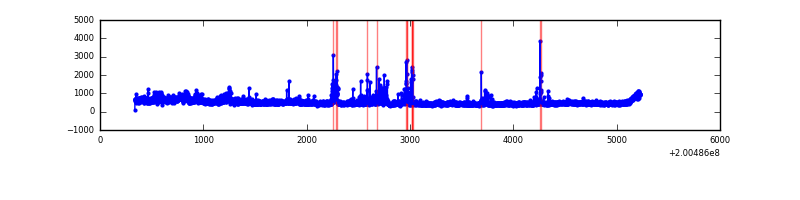 |
| C | 4891 | 4891 | 89 | 89 | 1.82% | 1.82% | 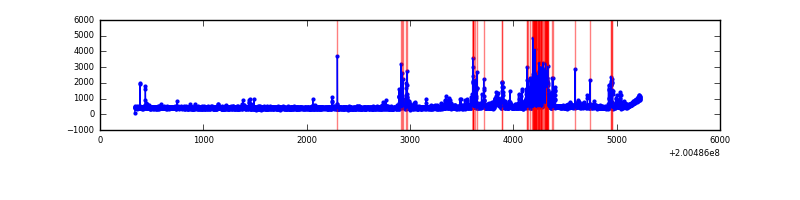 |
| D | 4891 | 4891 | 10 | 10 | 0.20% | 0.20% | 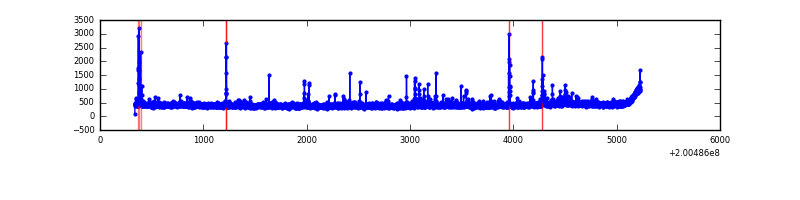 |
Top three noisy pixels from each quadrant. If the there are fewer than three noisy pixels in the level2.evt file, extra rows are filled as -1
| Pixel properties | Quadrant properties | ||||||
|---|---|---|---|---|---|---|---|
| Quadrant | DetID | PixID | Counts | Sigma | Mean | Median | Sigma |
| A | 0 | 118 | 29009 | 249.97 | 541 | 527 | 113.9 |
| A | 0 | 50 | 11077 | 92.59 | 541 | 527 | 113.9 |
| A | 0 | 226 | 8272 | 67.97 | 541 | 527 | 113.9 |
| B | 15 | 204 | 288015 | 2637.64 | 551 | 538 | 109.0 |
| B | 2 | 249 | 167334 | 1530.38 | 551 | 538 | 109.0 |
| B | 0 | 229 | 39807 | 360.3 | 551 | 538 | 109.0 |
| C | 14 | 223 | 497961 | 3977.23 | 529 | 532 | 125.1 |
| C | 1 | 16 | 38688 | 305.08 | 529 | 532 | 125.1 |
| C | 6 | 80 | 8021 | 59.88 | 529 | 532 | 125.1 |
| D | 14 | 34 | 48533 | 370.03 | 528 | 511 | 129.8 |
| D | 13 | 223 | 41871 | 318.69 | 528 | 511 | 129.8 |
| D | 13 | 239 | 32333 | 245.2 | 528 | 511 | 129.8 |
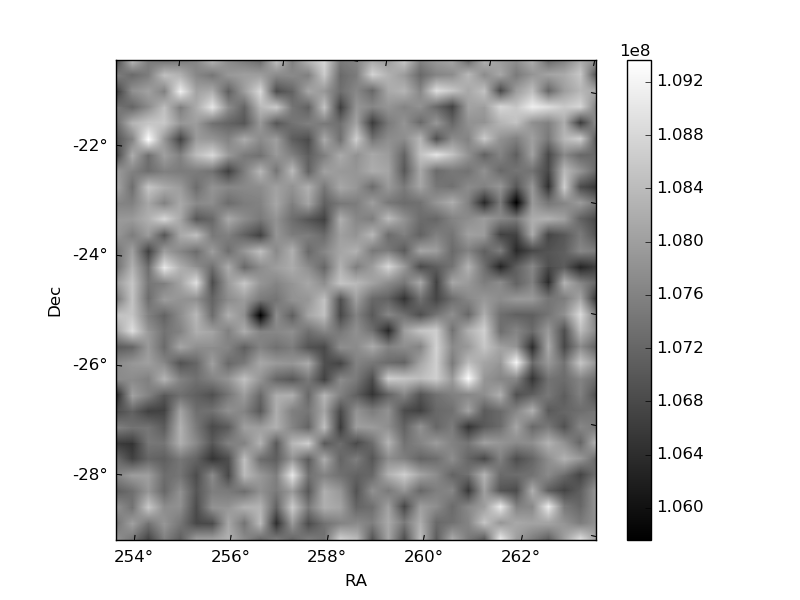
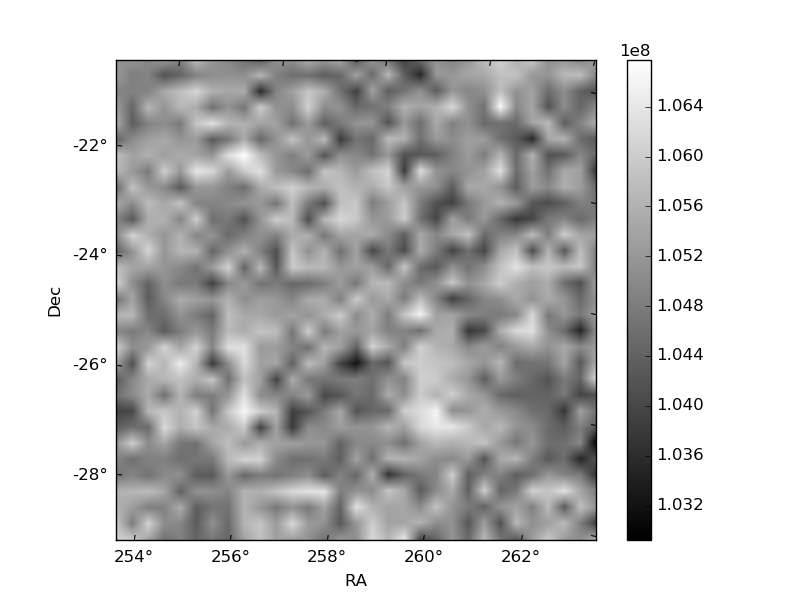
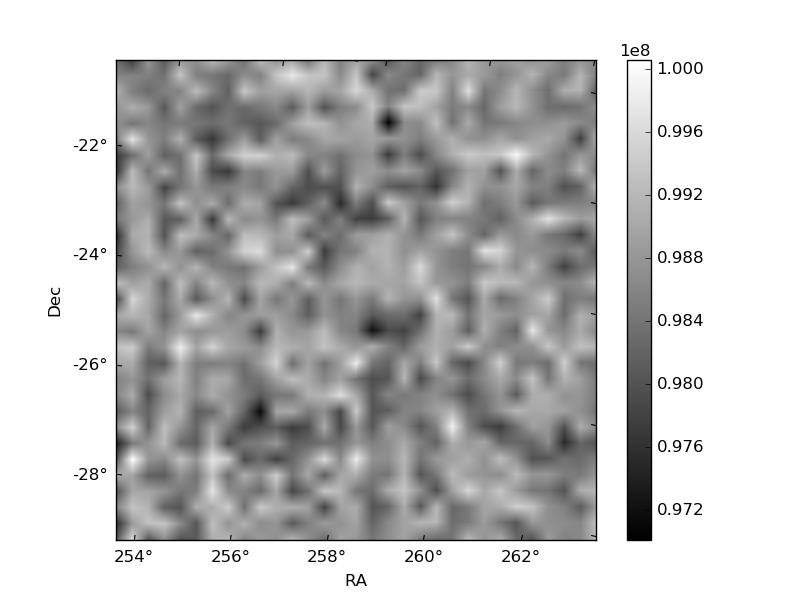
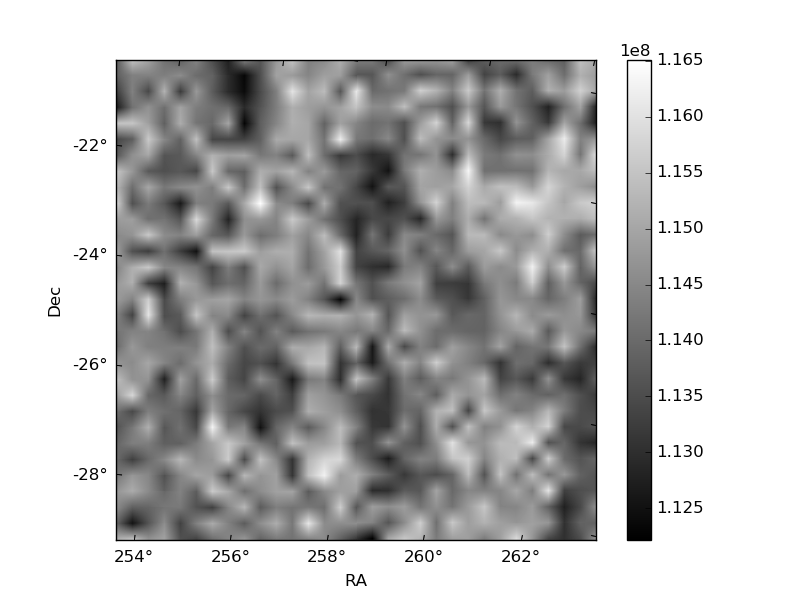
Histogram calculated using DETX and DETY for each event in the final _common_clean file
| Quadrant A | 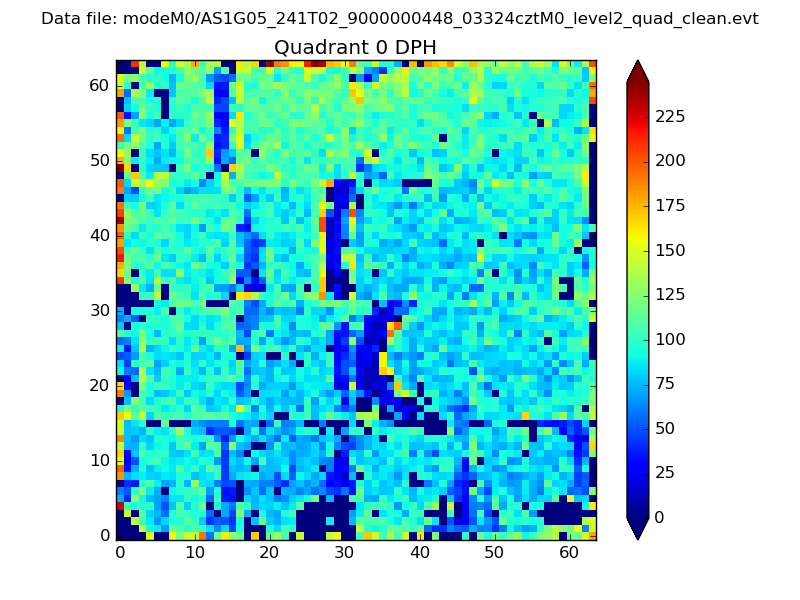 |
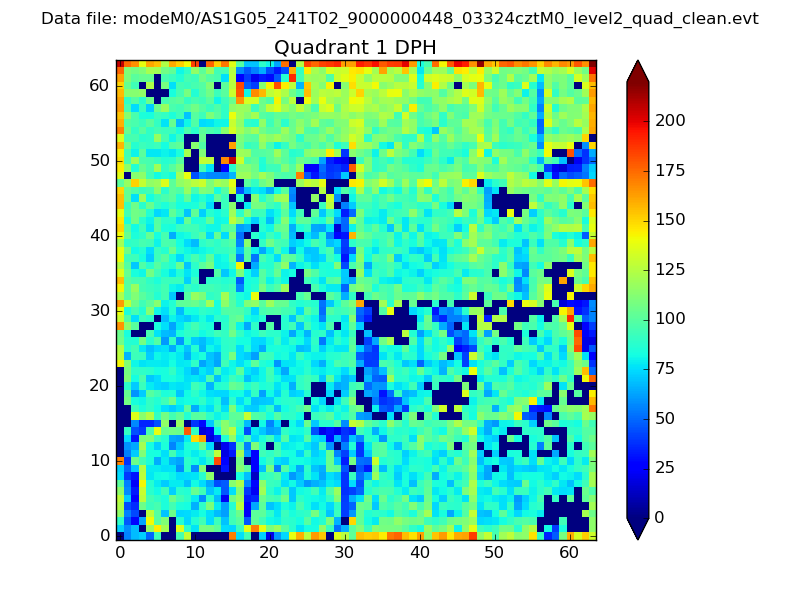 |
Quadrant B |
|---|---|---|---|
| Quadrant D | 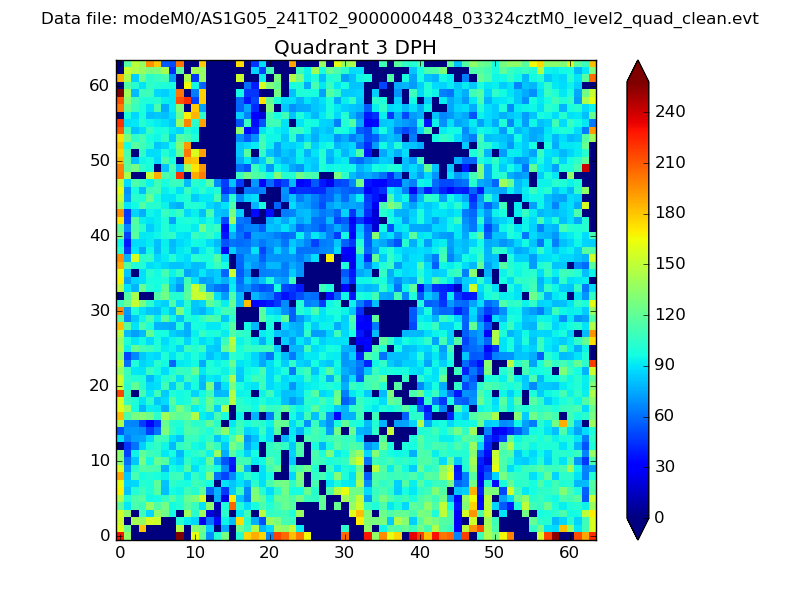 |
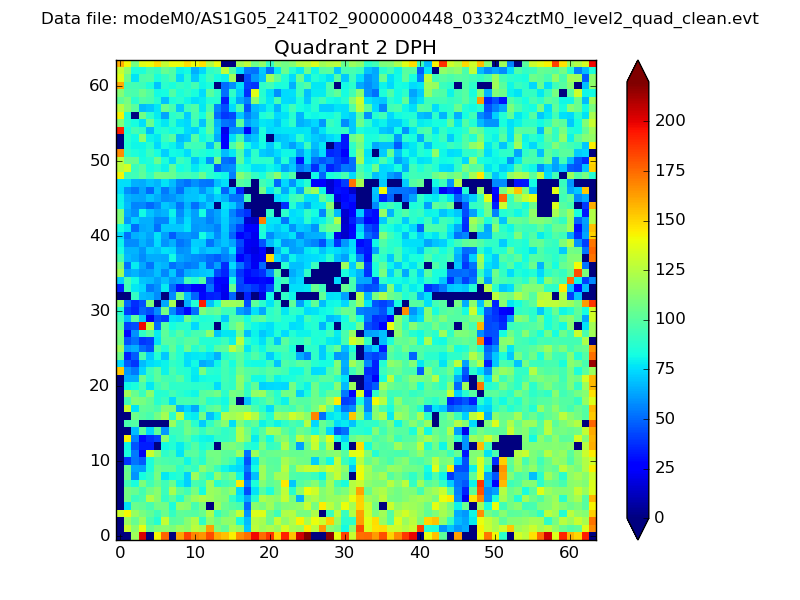 |
Quadrant C |
| Plot type | Count rate plots | Images |
|---|---|---|
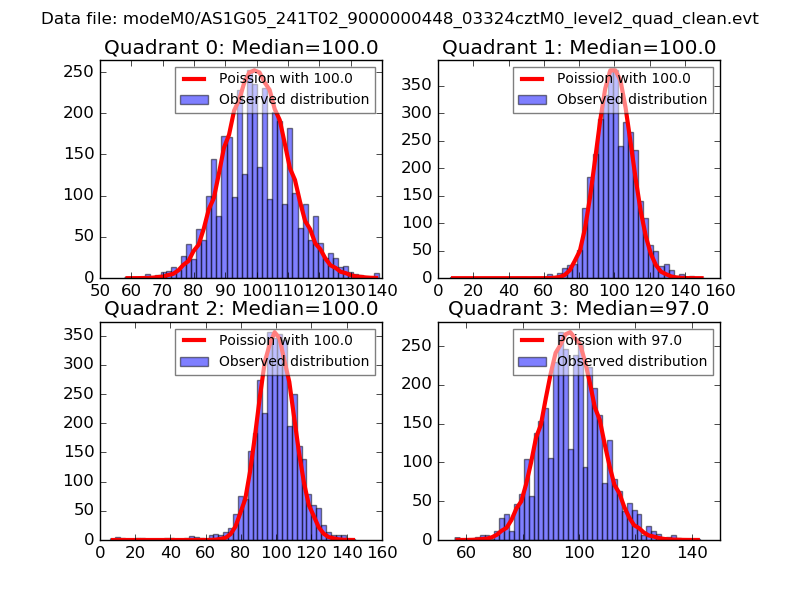
| Comparison with Poisson distribution Blue bars denote a histogram of data divided into 1 sec bins. Red curve is a Poisson curve with rate = median count rate of data. |
 |
 |
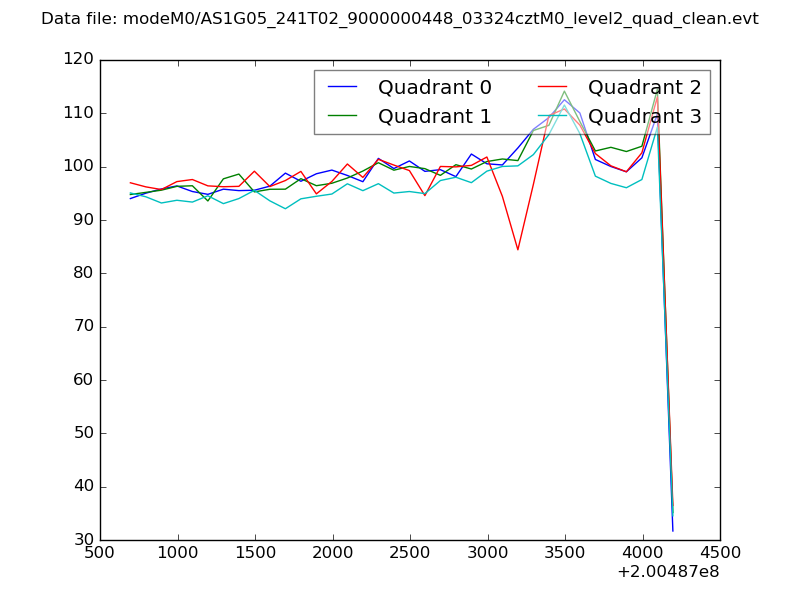
| Quadrant-wise count rates Data is divided into 100 sec bins |
 |
|
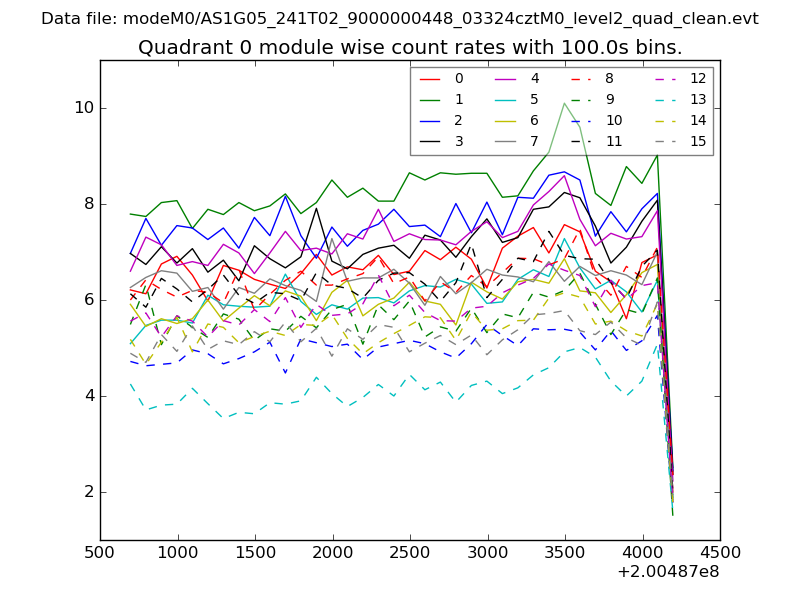
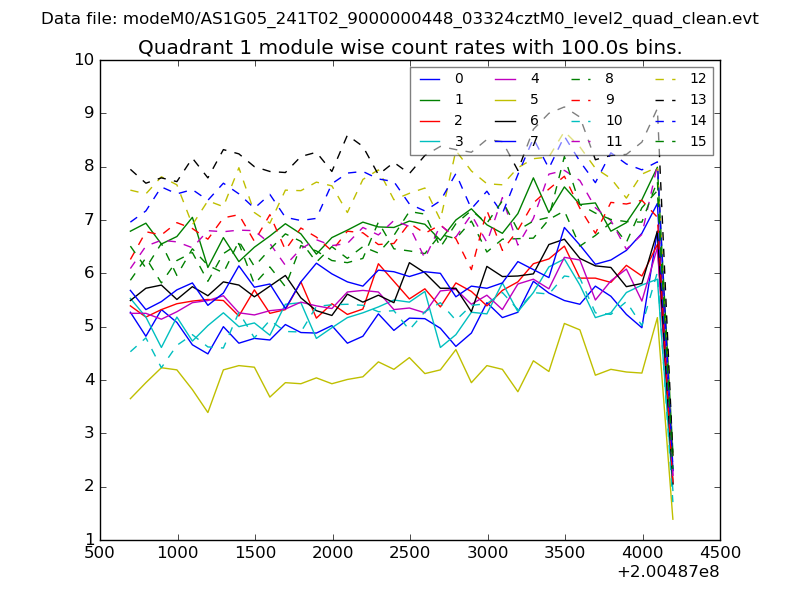
| Module-wise count rates for Quadrant A Data is divided into 100 sec bins |
 |
 |
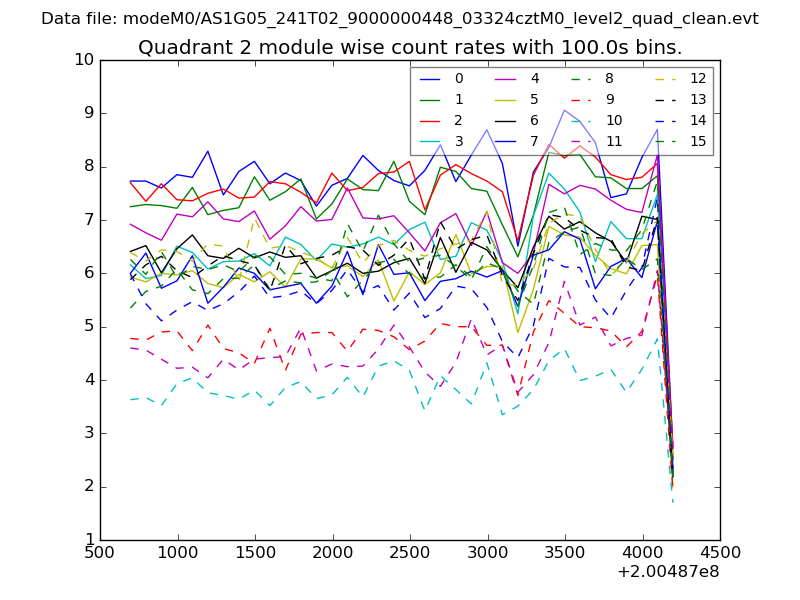
| Module-wise count rates for Quadrant B Data is divided into 100 sec bins |
 |
 |
| Module-wise count rates for Quadrant C Data is divided into 100 sec bins |
 |
 |
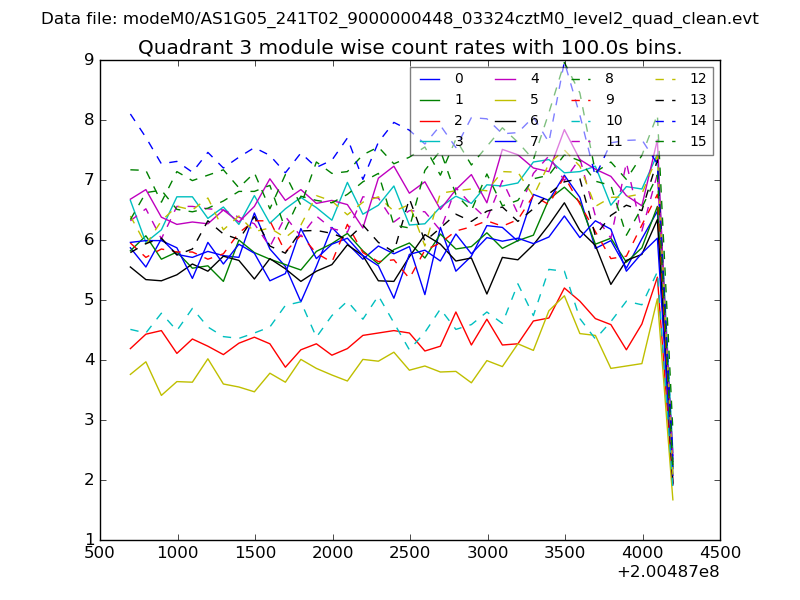
| Module-wise count rates for Quadrant D Data is divided into 100 sec bins |
 |
 |
| Parameter | Plot |
|---|---|
| CZT HV Monitor | 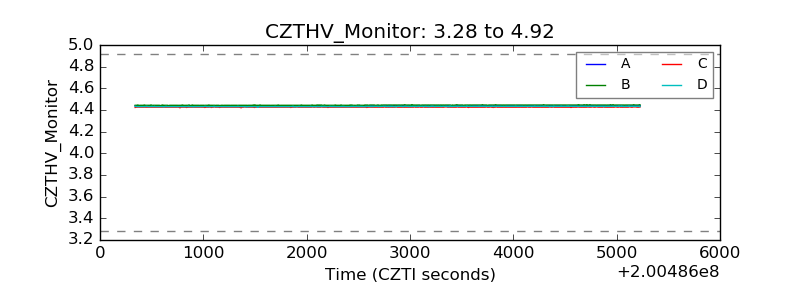 |
| D_VDD | 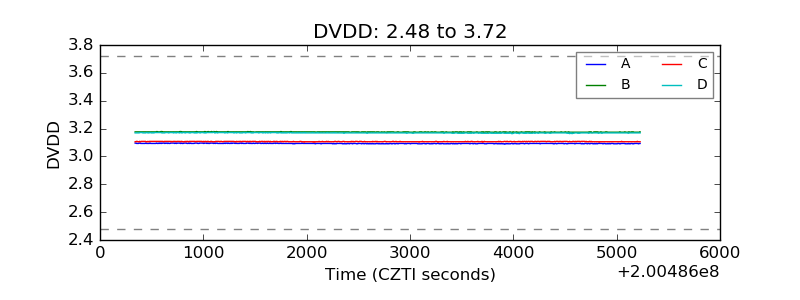 |
| Temperature 1 | 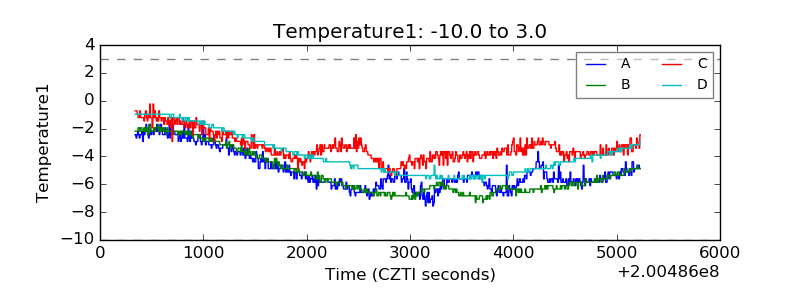 |
| Veto HV Monitor | 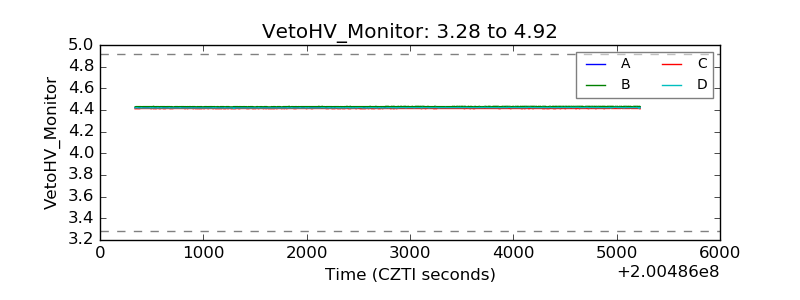 |
| Veto LLD | 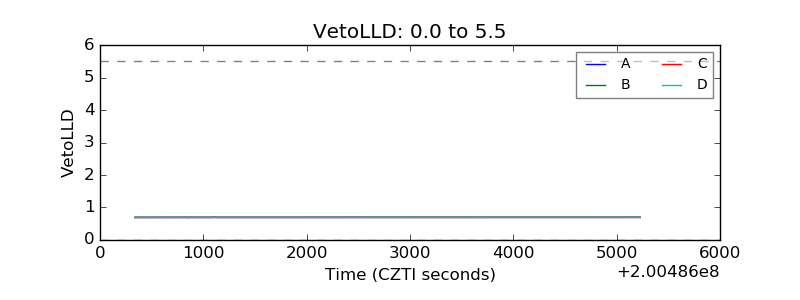 |
| Alpha Counter | 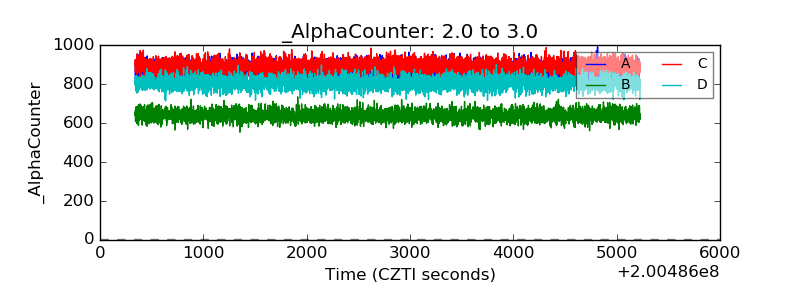 |
| _CPM_Rate | 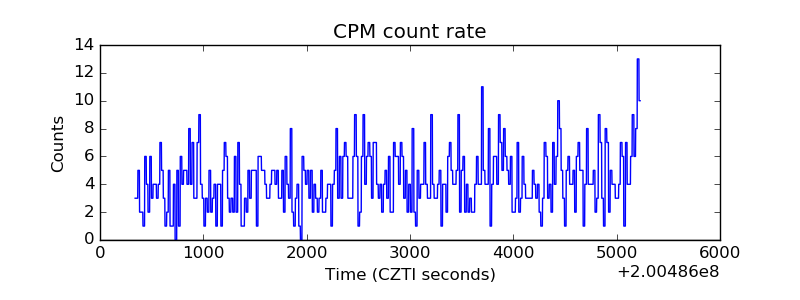 |
| CZT Counter | 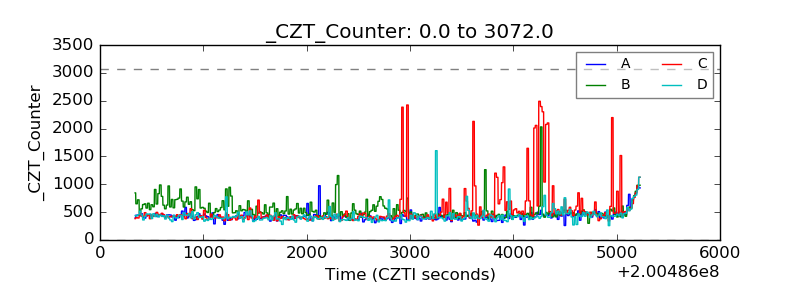 |
| +2.5 Volts monitor | 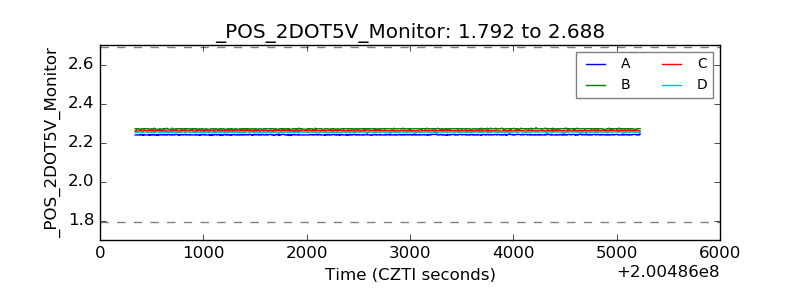 |
| +5 Volts monitor | 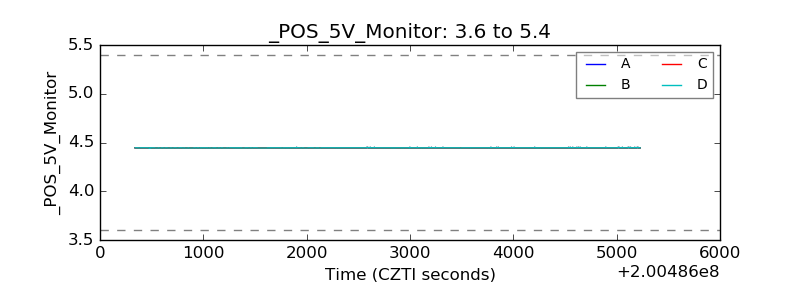 |
| Veto Counter | 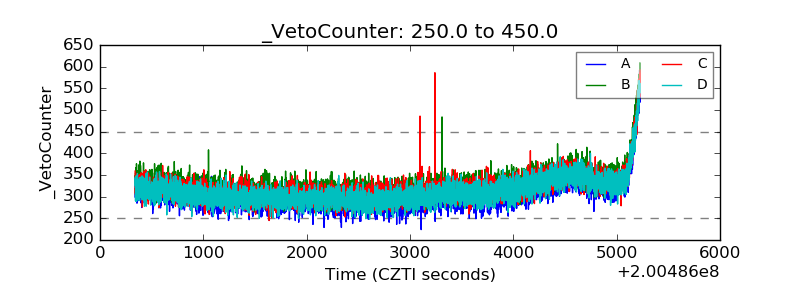 |