| Param | Original file | Final file |
|---|---|---|
| Filename | modeM0/AS1G05_246T01_9000000450cztM0_level2.fits | modeM0/AS1G05_246T01_9000000450cztM0_level2_quad_clean.evt |
| Size (bytes) | 1,330,632,000 | 1,415,681,280 |
| Size | 1.2 GB | 1.3 GB |
| Events in quadrant A | 7,938,546 | 8,480,165 |
| Events in quadrant B | 7,680,184 | 8,605,515 |
| Events in quadrant C | 7,765,618 | 8,109,996 |
| Events in quadrant D | 6,758,934 | 7,530,402 |
| Mode M0 | |||
|---|---|---|---|
| Quadrant | BADHDUFLAG | Total packets | Discarded packets |
| A | 0 | 306215 | 0 |
| B | 0 | 347758 | 0 |
| C | 0 | 355190 | 0 |
| D | 0 | 328310 | 0 |
| Mode SS | |||
|---|---|---|---|
| Quadrant | BADHDUFLAG | Total packets | Discarded packets |
| A | 0 | 3009 | 0 |
| B | 0 | 3020 | 0 |
| C | 0 | 3016 | 0 |
| D | 0 | 3008 | 0 |
| Mode M9 | |||
|---|---|---|---|
| Quadrant | BADHDUFLAG | Total packets | Discarded packets |
| A | 0 | 206 | 0 |
| B | 0 | 209 | 0 |
| C | 0 | 209 | 0 |
| D | 0 | 208 | 0 |
| Quadrant | Total seconds | Saturated seconds | Saturation percentage |
|---|---|---|---|
| A | 148187 | 2341 | 1.579761% |
| B | 148119 | 3137 | 2.117892% |
| C | 148145 | 3856 | 2.602855% |
| D | 148156 | 3023 | 2.040417% |
Noise dominated data is calculated using 1-second bins in cleaned event files. If a bin has >2000 counts, and if more than 50% of those come from <1% of pixels, then it is considered to be noise-dominated and hence unusable.
| Quadrant | # 1 sec bins | Bins with >0 counts | Bins with >2000 counts | High rate bins dominated by noise | Noise dominated (total time) | Noise dominated (detector-on time) | Marked lightcurve |
|---|---|---|---|---|---|---|---|
| A | 173521 | 148420 | 0 | 0 | 0.00% | 0.00% |  |
| B | 173521 | 148358 | 0 | 0 | 0.00% | 0.00% |  |
| C | 173521 | 148371 | 0 | 0 | 0.00% | 0.00% |  |
| D | 173521 | 148362 | 0 | 0 | 0.00% | 0.00% |  |
Top three noisy pixels from each quadrant. If the there are fewer than three noisy pixels in the level2.evt file, extra rows are filled as -1
| Pixel properties | Quadrant properties | ||||||
|---|---|---|---|---|---|---|---|
| Quadrant | DetID | PixID | Counts | Sigma | Mean | Median | Sigma |
| A | 14 | 188 | 7677 | 10.7 | 2057 | 1902 | 539.8 |
| A | 0 | 29 | 7602 | 10.56 | 2057 | 1902 | 539.8 |
| A | 14 | 204 | 6722 | 8.93 | 2057 | 1902 | 539.8 |
| B | 2 | 9 | 6791 | 11.79 | 2023 | 1910 | 414.1 |
| B | 12 | 226 | 5585 | 8.87 | 2023 | 1910 | 414.1 |
| B | 14 | 254 | 5292 | 8.17 | 2023 | 1910 | 414.1 |
| C | 1 | 80 | 5508 | 6.71 | 2050 | 1888 | 539.1 |
| C | 1 | 81 | 5462 | 6.63 | 2050 | 1888 | 539.1 |
| C | 12 | 241 | 5367 | 6.45 | 2050 | 1888 | 539.1 |
| D | 7 | 5 | 4904 | 6.01 | 1934 | 1744 | 525.8 |
| D | 6 | 231 | 4858 | 5.92 | 1934 | 1744 | 525.8 |
| D | 7 | 3 | 4729 | 5.68 | 1934 | 1744 | 525.8 |
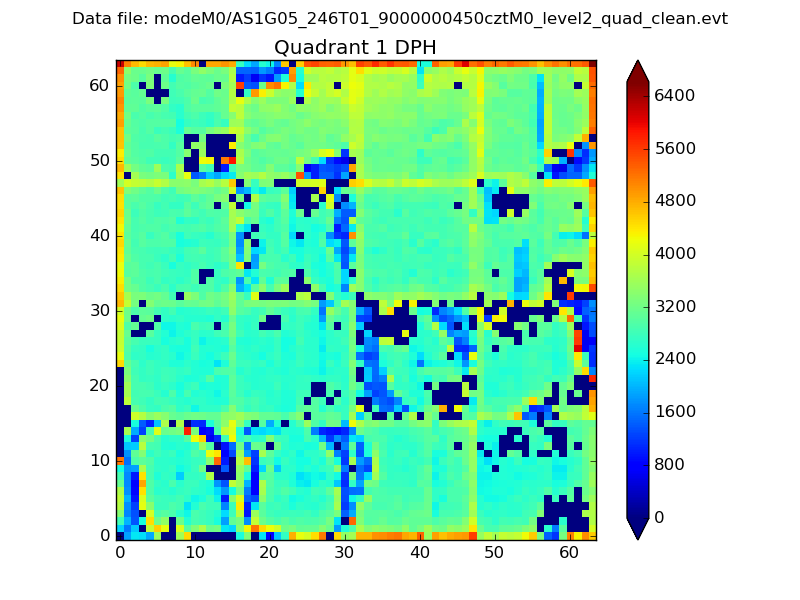
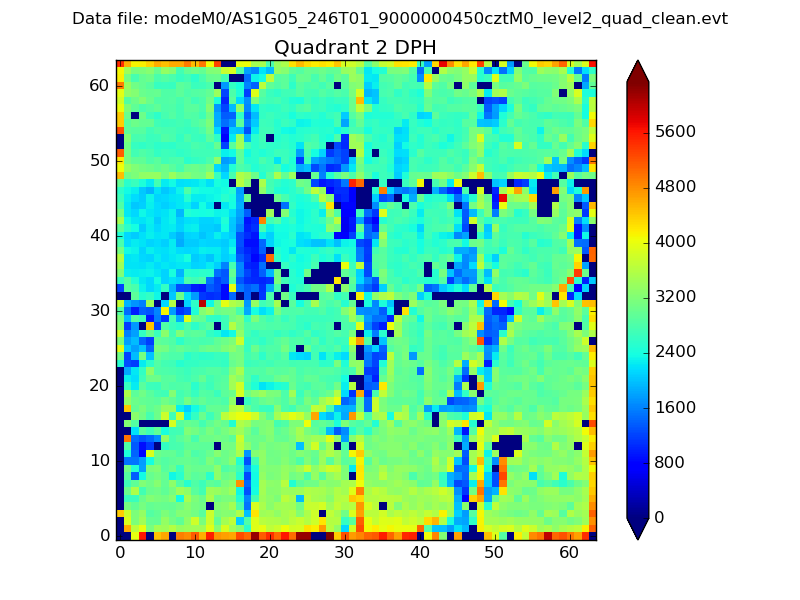
Histogram calculated using DETX and DETY for each event in the final _common_clean file
| Quadrant A |  |
 |
Quadrant B |
|---|---|---|---|
| Quadrant D | 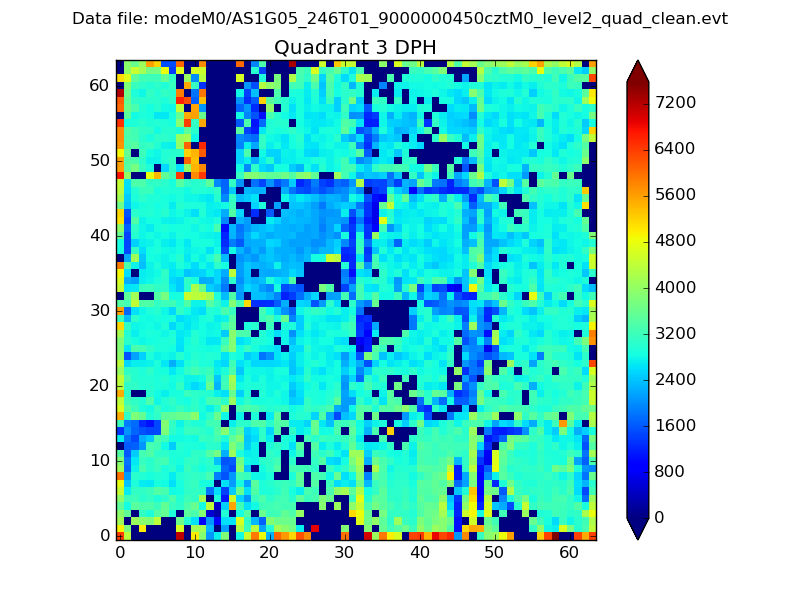 |
 |
Quadrant C |
| Plot type | Count rate plots | Images |
|---|---|---|
| Comparison with Poisson distribution Blue bars denote a histogram of data divided into 1 sec bins. Red curve is a Poisson curve with rate = median count rate of data. |
 |
 |
| Quadrant-wise count rates Data is divided into 100 sec bins |
 |
|
| Module-wise count rates for Quadrant A Data is divided into 100 sec bins |
 |
 |
| Module-wise count rates for Quadrant B Data is divided into 100 sec bins |
 |
 |
| Module-wise count rates for Quadrant C Data is divided into 100 sec bins |
 |
 |
| Module-wise count rates for Quadrant D Data is divided into 100 sec bins |
 |
 |
| Parameter | Plot |
|---|---|
| CZT HV Monitor |  |
| D_VDD | 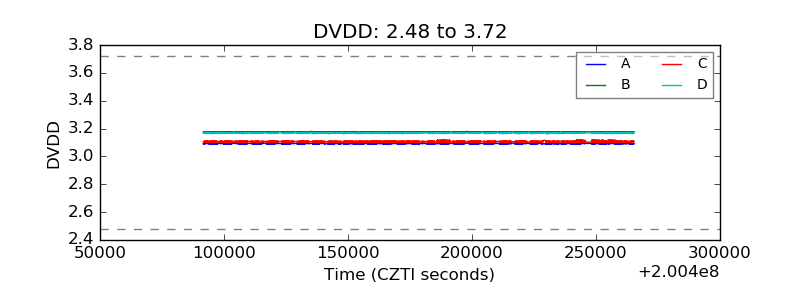 |
| Temperature 1 |  |
| Veto HV Monitor |  |
| Veto LLD | 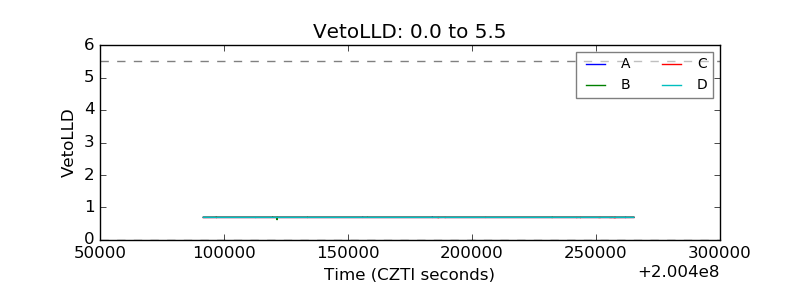 |
| Alpha Counter |  |
| _CPM_Rate | 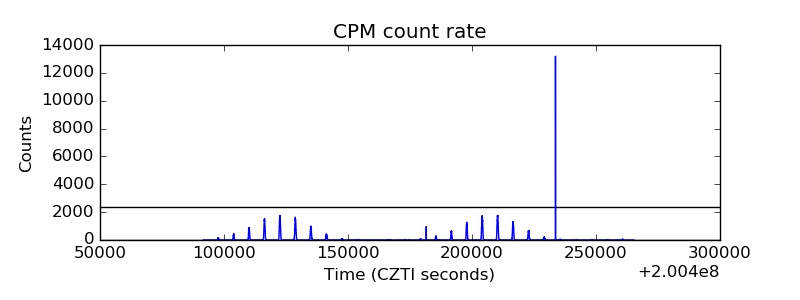 |
| CZT Counter |  |
| +2.5 Volts monitor | 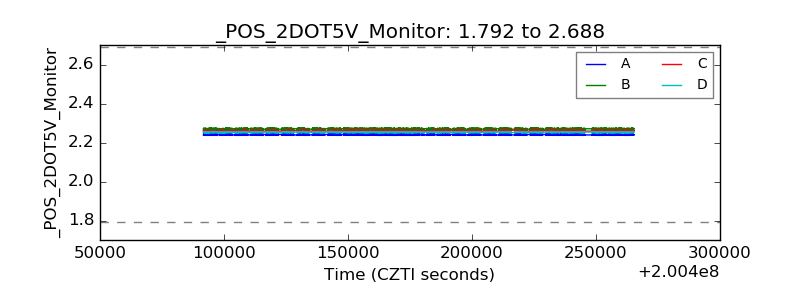 |
| +5 Volts monitor | 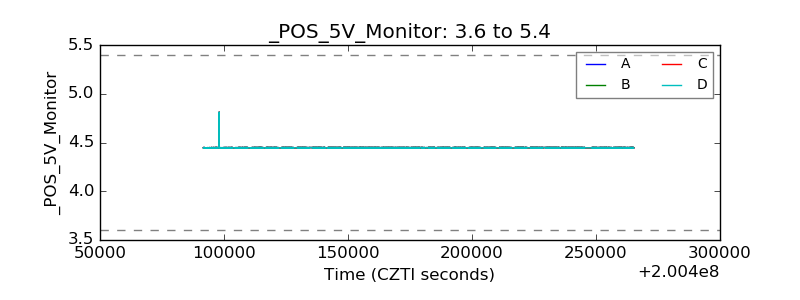 |
| _ROLL_ROT | 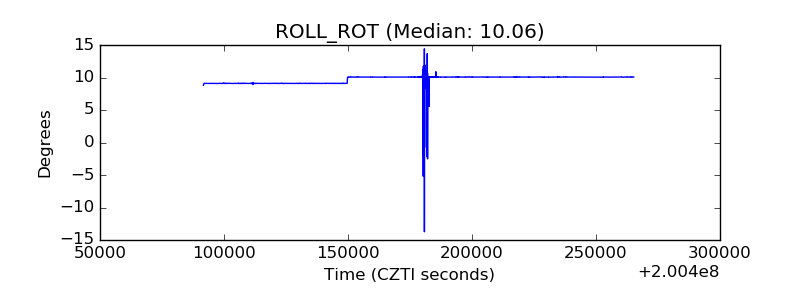 |
| _Roll_DEC | 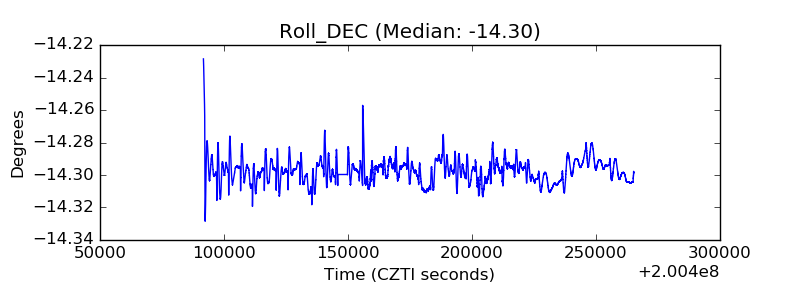 |
| _Roll_RA |  |
| Veto Counter | 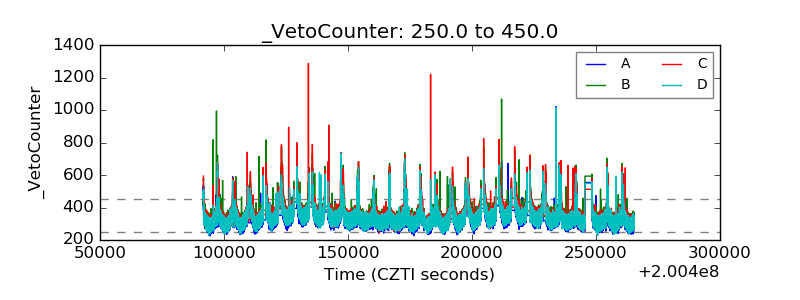 |