| Param | Original file | Final file |
|---|---|---|
| Filename | modeM0/AS1G05_246T01_9000000450_03324cztM0_level2.evt | modeM0/AS1G05_246T01_9000000450_03324cztM0_level2_quad_clean.evt |
| Size (bytes) | 1,205,429,760 | 195,321,600 |
| Size | 1.1 GB | 186.3 MB |
| Events in quadrant A | 8,072,790 | 1,177,744 |
| Events in quadrant B | 10,570,855 | 1,183,848 |
| Events in quadrant C | 8,146,067 | 1,181,765 |
| Events in quadrant D | 8,502,313 | 1,134,573 |
| Mode M0 | |||
|---|---|---|---|
| Quadrant | BADHDUFLAG | Total packets | Discarded packets |
| A | 0 | 36852 | 5 |
| B | 0 | 43438 | 4 |
| C | 0 | 36973 | 6 |
| D | 0 | 38722 | 4 |
| Mode SS | |||
|---|---|---|---|
| Quadrant | BADHDUFLAG | Total packets | Discarded packets |
| A | 0 | 362 | 0 |
| B | 0 | 362 | 0 |
| C | 0 | 362 | 0 |
| D | 0 | 362 | 0 |
| Mode M9 | |||
|---|---|---|---|
| Quadrant | BADHDUFLAG | Total packets | Discarded packets |
| A | 0 | 27 | 0 |
| B | 0 | 27 | 0 |
| C | 0 | 27 | 0 |
| D | 0 | 27 | 0 |
| Quadrant | Total seconds | Saturated seconds | Saturation percentage |
|---|---|---|---|
| A | 17966 | 133 | 0.740287% |
| B | 17966 | 269 | 1.497273% |
| C | 17965 | 119 | 0.662399% |
| D | 17966 | 221 | 1.230101% |
Noise dominated data is calculated using 1-second bins in cleaned event files. If a bin has >2000 counts, and if more than 50% of those come from <1% of pixels, then it is considered to be noise-dominated and hence unusable.
| Quadrant | # 1 sec bins | Bins with >0 counts | Bins with >2000 counts | High rate bins dominated by noise | Noise dominated (total time) | Noise dominated (detector-on time) | Marked lightcurve |
|---|---|---|---|---|---|---|---|
| A | 20446 | 17969 | 3 | 3 | 0.01% | 0.02% | 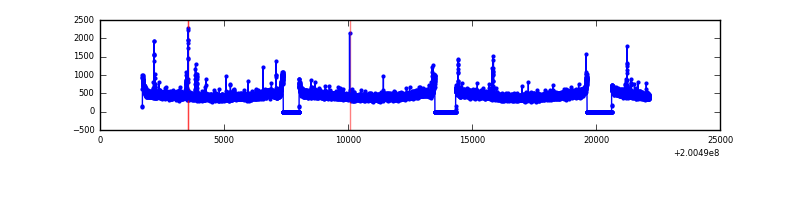 |
| B | 20446 | 17969 | 69 | 69 | 0.34% | 0.38% | 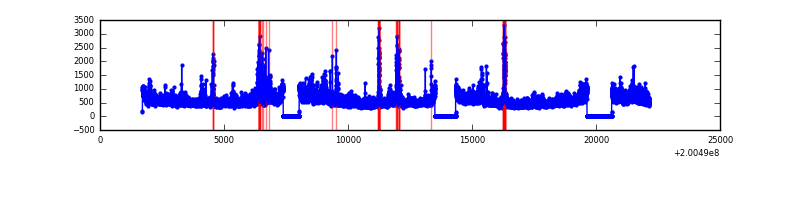 |
| C | 20446 | 17969 | 20 | 20 | 0.10% | 0.11% | 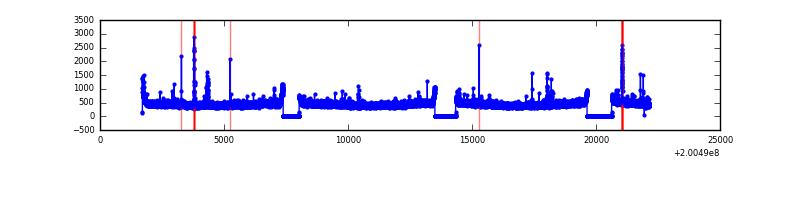 |
| D | 20446 | 17969 | 123 | 123 | 0.60% | 0.68% | 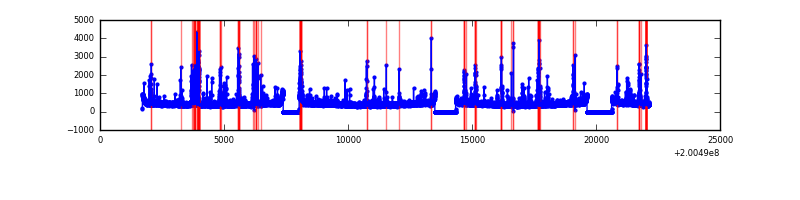 |
Top three noisy pixels from each quadrant. If the there are fewer than three noisy pixels in the level2.evt file, extra rows are filled as -1
| Pixel properties | Quadrant properties | ||||||
|---|---|---|---|---|---|---|---|
| Quadrant | DetID | PixID | Counts | Sigma | Mean | Median | Sigma |
| A | 0 | 118 | 96152 | 221.36 | 2061 | 2011 | 425.3 |
| A | 0 | 226 | 30341 | 66.61 | 2061 | 2011 | 425.3 |
| A | 12 | 194 | 21736 | 46.38 | 2061 | 2011 | 425.3 |
| B | 15 | 204 | 1703476 | 4155.83 | 2092 | 2041 | 409.4 |
| B | 5 | 70 | 401070 | 974.65 | 2092 | 2041 | 409.4 |
| B | 0 | 229 | 127089 | 305.44 | 2092 | 2041 | 409.4 |
| C | 9 | 54 | 89956 | 185.82 | 2017 | 2027 | 473.2 |
| C | 1 | 192 | 69008 | 141.55 | 2017 | 2027 | 473.2 |
| C | 6 | 80 | 37349 | 74.64 | 2017 | 2027 | 473.2 |
| D | 13 | 223 | 552955 | 1146.37 | 1996 | 1938 | 480.7 |
| D | 13 | 239 | 181329 | 373.22 | 1996 | 1938 | 480.7 |
| D | 14 | 34 | 56728 | 113.99 | 1996 | 1938 | 480.7 |
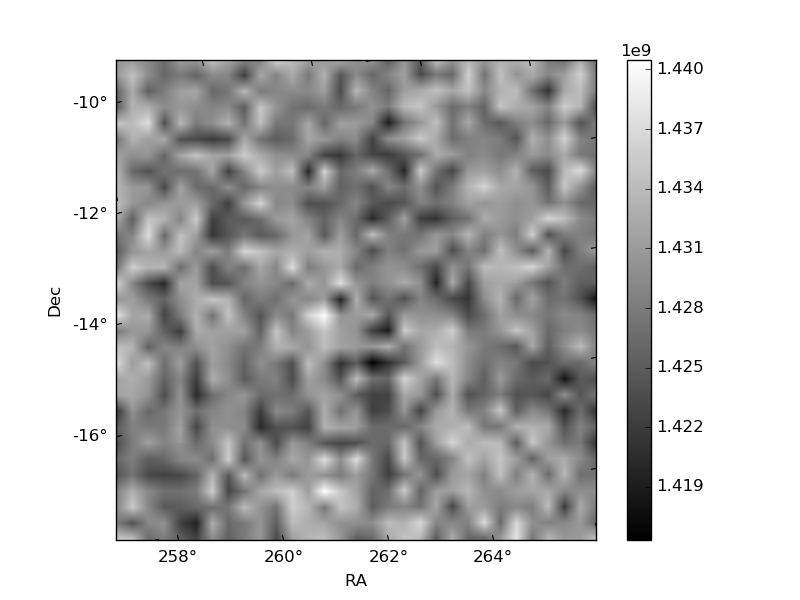
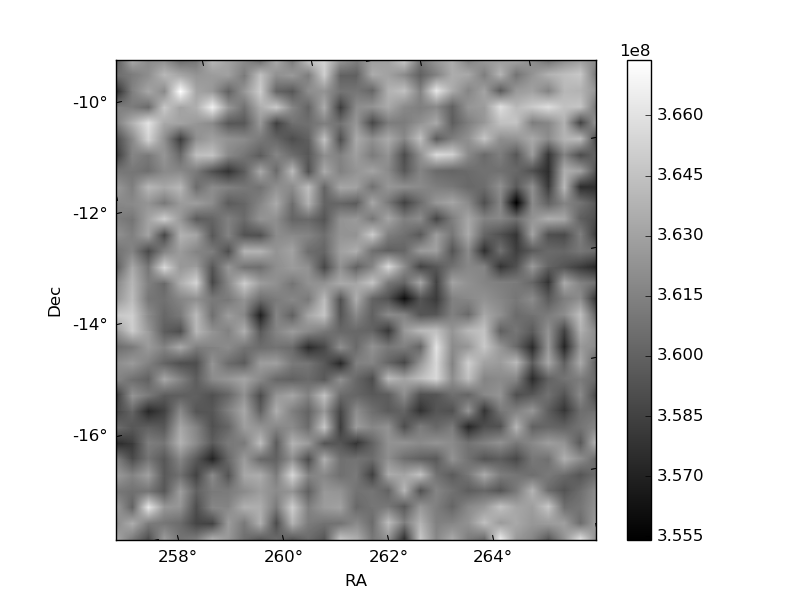
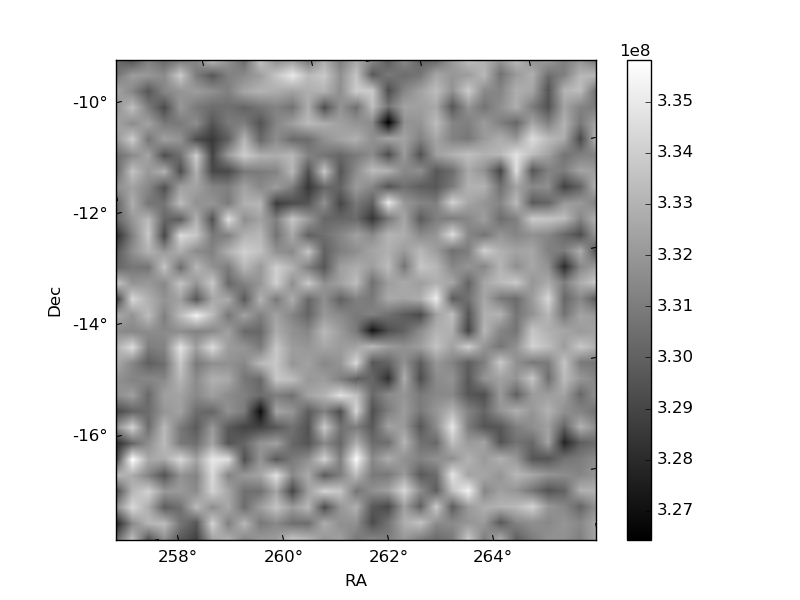
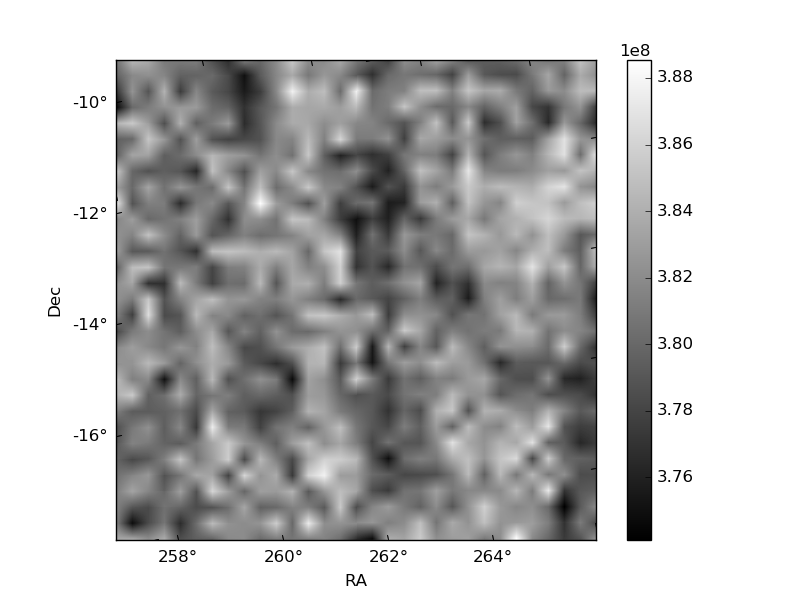
Histogram calculated using DETX and DETY for each event in the final _common_clean file
| Quadrant A | 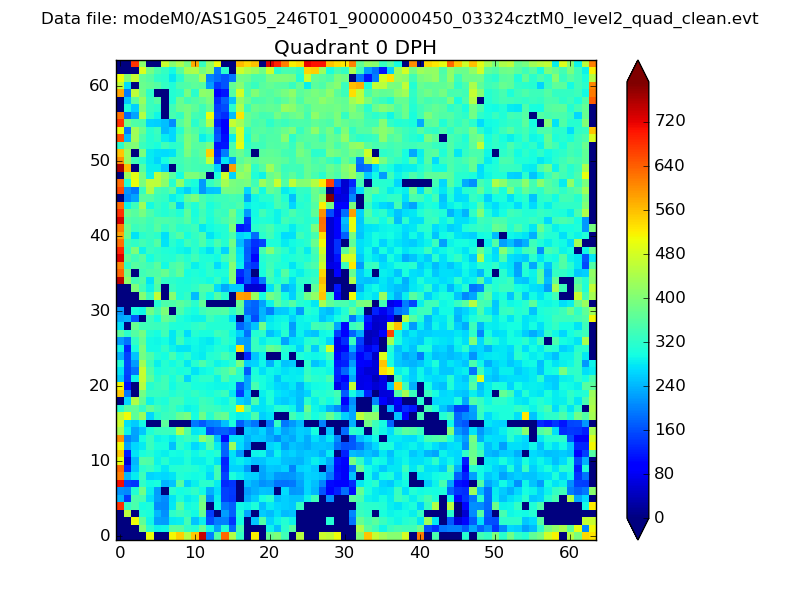 |
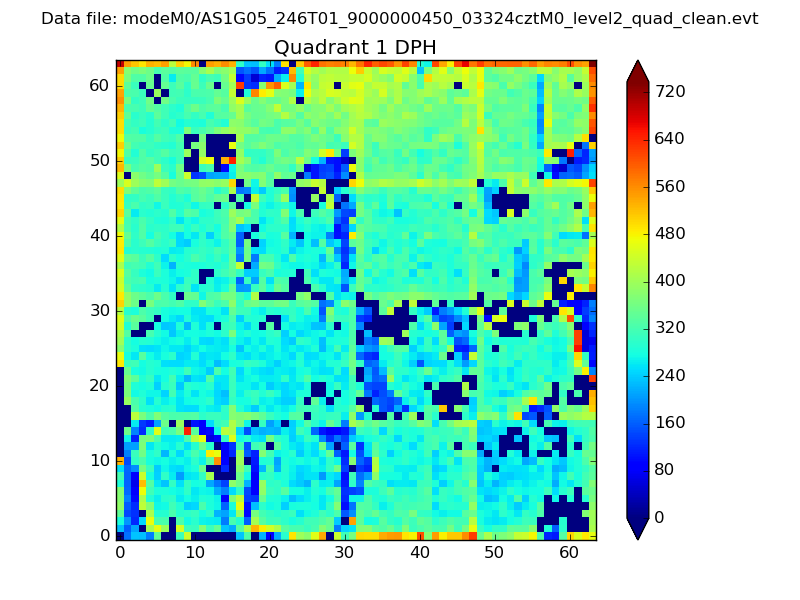 |
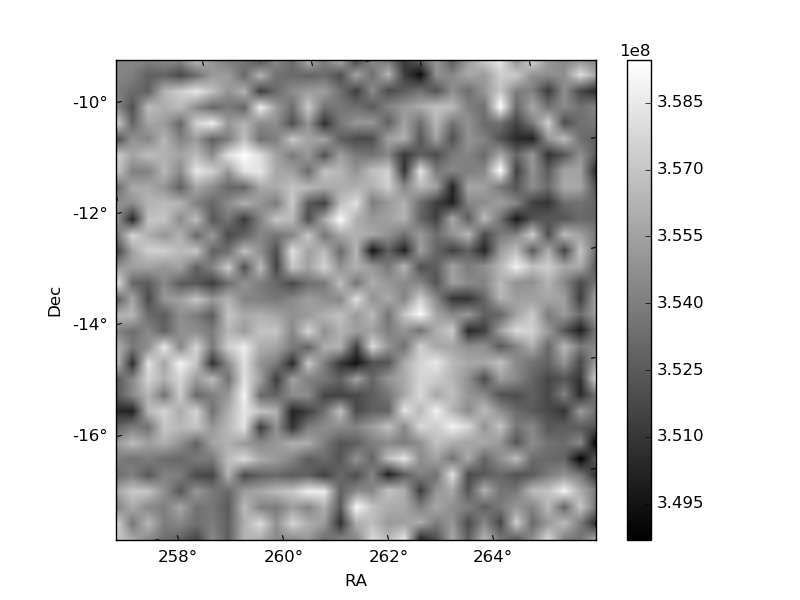
Quadrant B |
|---|---|---|---|
| Quadrant D | 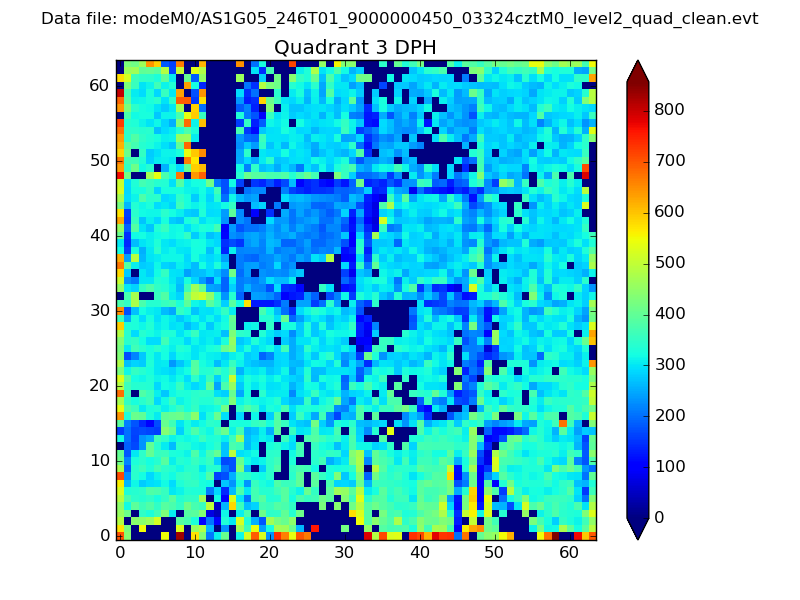 |
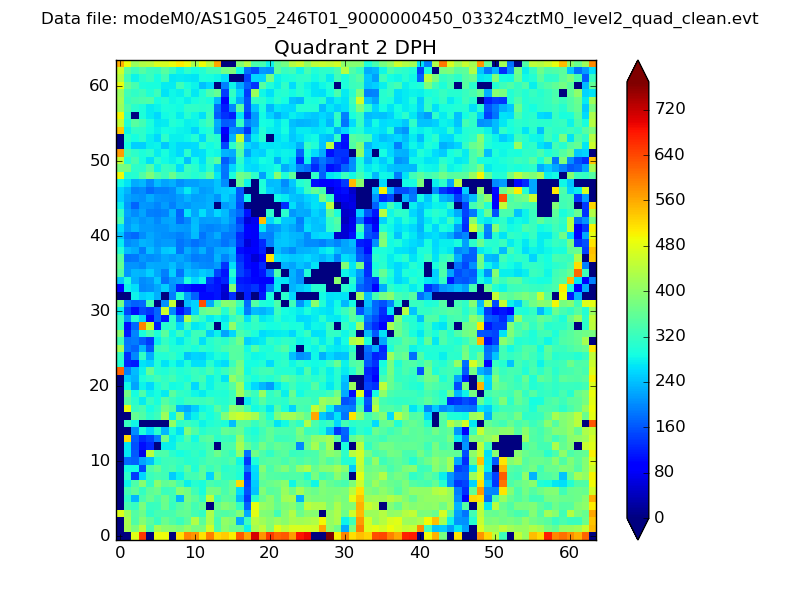 |
Quadrant C |
| Plot type | Count rate plots | Images |
|---|---|---|
| Comparison with Poisson distribution Blue bars denote a histogram of data divided into 1 sec bins. Red curve is a Poisson curve with rate = median count rate of data. |
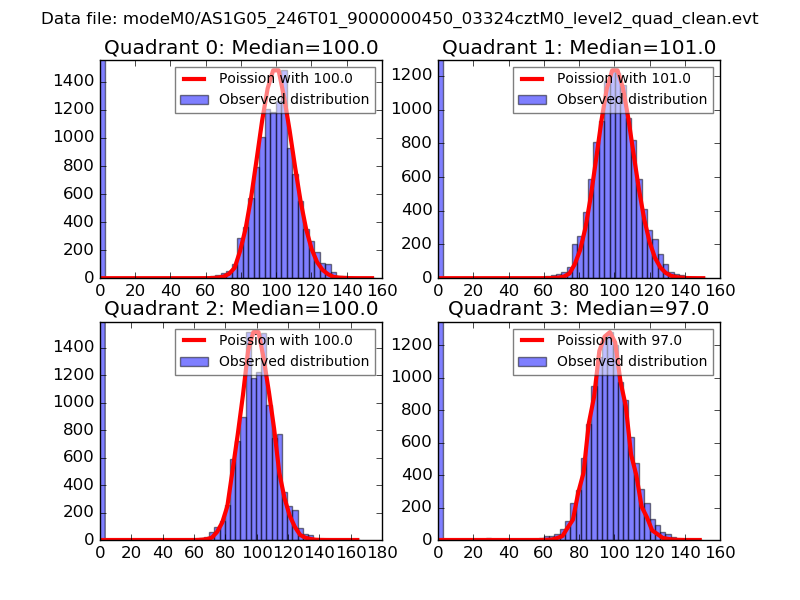 |
 |
| Quadrant-wise count rates Data is divided into 100 sec bins |
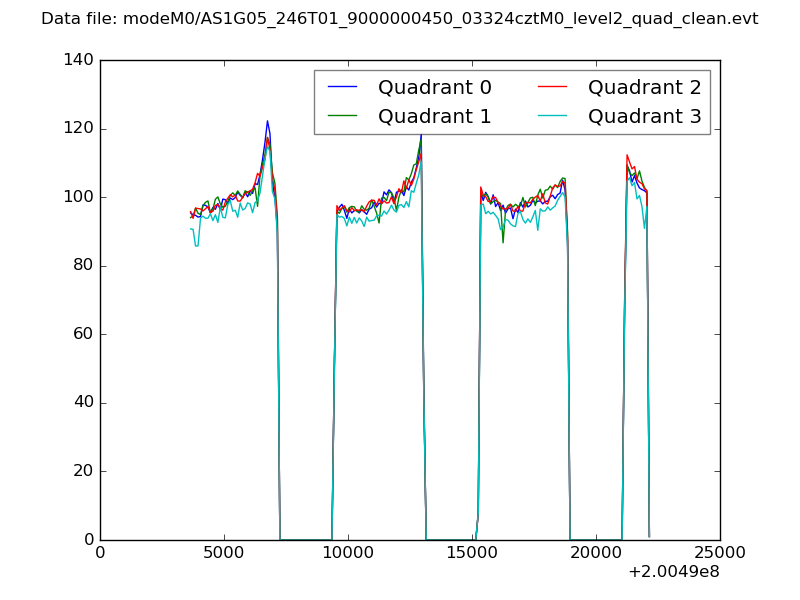 |
|
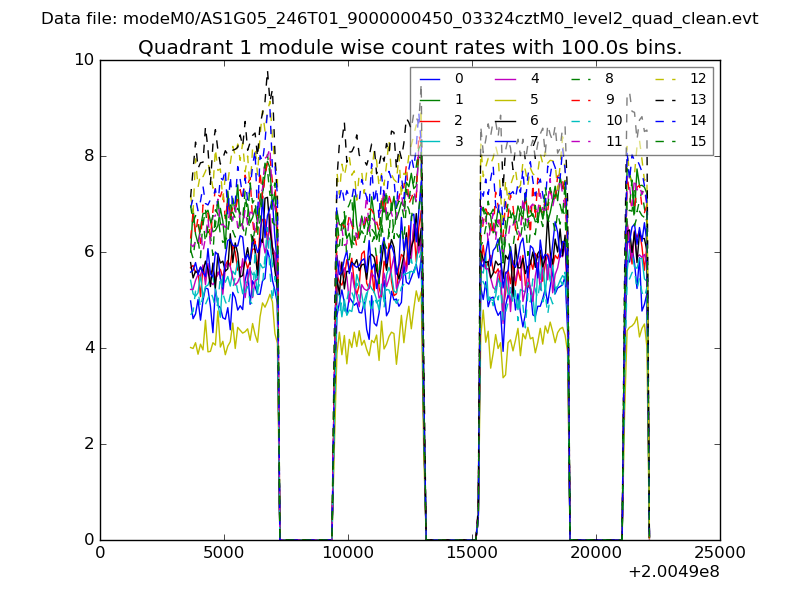
| Module-wise count rates for Quadrant A Data is divided into 100 sec bins |
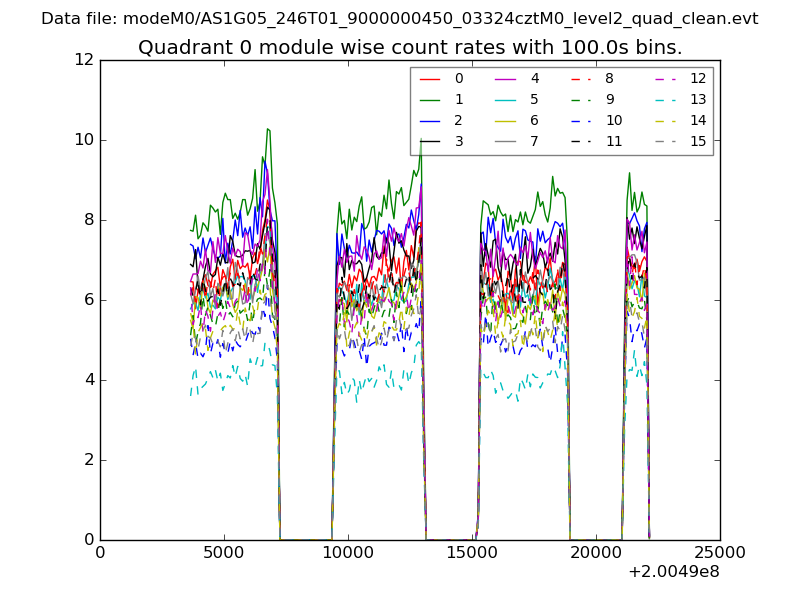 |
 |
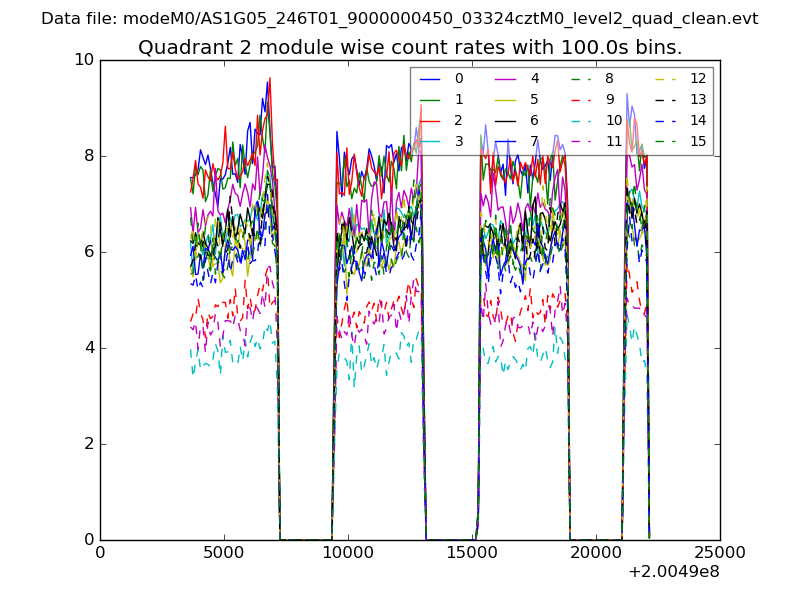
| Module-wise count rates for Quadrant B Data is divided into 100 sec bins |
 |
 |
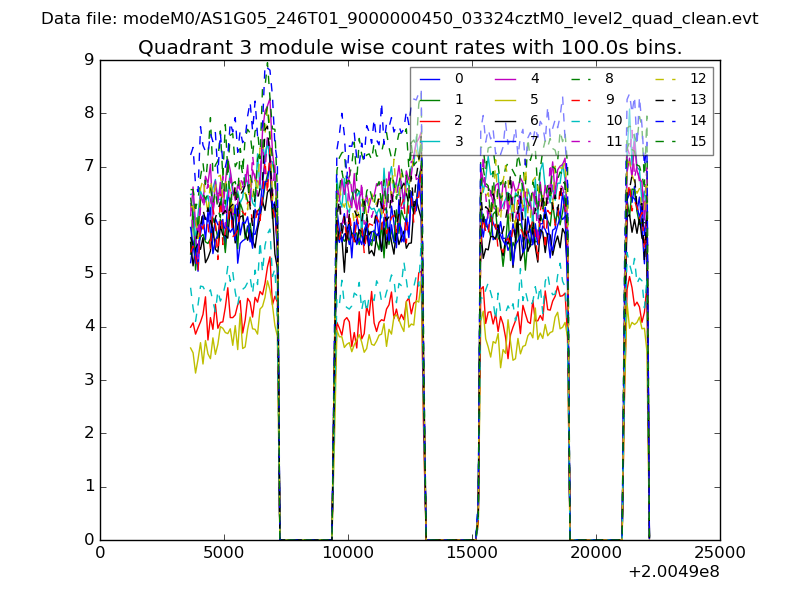
| Module-wise count rates for Quadrant C Data is divided into 100 sec bins |
 |
 |
| Module-wise count rates for Quadrant D Data is divided into 100 sec bins |
 |
 |
| Parameter | Plot |
|---|---|
| CZT HV Monitor | 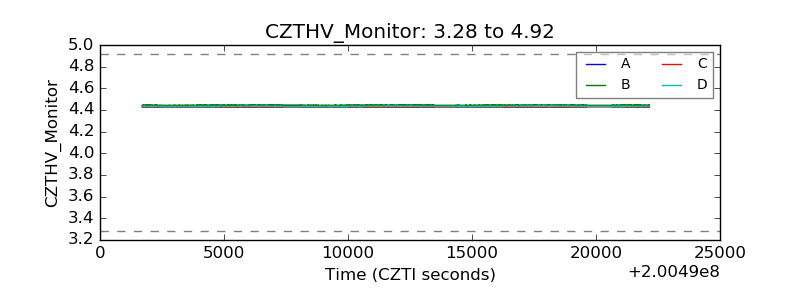 |
| D_VDD | 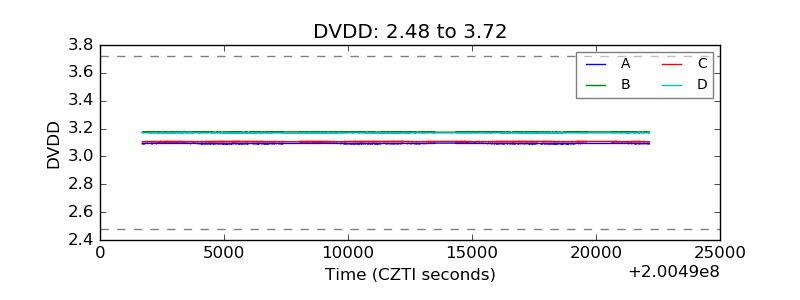 |
| Temperature 1 | 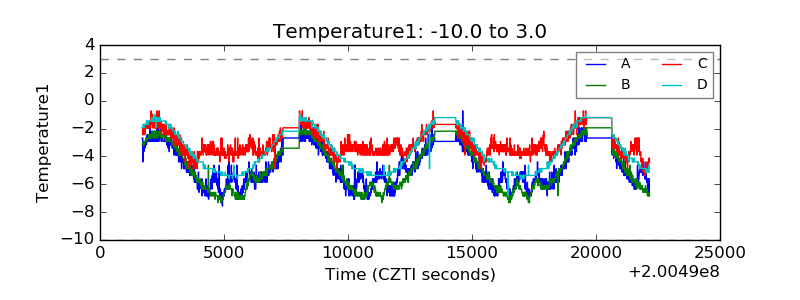 |
| Veto HV Monitor | 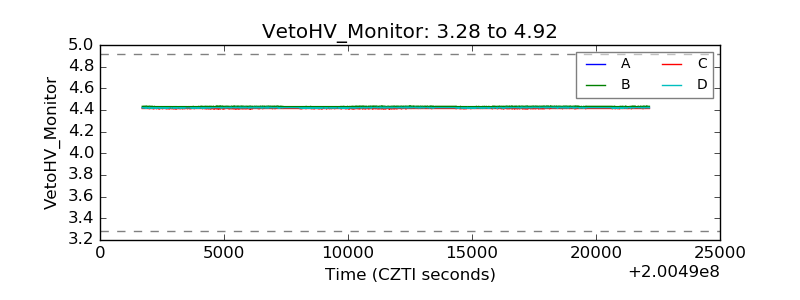 |
| Veto LLD | 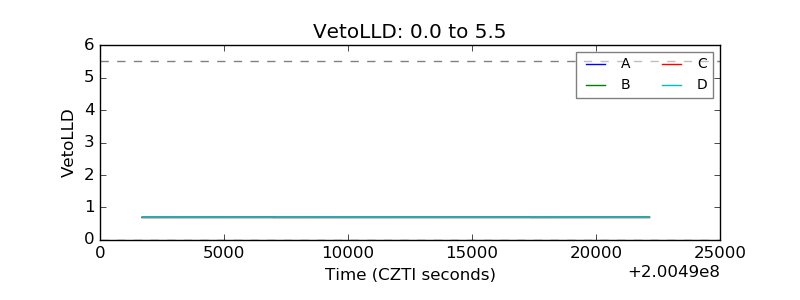 |
| Alpha Counter | 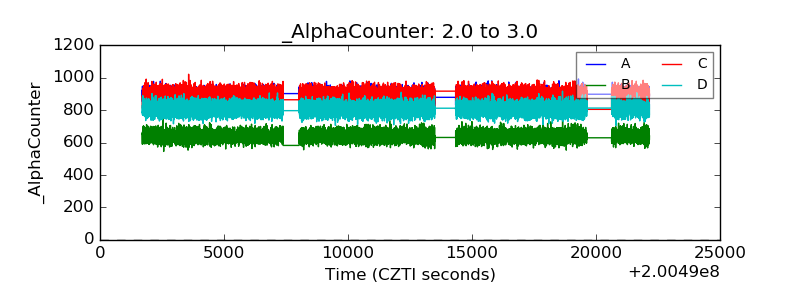 |
| _CPM_Rate | 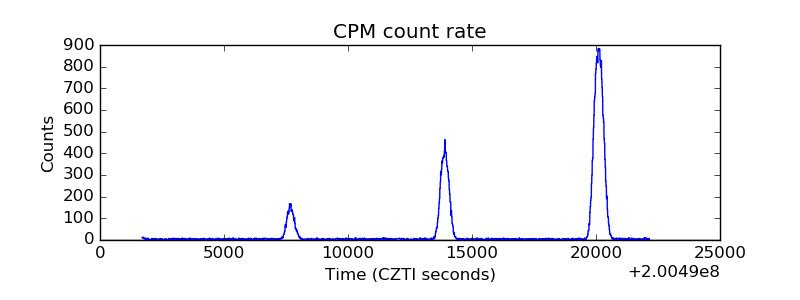 |
| CZT Counter | 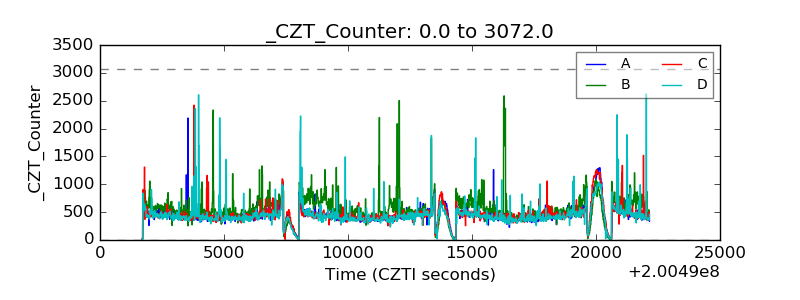 |
| +2.5 Volts monitor | 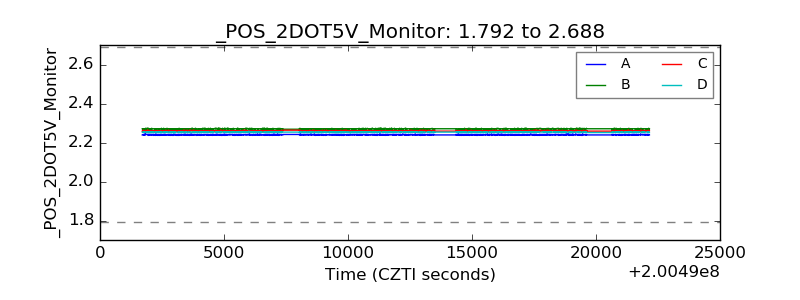 |
| +5 Volts monitor | 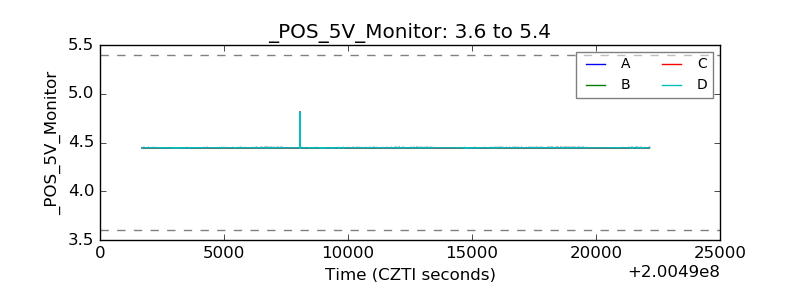 |
| _ROLL_ROT | 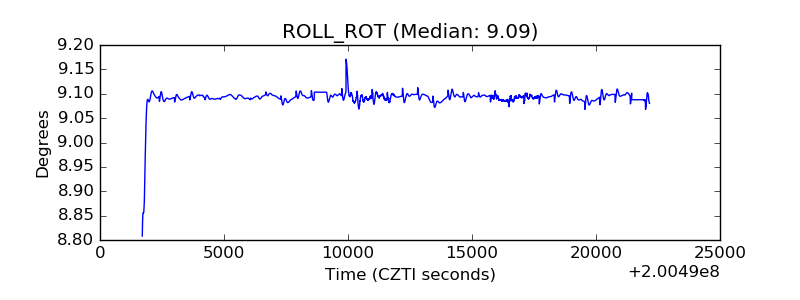 |
| _Roll_DEC | 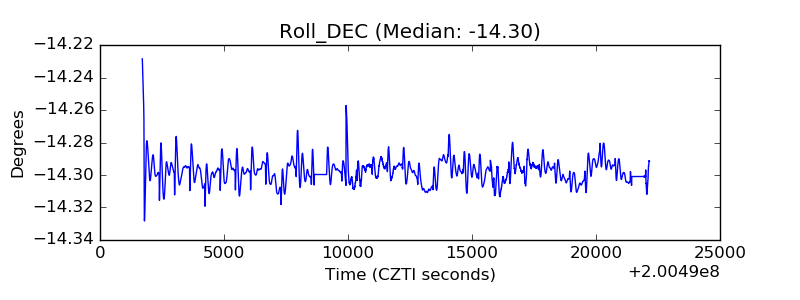 |
| _Roll_RA | 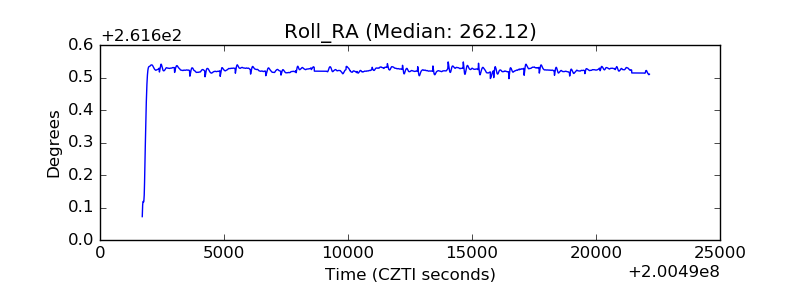 |
| Veto Counter | 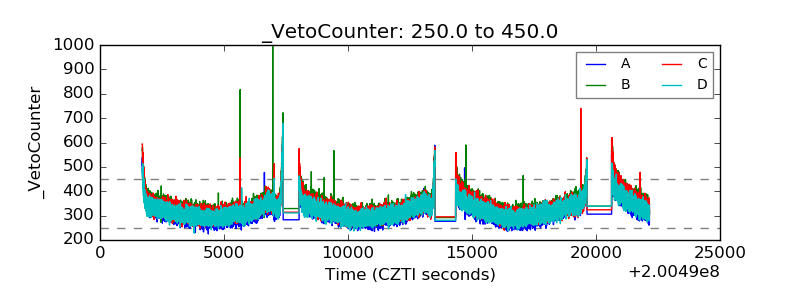 |