| Param | Original file | Final file |
|---|---|---|
| Filename | modeM0/AS1G05_246T01_9000000450_03326cztM0_level2.evt | modeM0/AS1G05_246T01_9000000450_03326cztM0_level2_quad_clean.evt |
| Size (bytes) | 501,900,480 | 82,491,840 |
| Size | 478.6 MB | 78.7 MB |
| Events in quadrant A | 3,349,977 | 499,636 |
| Events in quadrant B | 4,302,963 | 507,424 |
| Events in quadrant C | 3,473,247 | 506,566 |
| Events in quadrant D | 3,584,088 | 482,004 |
| Mode M0 | |||
|---|---|---|---|
| Quadrant | BADHDUFLAG | Total packets | Discarded packets |
| A | 0 | 14896 | 3 |
| B | 0 | 17748 | 2 |
| C | 0 | 15152 | 2 |
| D | 0 | 15837 | 2 |
| Mode SS | |||
|---|---|---|---|
| Quadrant | BADHDUFLAG | Total packets | Discarded packets |
| A | 0 | 148 | 0 |
| B | 0 | 148 | 0 |
| C | 0 | 148 | 0 |
| D | 0 | 148 | 0 |
| Mode M9 | |||
|---|---|---|---|
| Quadrant | BADHDUFLAG | Total packets | Discarded packets |
| A | 0 | 21 | 0 |
| B | 0 | 21 | 0 |
| C | 0 | 21 | 0 |
| D | 0 | 21 | 0 |
| Quadrant | Total seconds | Saturated seconds | Saturation percentage |
|---|---|---|---|
| A | 7216 | 61 | 0.845344% |
| B | 7216 | 108 | 1.496674% |
| C | 7216 | 74 | 1.025499% |
| D | 7216 | 96 | 1.330377% |
Noise dominated data is calculated using 1-second bins in cleaned event files. If a bin has >2000 counts, and if more than 50% of those come from <1% of pixels, then it is considered to be noise-dominated and hence unusable.
| Quadrant | # 1 sec bins | Bins with >0 counts | Bins with >2000 counts | High rate bins dominated by noise | Noise dominated (total time) | Noise dominated (detector-on time) | Marked lightcurve |
|---|---|---|---|---|---|---|---|
| A | 9316 | 7218 | 4 | 4 | 0.04% | 0.06% |  |
| B | 9316 | 7218 | 6 | 6 | 0.06% | 0.08% | 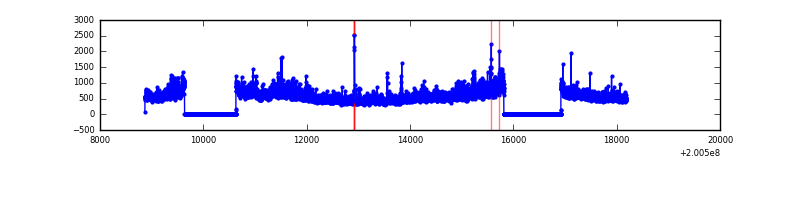 |
| C | 9316 | 7218 | 18 | 18 | 0.19% | 0.25% | 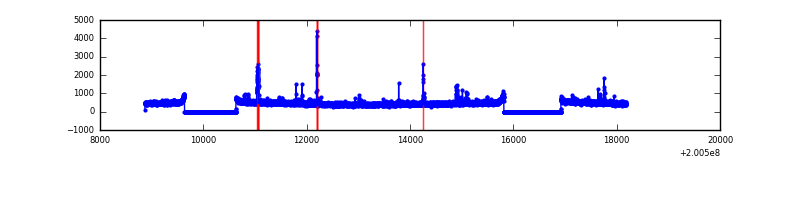 |
| D | 9316 | 7218 | 47 | 47 | 0.50% | 0.65% |  |
Top three noisy pixels from each quadrant. If the there are fewer than three noisy pixels in the level2.evt file, extra rows are filled as -1
| Pixel properties | Quadrant properties | ||||||
|---|---|---|---|---|---|---|---|
| Quadrant | DetID | PixID | Counts | Sigma | Mean | Median | Sigma |
| A | 0 | 118 | 35028 | 192.83 | 857 | 837 | 177.3 |
| A | 0 | 226 | 12096 | 63.5 | 857 | 837 | 177.3 |
| A | 12 | 194 | 8881 | 45.37 | 857 | 837 | 177.3 |
| B | 15 | 204 | 791107 | 4712.8 | 870 | 849 | 167.7 |
| B | 0 | 229 | 59638 | 350.6 | 870 | 849 | 167.7 |
| B | 14 | 167 | 50417 | 295.6 | 870 | 849 | 167.7 |
| C | 9 | 54 | 119339 | 603.02 | 839 | 844 | 196.5 |
| C | 1 | 192 | 25844 | 127.22 | 839 | 844 | 196.5 |
| C | 6 | 80 | 22894 | 112.21 | 839 | 844 | 196.5 |
| D | 13 | 223 | 310981 | 1535.26 | 831 | 808 | 202.0 |
| D | 13 | 239 | 50435 | 245.64 | 831 | 808 | 202.0 |
| D | 14 | 34 | 23535 | 112.49 | 831 | 808 | 202.0 |
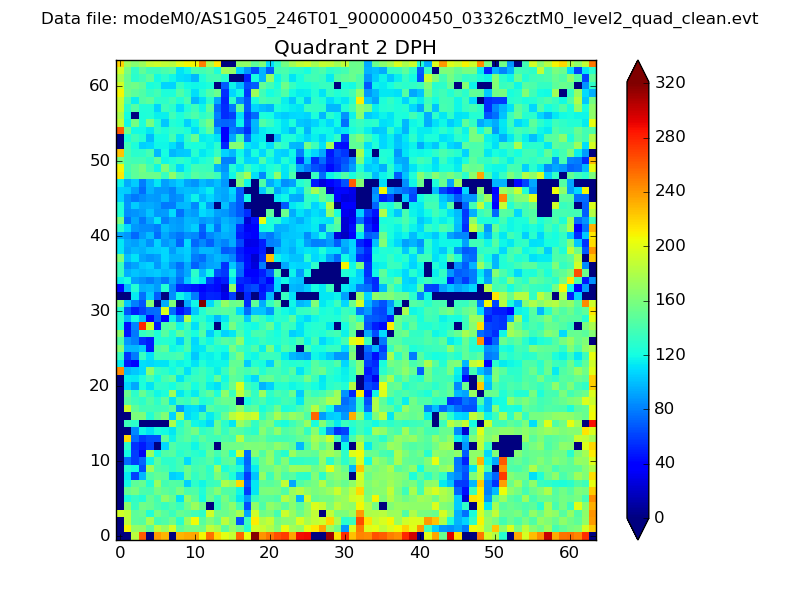
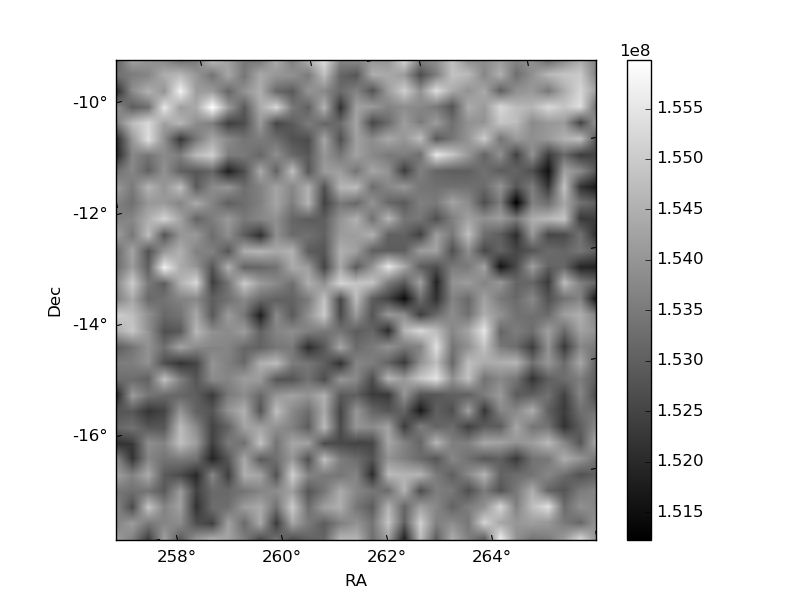
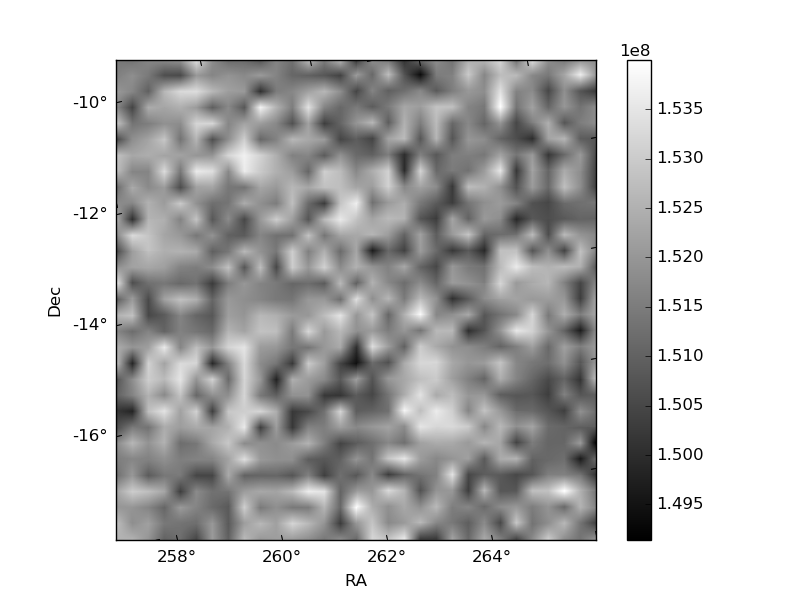
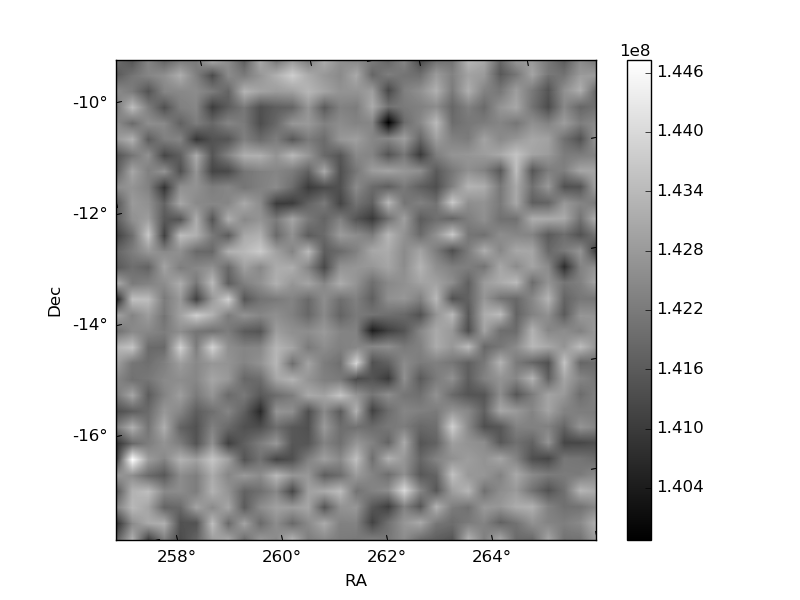
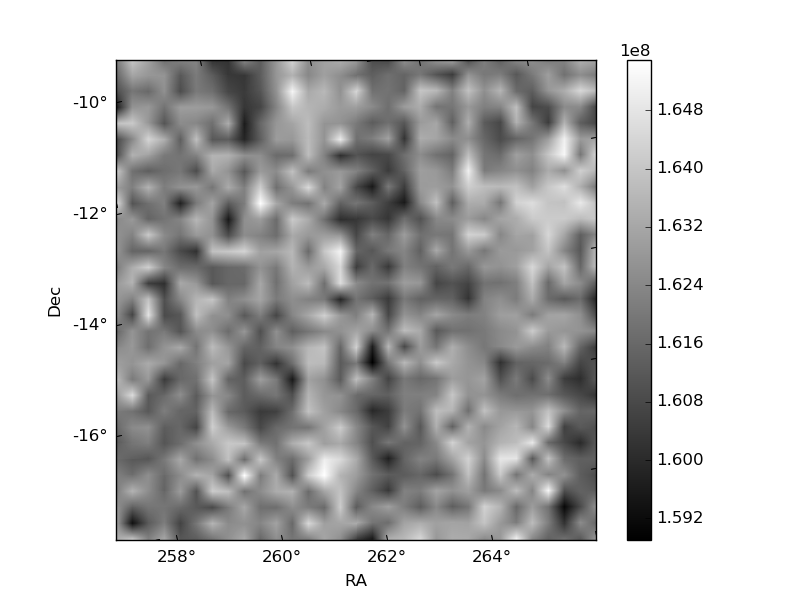
Histogram calculated using DETX and DETY for each event in the final _common_clean file
| Quadrant A | 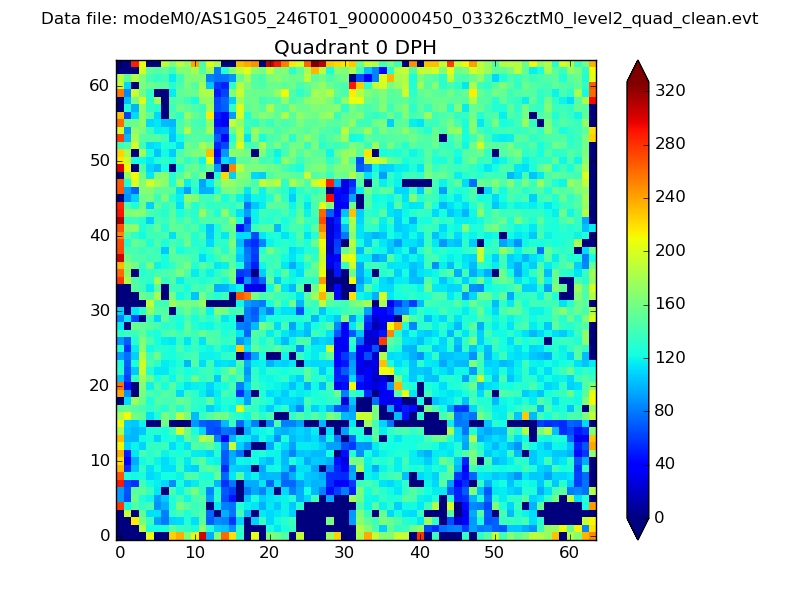 |
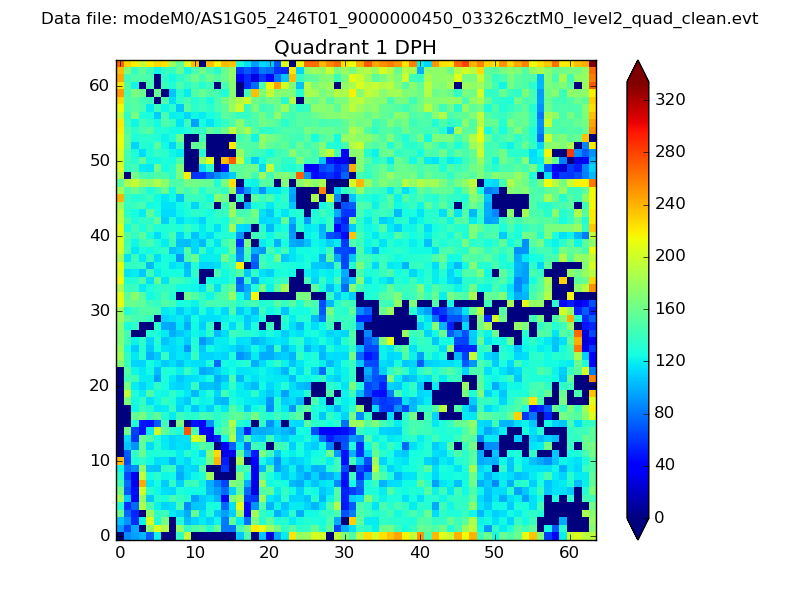 |
Quadrant B |
|---|---|---|---|
| Quadrant D | 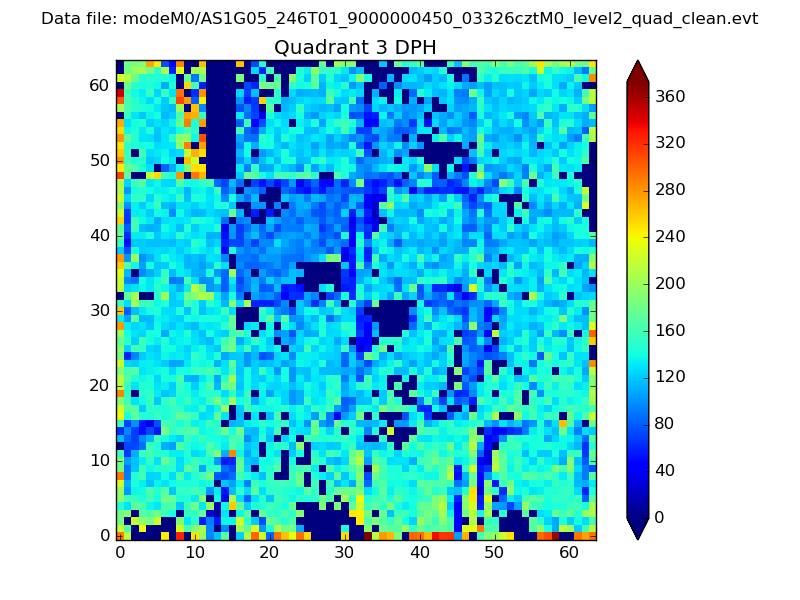 |
 |
Quadrant C |
| Plot type | Count rate plots | Images |
|---|---|---|
| Comparison with Poisson distribution Blue bars denote a histogram of data divided into 1 sec bins. Red curve is a Poisson curve with rate = median count rate of data. |
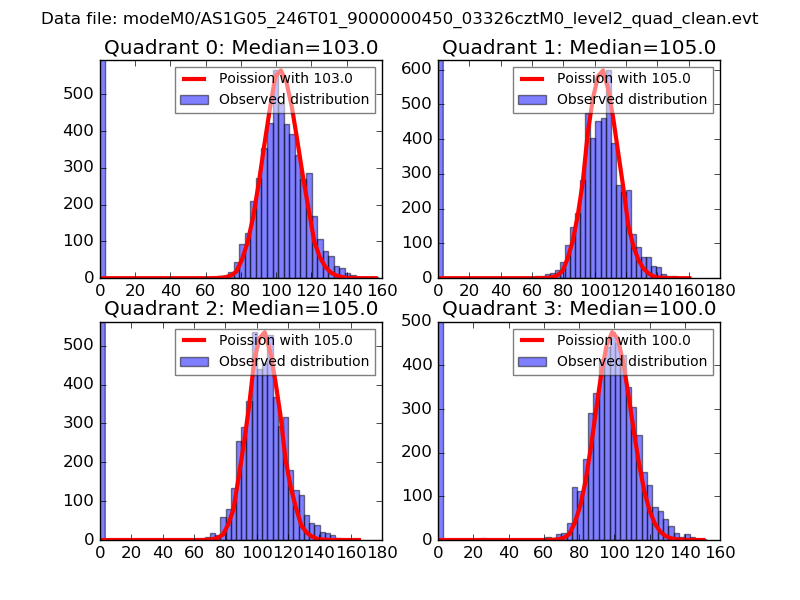 |
 |
| Quadrant-wise count rates Data is divided into 100 sec bins |
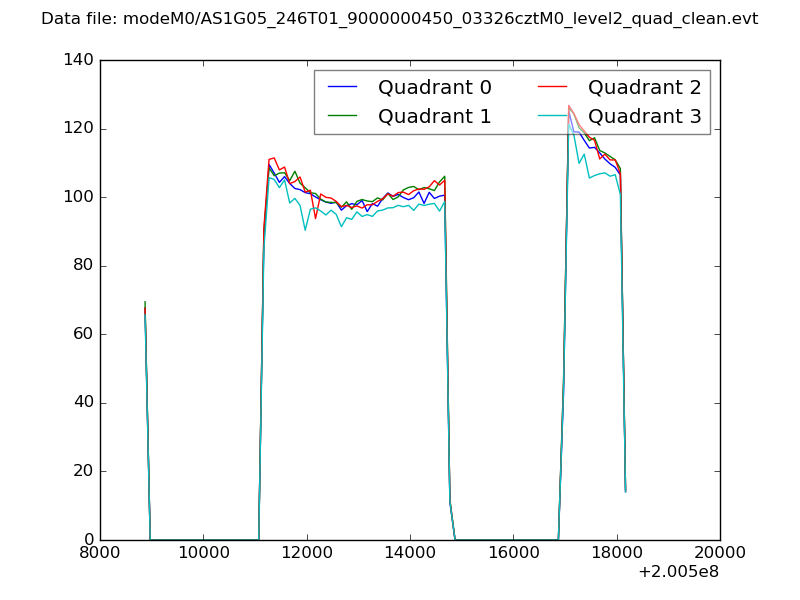 |
|
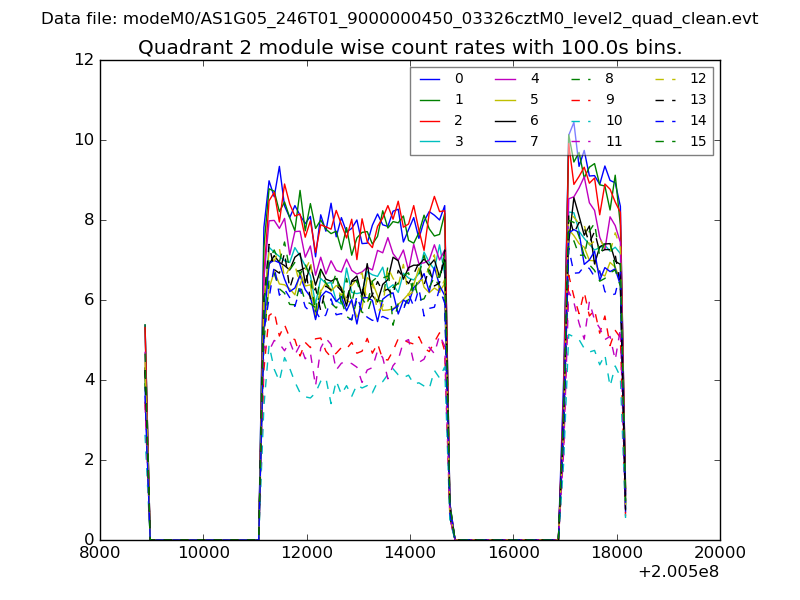
| Module-wise count rates for Quadrant A Data is divided into 100 sec bins |
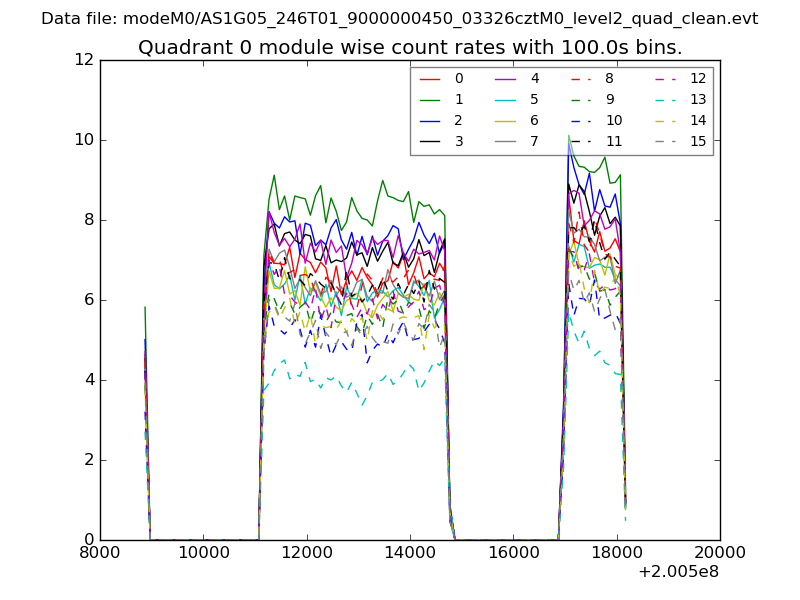 |
 |
| Module-wise count rates for Quadrant B Data is divided into 100 sec bins |
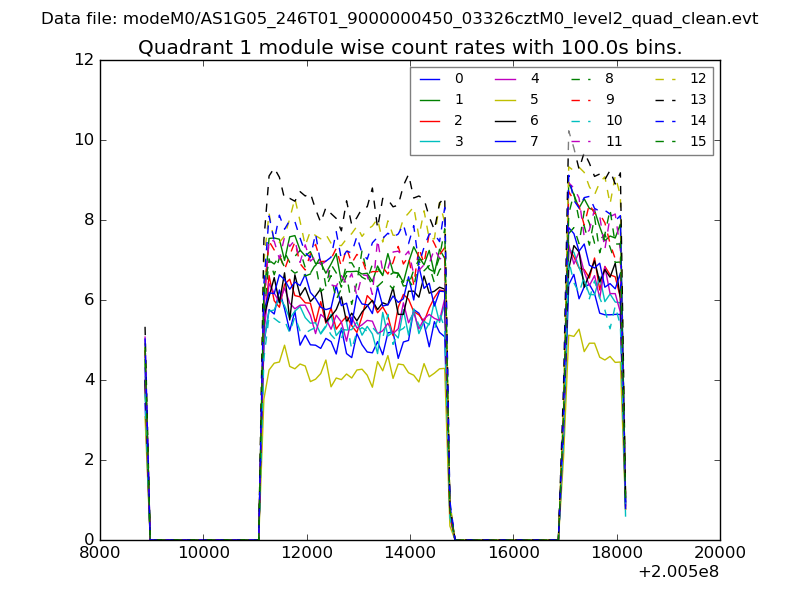 |
 |
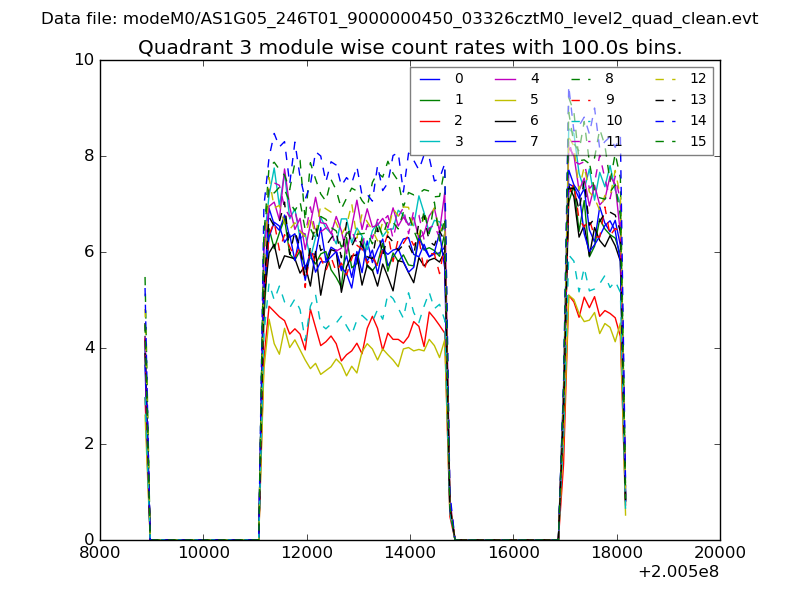
| Module-wise count rates for Quadrant C Data is divided into 100 sec bins |
 |
 |
| Module-wise count rates for Quadrant D Data is divided into 100 sec bins |
 |
 |
| Parameter | Plot |
|---|---|
| CZT HV Monitor | 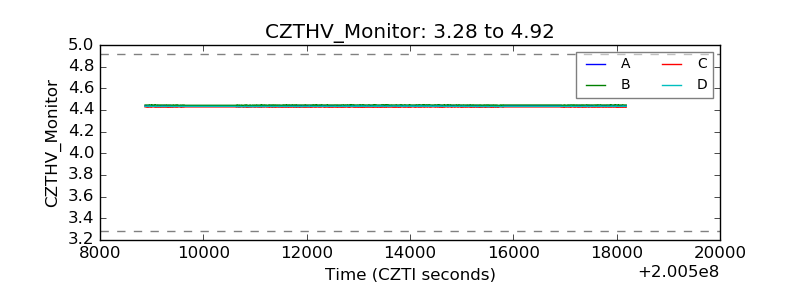 |
| D_VDD | 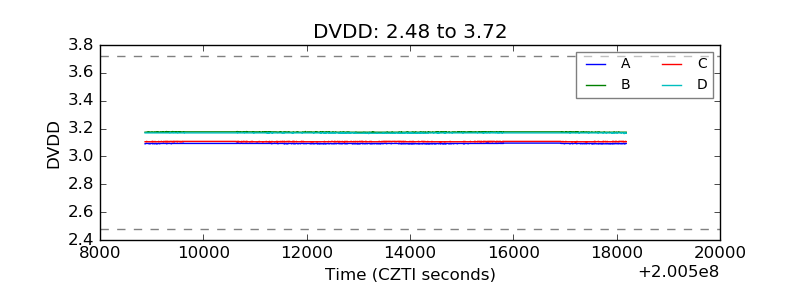 |
| Temperature 1 | 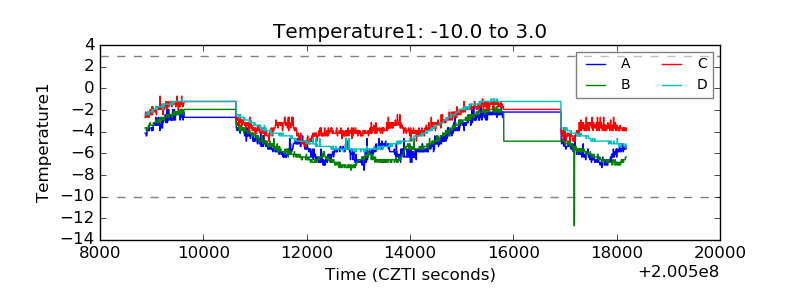 |
| Veto HV Monitor |  |
| Veto LLD | 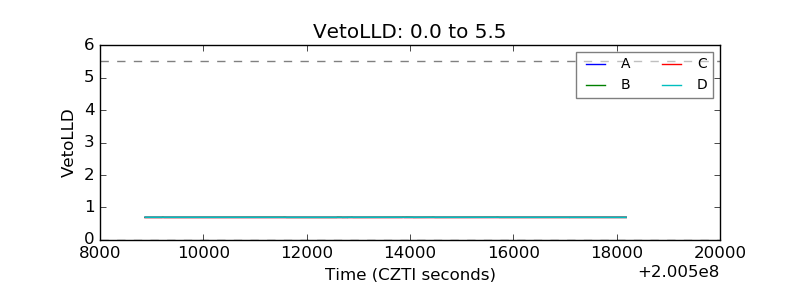 |
| Alpha Counter | 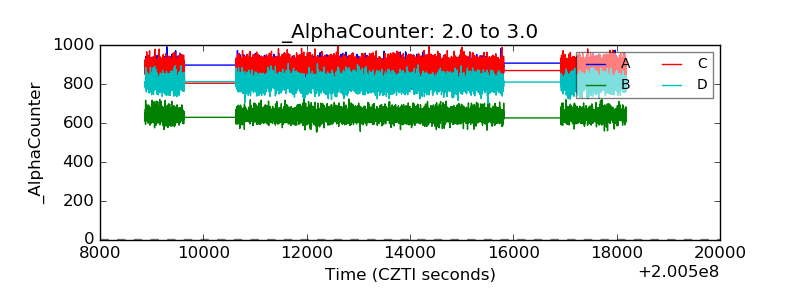 |
| _CPM_Rate | 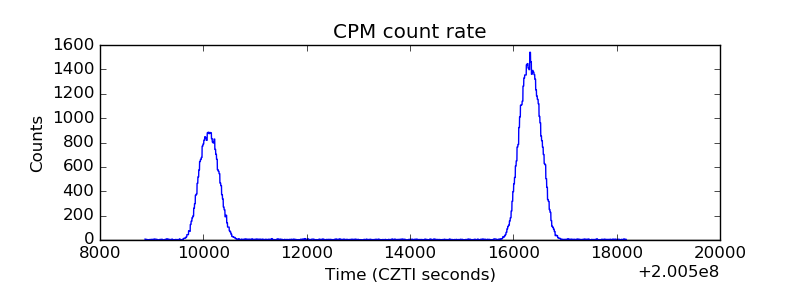 |
| CZT Counter | 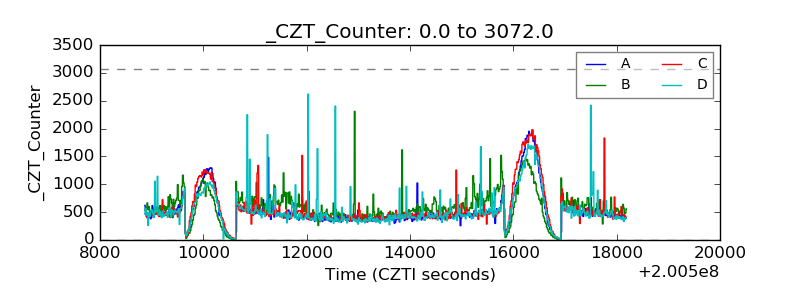 |
| +2.5 Volts monitor |  |
| +5 Volts monitor |  |
| _ROLL_ROT | 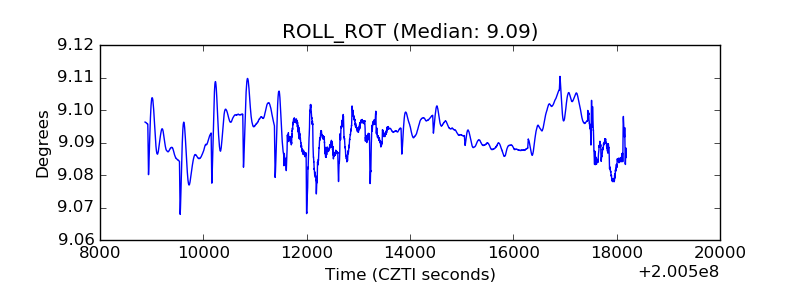 |
| _Roll_DEC | 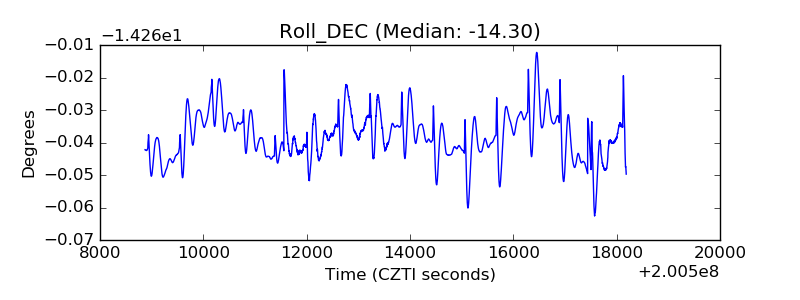 |
| _Roll_RA | 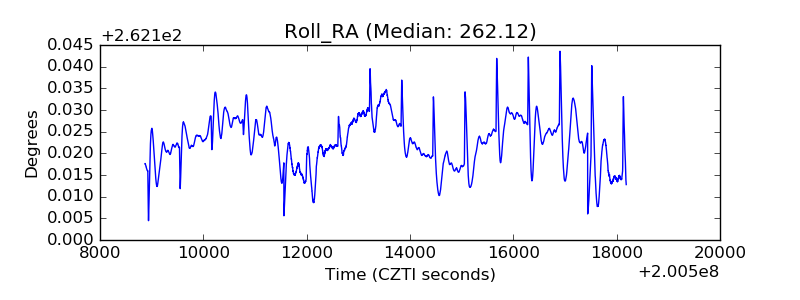 |
| Veto Counter | 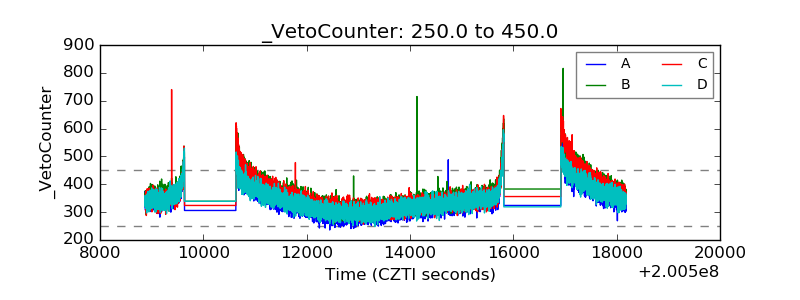 |