| Param | Original file | Final file |
|---|---|---|
| Filename | modeM0/AS1G05_246T01_9000000450_03327cztM0_level2.evt | modeM0/AS1G05_246T01_9000000450_03327cztM0_level2_quad_clean.evt |
| Size (bytes) | 505,077,120 | 85,550,400 |
| Size | 481.7 MB | 81.6 MB |
| Events in quadrant A | 3,381,431 | 519,906 |
| Events in quadrant B | 4,234,711 | 534,651 |
| Events in quadrant C | 3,486,231 | 530,181 |
| Events in quadrant D | 3,703,313 | 502,698 |
| Mode M0 | |||
|---|---|---|---|
| Quadrant | BADHDUFLAG | Total packets | Discarded packets |
| A | 0 | 14969 | 3 |
| B | 0 | 17435 | 2 |
| C | 0 | 15131 | 2 |
| D | 0 | 16138 | 2 |
| Mode SS | |||
|---|---|---|---|
| Quadrant | BADHDUFLAG | Total packets | Discarded packets |
| A | 0 | 150 | 0 |
| B | 0 | 150 | 0 |
| C | 0 | 150 | 0 |
| D | 0 | 150 | 0 |
| Mode M9 | |||
|---|---|---|---|
| Quadrant | BADHDUFLAG | Total packets | Discarded packets |
| A | 0 | 23 | 0 |
| B | 0 | 23 | 0 |
| C | 0 | 23 | 0 |
| D | 0 | 23 | 0 |
| Quadrant | Total seconds | Saturated seconds | Saturation percentage |
|---|---|---|---|
| A | 7221 | 58 | 0.803213% |
| B | 7221 | 101 | 1.398698% |
| C | 7221 | 46 | 0.637031% |
| D | 7221 | 129 | 1.786456% |
Noise dominated data is calculated using 1-second bins in cleaned event files. If a bin has >2000 counts, and if more than 50% of those come from <1% of pixels, then it is considered to be noise-dominated and hence unusable.
| Quadrant | # 1 sec bins | Bins with >0 counts | Bins with >2000 counts | High rate bins dominated by noise | Noise dominated (total time) | Noise dominated (detector-on time) | Marked lightcurve |
|---|---|---|---|---|---|---|---|
| A | 9546 | 7223 | 10 | 10 | 0.10% | 0.14% | 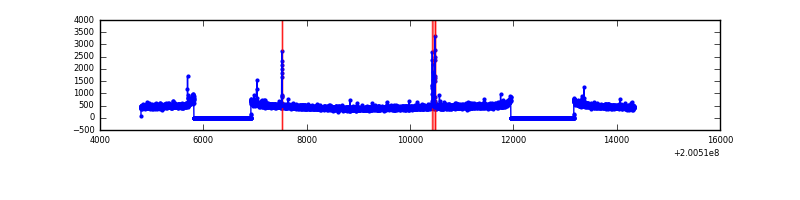 |
| B | 9546 | 7223 | 2 | 2 | 0.02% | 0.03% | 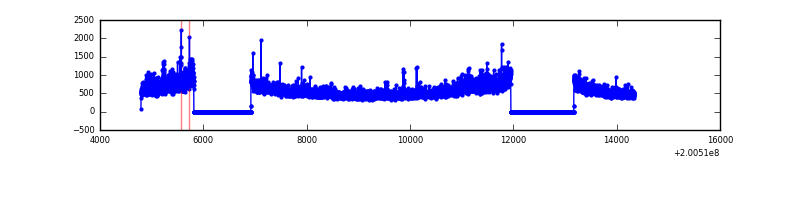 |
| C | 9546 | 7223 | 9 | 9 | 0.09% | 0.12% | 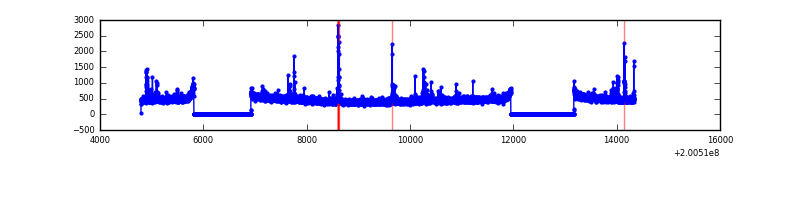 |
| D | 9546 | 7223 | 71 | 71 | 0.74% | 0.98% | 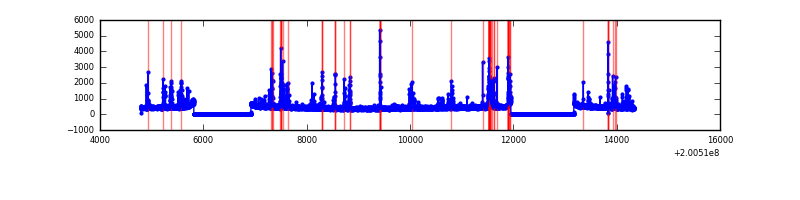 |
Top three noisy pixels from each quadrant. If the there are fewer than three noisy pixels in the level2.evt file, extra rows are filled as -1
| Pixel properties | Quadrant properties | ||||||
|---|---|---|---|---|---|---|---|
| Quadrant | DetID | PixID | Counts | Sigma | Mean | Median | Sigma |
| A | 7 | 16 | 38298 | 213.29 | 860 | 843 | 175.6 |
| A | 0 | 118 | 17982 | 97.6 | 860 | 843 | 175.6 |
| A | 0 | 226 | 10465 | 54.79 | 860 | 843 | 175.6 |
| B | 15 | 204 | 729067 | 4312.55 | 880 | 859 | 168.9 |
| B | 0 | 229 | 52045 | 303.13 | 880 | 859 | 168.9 |
| B | 14 | 167 | 29162 | 167.61 | 880 | 859 | 168.9 |
| C | 9 | 54 | 83759 | 418.07 | 850 | 857 | 198.3 |
| C | 12 | 175 | 26268 | 128.15 | 850 | 857 | 198.3 |
| C | 6 | 80 | 24328 | 118.36 | 850 | 857 | 198.3 |
| D | 13 | 223 | 384931 | 1900.66 | 836 | 813 | 202.1 |
| D | 13 | 239 | 85621 | 419.64 | 836 | 813 | 202.1 |
| D | 10 | 172 | 51541 | 251.01 | 836 | 813 | 202.1 |
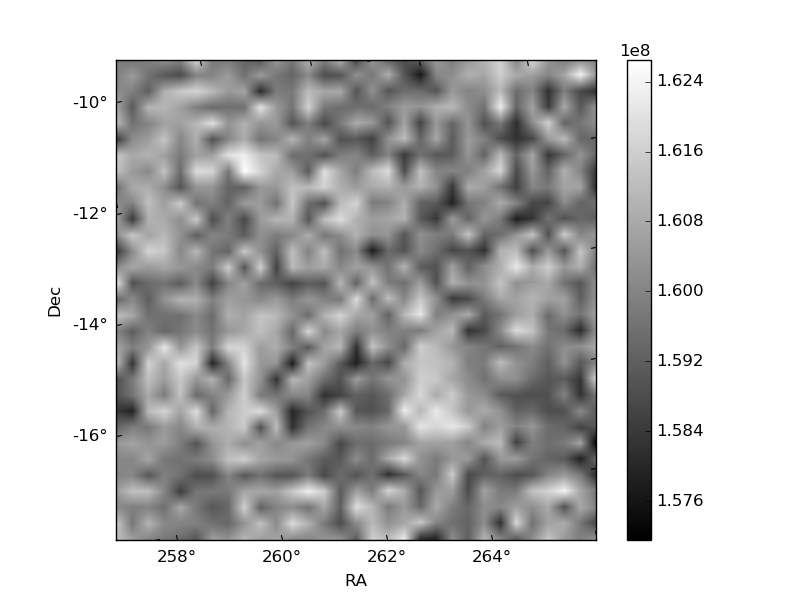
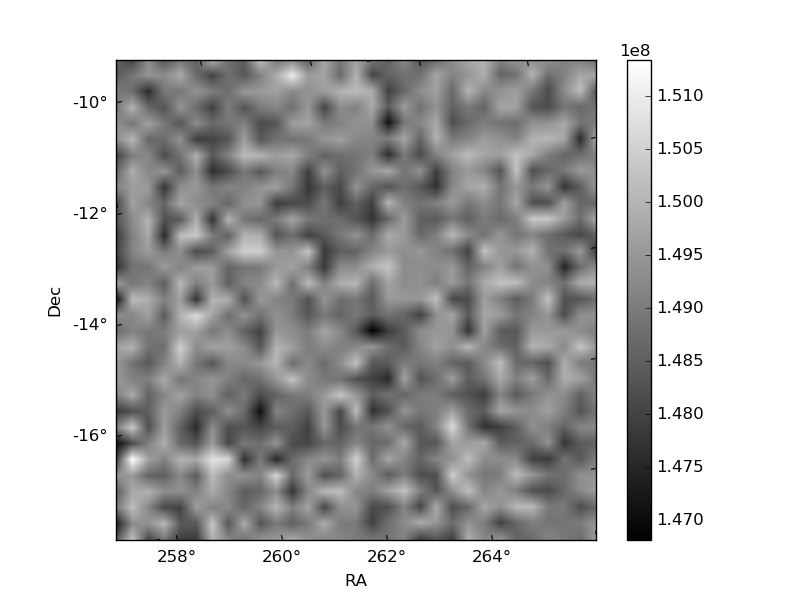
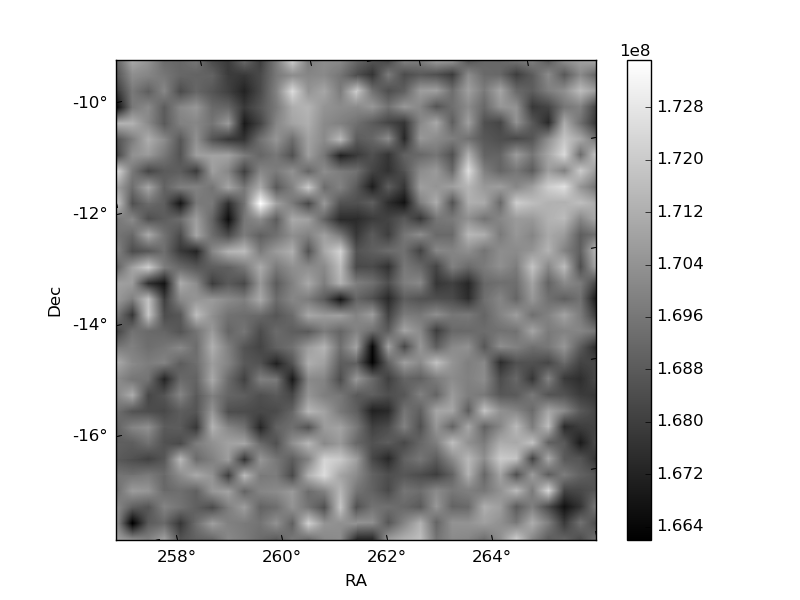
Histogram calculated using DETX and DETY for each event in the final _common_clean file
| Quadrant A | 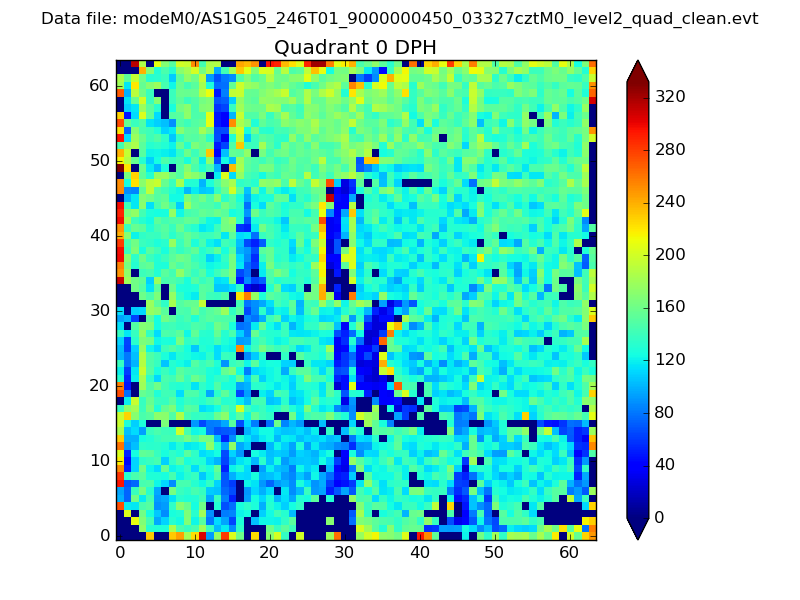 |
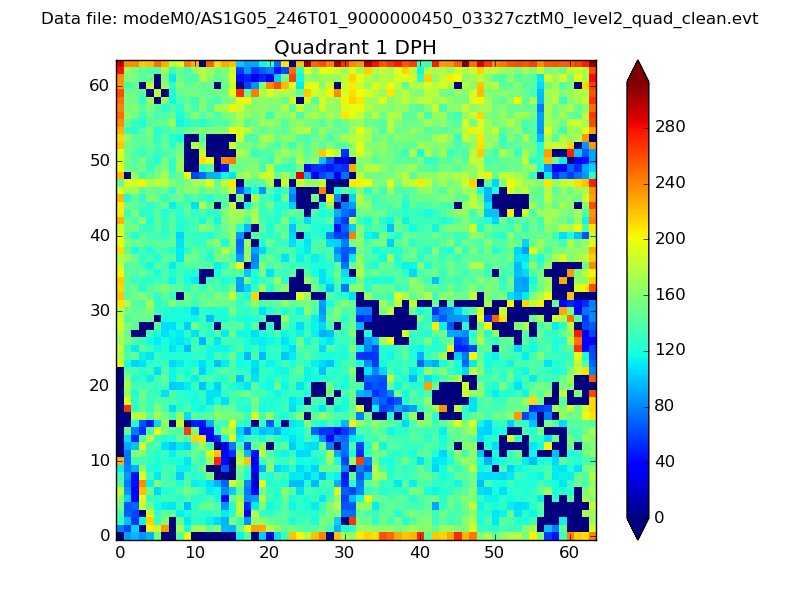 |
Quadrant B |
|---|---|---|---|
| Quadrant D | 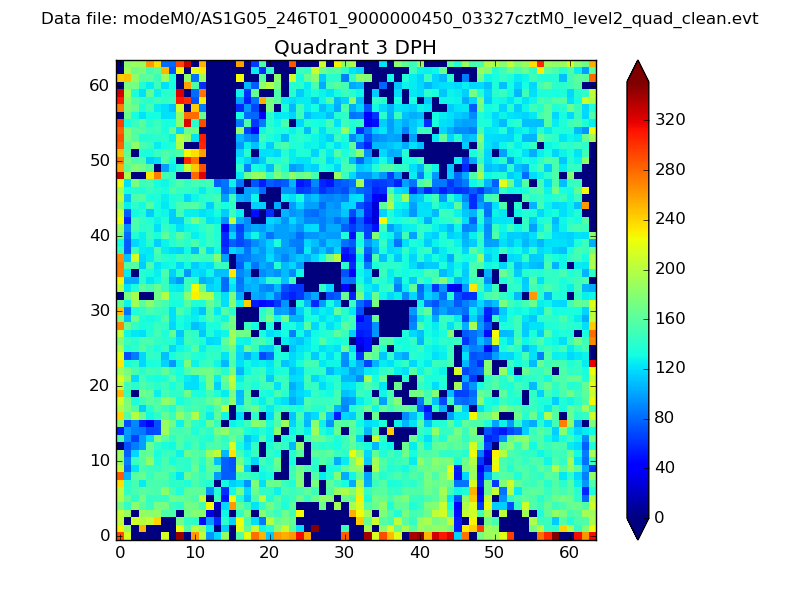 |
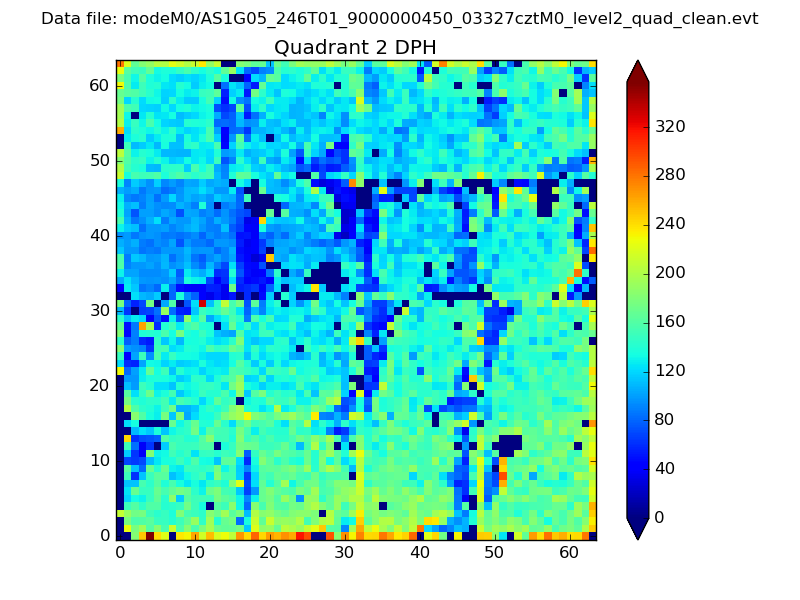 |
Quadrant C |
| Plot type | Count rate plots | Images |
|---|---|---|
| Comparison with Poisson distribution Blue bars denote a histogram of data divided into 1 sec bins. Red curve is a Poisson curve with rate = median count rate of data. |
 |
 |
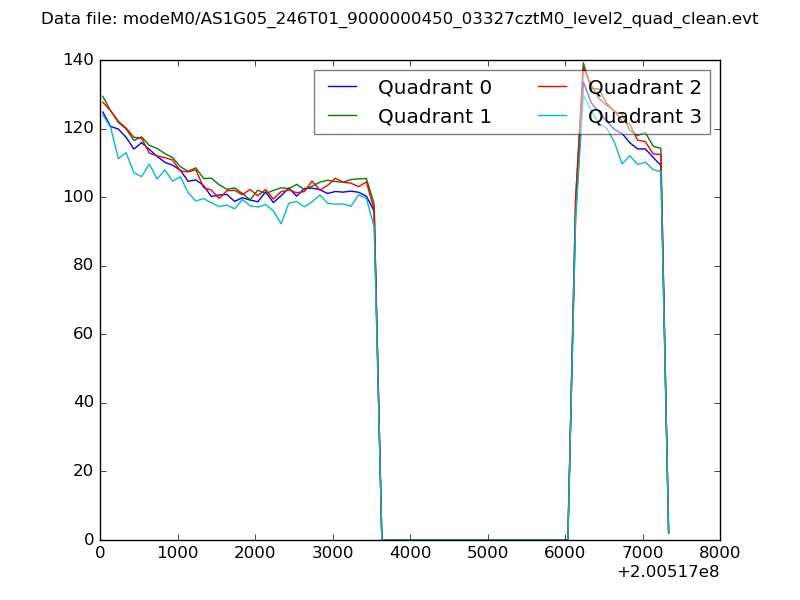
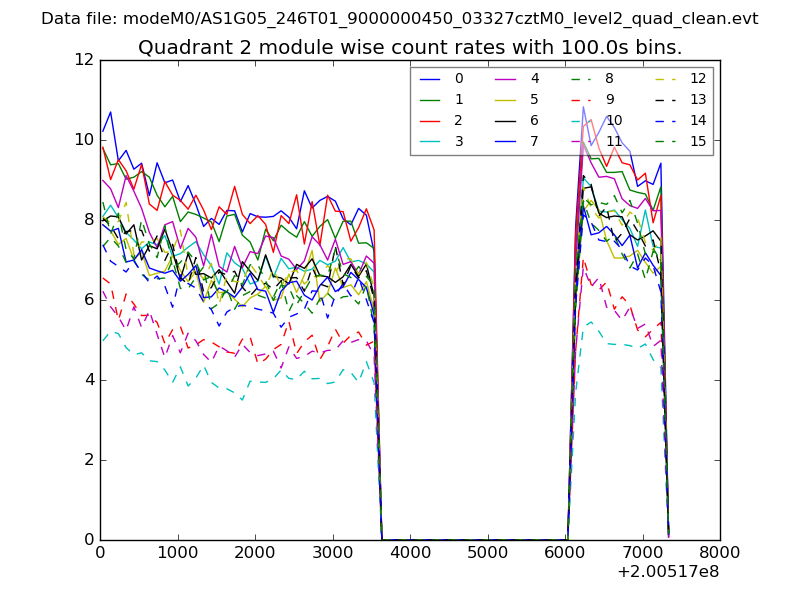
| Quadrant-wise count rates Data is divided into 100 sec bins |
 |
|
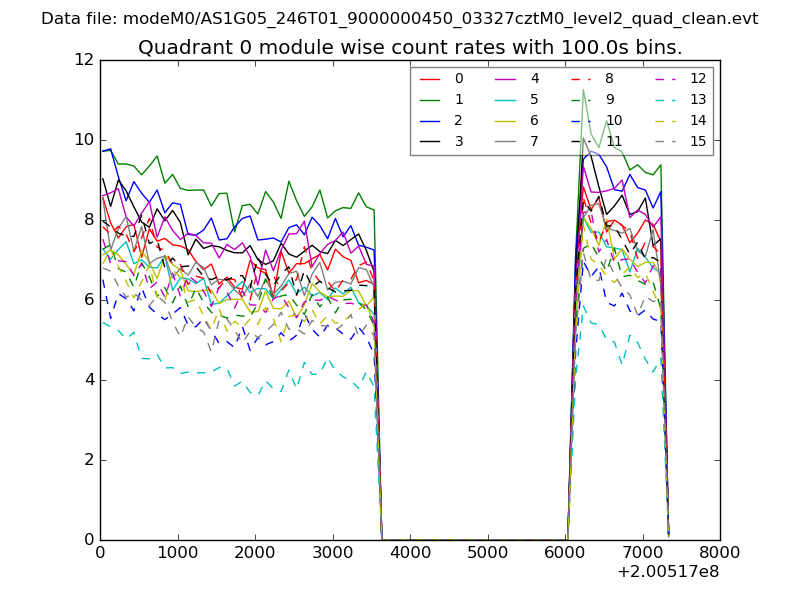
| Module-wise count rates for Quadrant A Data is divided into 100 sec bins |
 |
 |
| Module-wise count rates for Quadrant B Data is divided into 100 sec bins |
 |
 |
| Module-wise count rates for Quadrant C Data is divided into 100 sec bins |
 |
 |
| Module-wise count rates for Quadrant D Data is divided into 100 sec bins |
 |
 |
| Parameter | Plot |
|---|---|
| CZT HV Monitor | 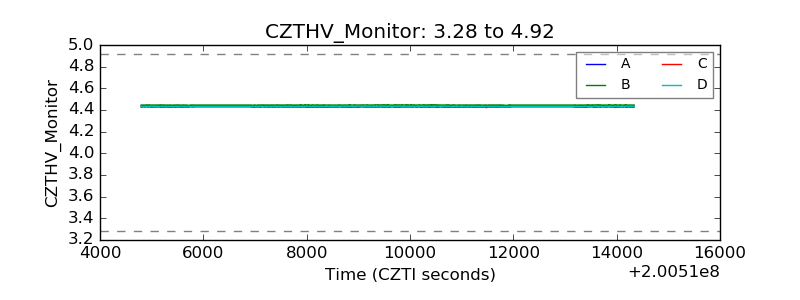 |
| D_VDD | 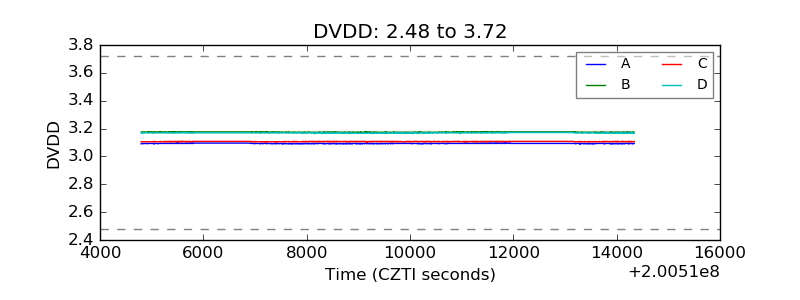 |
| Temperature 1 | 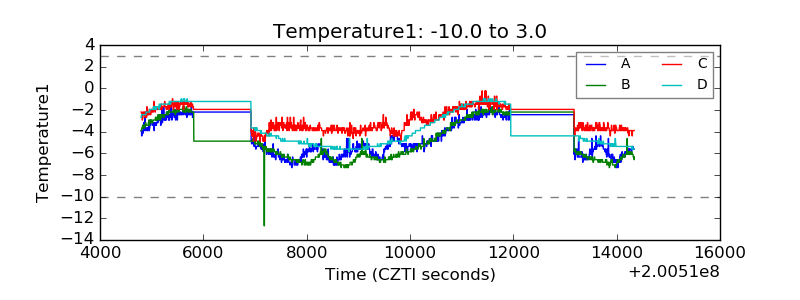 |
| Veto HV Monitor | 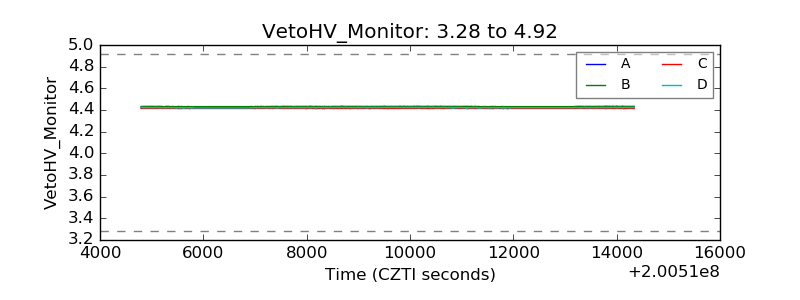 |
| Veto LLD | 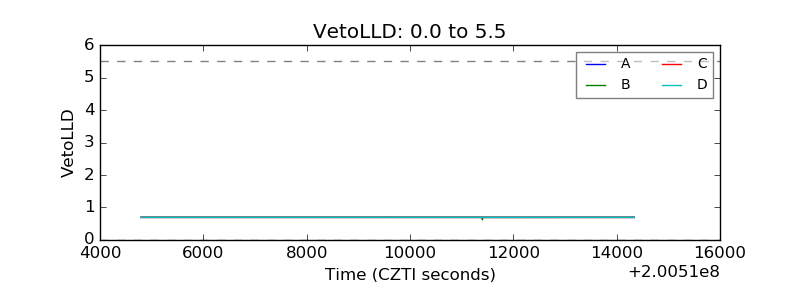 |
| Alpha Counter | 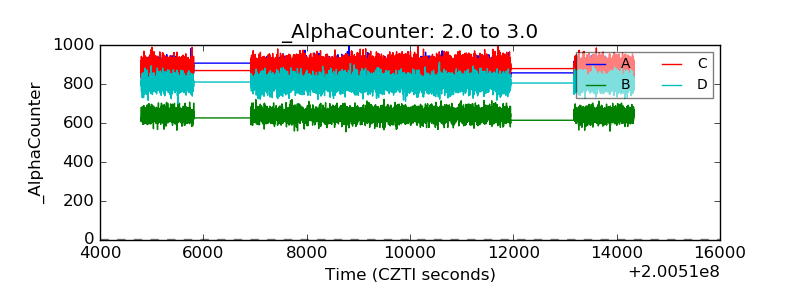 |
| _CPM_Rate | 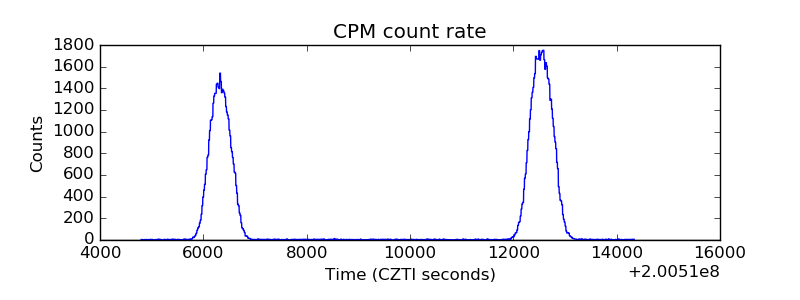 |
| CZT Counter | 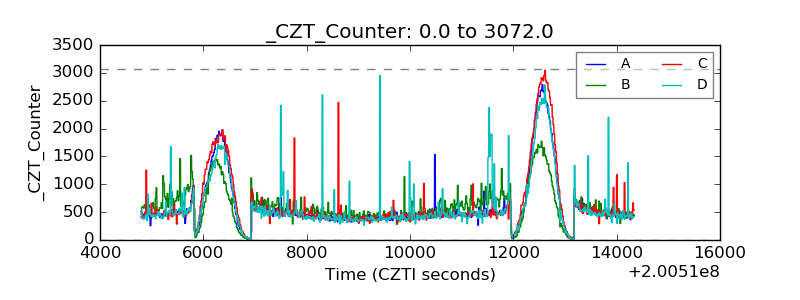 |
| +2.5 Volts monitor |  |
| +5 Volts monitor |  |
| _ROLL_ROT |  |
| _Roll_DEC |  |
| _Roll_RA | 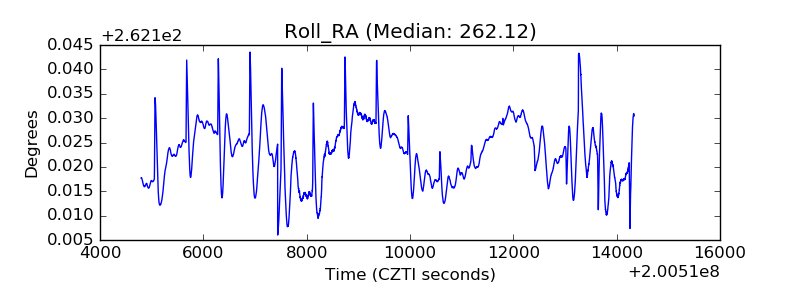 |
| Veto Counter | 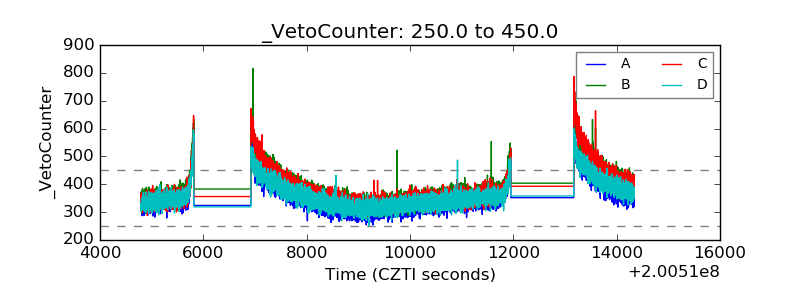 |