| Param | Original file | Final file |
|---|---|---|
| Filename | modeM0/AS1G05_246T01_9000000450_03329cztM0_level2.evt | modeM0/AS1G05_246T01_9000000450_03329cztM0_level2_quad_clean.evt |
| Size (bytes) | 492,615,360 | 84,150,720 |
| Size | 469.8 MB | 80.3 MB |
| Events in quadrant A | 3,132,689 | 518,704 |
| Events in quadrant B | 3,827,557 | 532,423 |
| Events in quadrant C | 3,252,561 | 528,686 |
| Events in quadrant D | 4,248,146 | 498,190 |
| Mode M0 | |||
|---|---|---|---|
| Quadrant | BADHDUFLAG | Total packets | Discarded packets |
| A | 0 | 13972 | 3 |
| B | 0 | 15939 | 2 |
| C | 0 | 14212 | 2 |
| D | 0 | 16712 | 2 |
| Mode SS | |||
|---|---|---|---|
| Quadrant | BADHDUFLAG | Total packets | Discarded packets |
| A | 0 | 136 | 0 |
| B | 0 | 136 | 0 |
| C | 0 | 136 | 0 |
| D | 0 | 136 | 0 |
| Mode M9 | |||
|---|---|---|---|
| Quadrant | BADHDUFLAG | Total packets | Discarded packets |
| A | 0 | 21 | 0 |
| B | 0 | 21 | 0 |
| C | 0 | 21 | 0 |
| D | 0 | 22 | 0 |
| Quadrant | Total seconds | Saturated seconds | Saturation percentage |
|---|---|---|---|
| A | 6750 | 45 | 0.666667% |
| B | 6750 | 128 | 1.896296% |
| C | 6750 | 27 | 0.400000% |
| D | 6750 | 88 | 1.303704% |
Noise dominated data is calculated using 1-second bins in cleaned event files. If a bin has >2000 counts, and if more than 50% of those come from <1% of pixels, then it is considered to be noise-dominated and hence unusable.
| Quadrant | # 1 sec bins | Bins with >0 counts | Bins with >2000 counts | High rate bins dominated by noise | Noise dominated (total time) | Noise dominated (detector-on time) | Marked lightcurve |
|---|---|---|---|---|---|---|---|
| A | 7980 | 6751 | 2 | 2 | 0.03% | 0.03% | 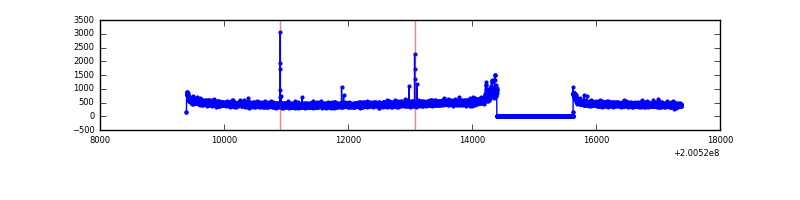 |
| B | 7980 | 6751 | 63 | 63 | 0.79% | 0.93% |  |
| C | 7980 | 6751 | 13 | 13 | 0.16% | 0.19% | 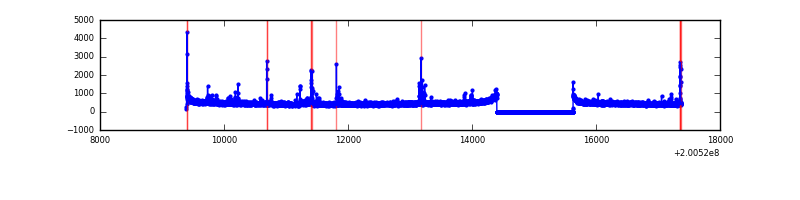 |
| D | 7980 | 6751 | 57 | 57 | 0.71% | 0.84% | 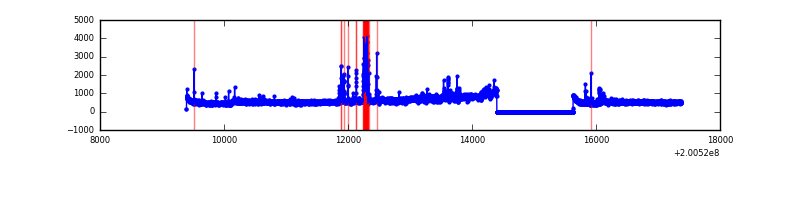 |
Top three noisy pixels from each quadrant. If the there are fewer than three noisy pixels in the level2.evt file, extra rows are filled as -1
| Pixel properties | Quadrant properties | ||||||
|---|---|---|---|---|---|---|---|
| Quadrant | DetID | PixID | Counts | Sigma | Mean | Median | Sigma |
| A | 0 | 118 | 30595 | 182.01 | 802 | 785 | 163.8 |
| A | 0 | 226 | 11056 | 62.71 | 802 | 785 | 163.8 |
| A | 12 | 194 | 8464 | 46.89 | 802 | 785 | 163.8 |
| B | 15 | 204 | 358863 | 2274.51 | 819 | 800 | 157.4 |
| B | 6 | 203 | 221757 | 1403.57 | 819 | 800 | 157.4 |
| B | 0 | 229 | 51782 | 323.85 | 819 | 800 | 157.4 |
| C | 9 | 54 | 62329 | 332.73 | 792 | 797 | 184.9 |
| C | 1 | 16 | 59652 | 318.25 | 792 | 797 | 184.9 |
| C | 14 | 223 | 17957 | 92.79 | 792 | 797 | 184.9 |
| D | 12 | 246 | 1013054 | 5423.99 | 777 | 758 | 186.6 |
| D | 13 | 223 | 233638 | 1247.8 | 777 | 758 | 186.6 |
| D | 13 | 239 | 36141 | 189.59 | 777 | 758 | 186.6 |
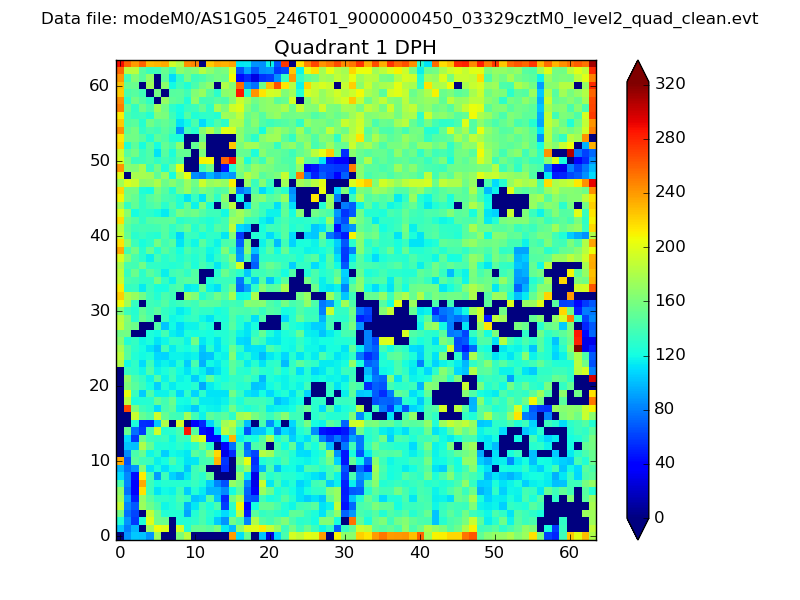
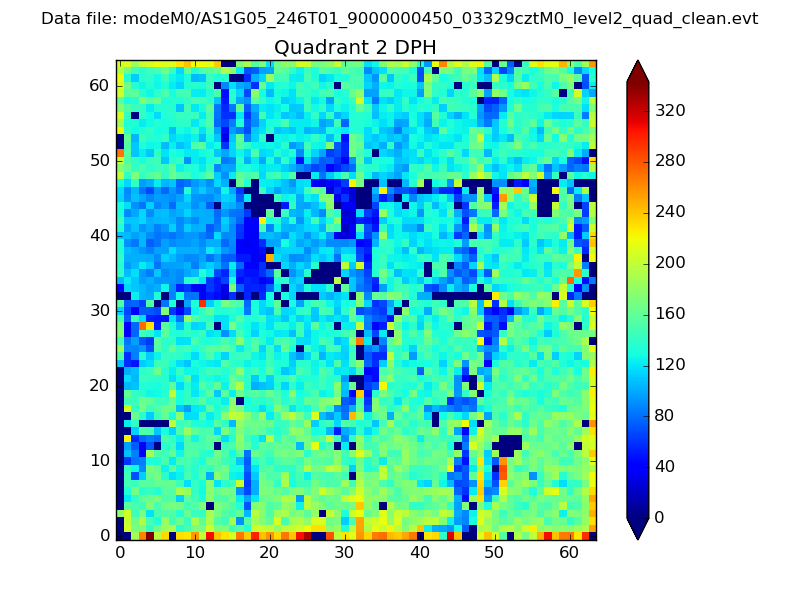
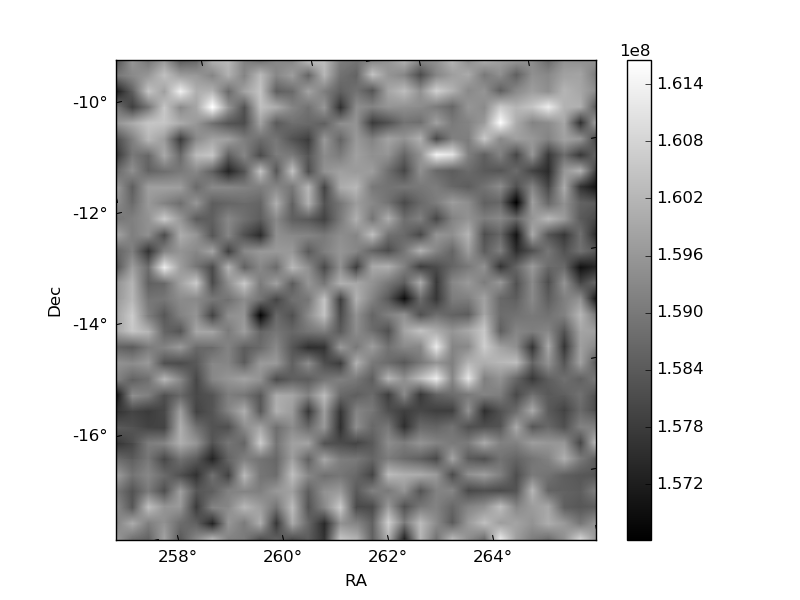
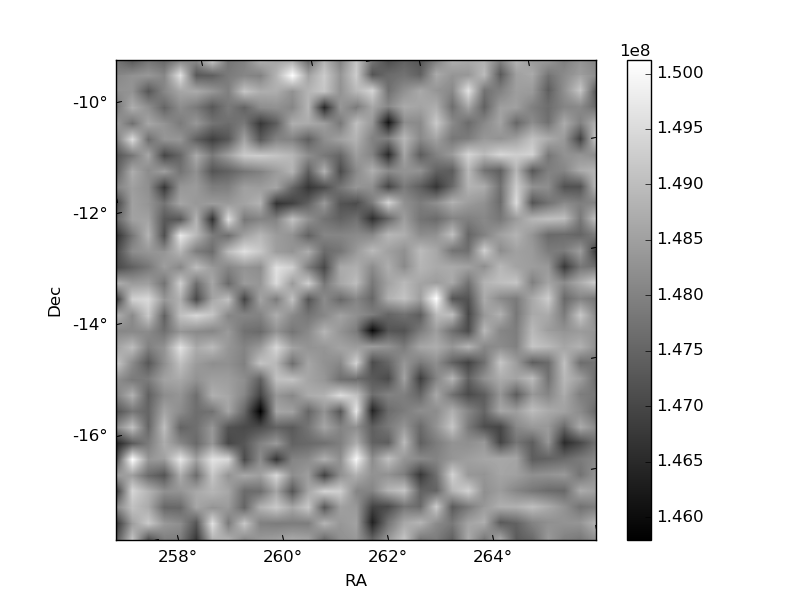
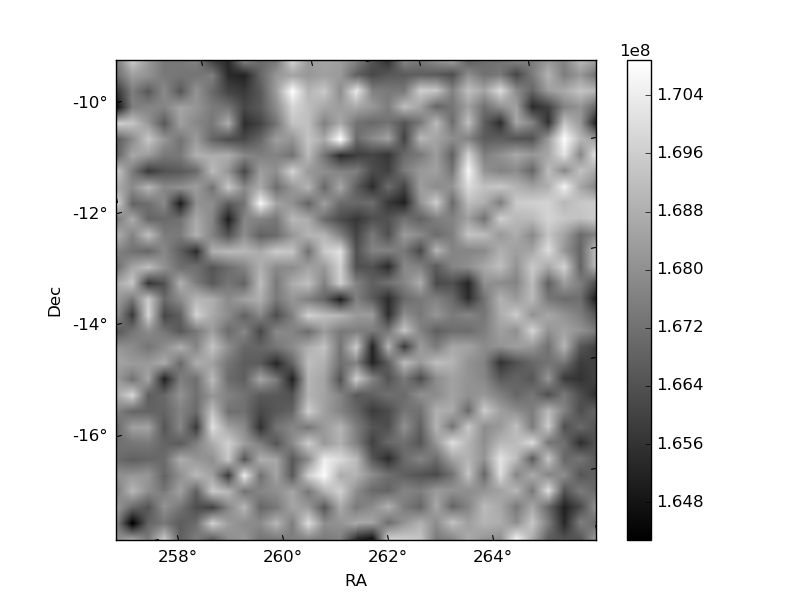
Histogram calculated using DETX and DETY for each event in the final _common_clean file
| Quadrant A | 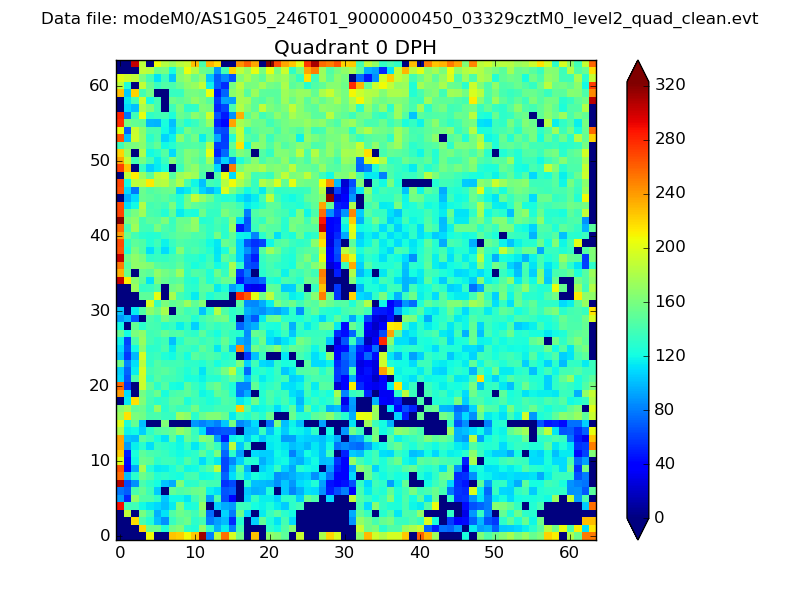 |
 |
Quadrant B |
|---|---|---|---|
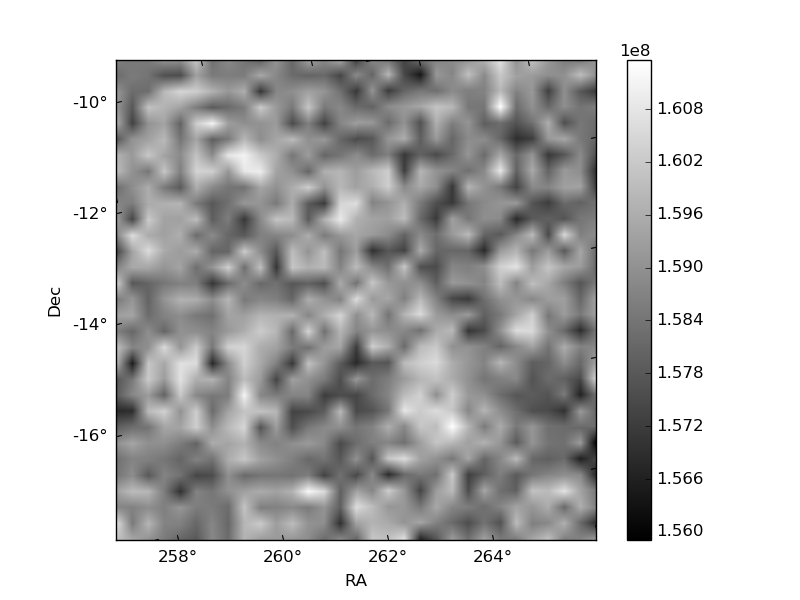
| Quadrant D | 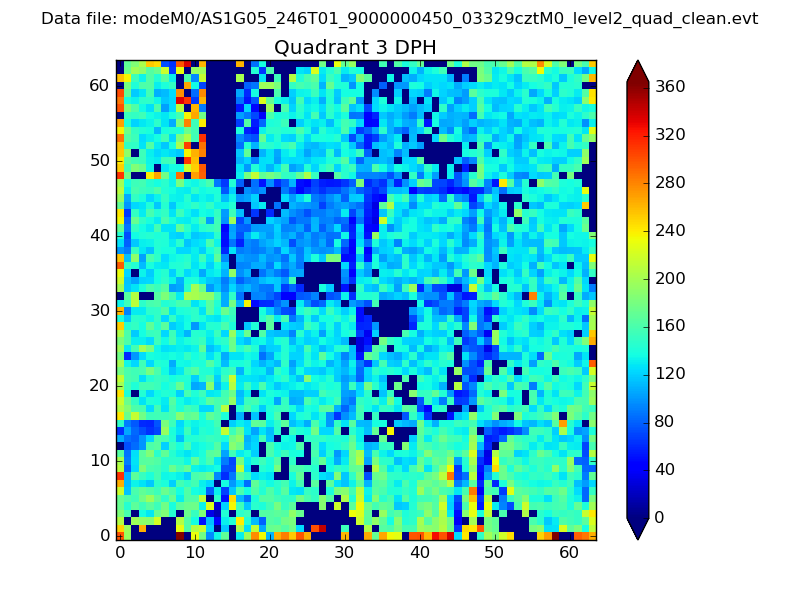 |
 |
Quadrant C |
| Plot type | Count rate plots | Images |
|---|---|---|
| Comparison with Poisson distribution Blue bars denote a histogram of data divided into 1 sec bins. Red curve is a Poisson curve with rate = median count rate of data. |
 |
 |
| Quadrant-wise count rates Data is divided into 100 sec bins |
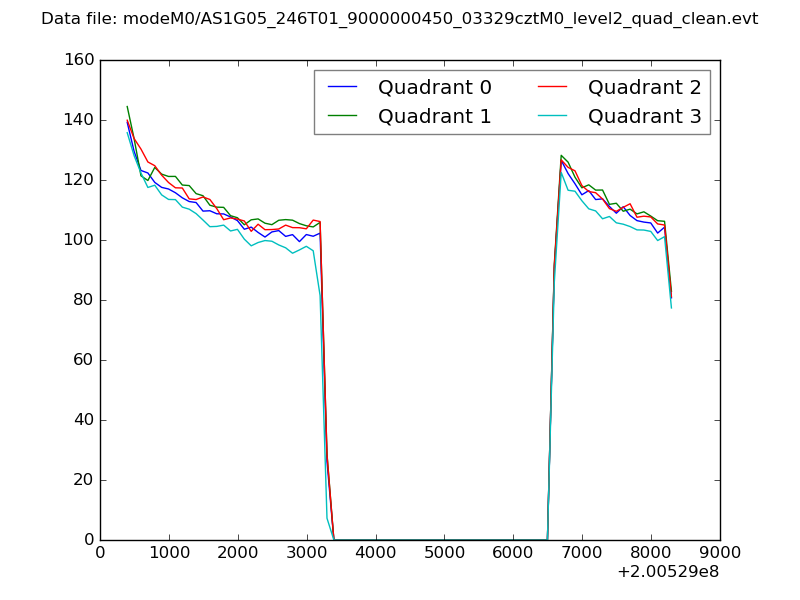 |
|
| Module-wise count rates for Quadrant A Data is divided into 100 sec bins |
 |
 |
| Module-wise count rates for Quadrant B Data is divided into 100 sec bins |
 |
 |
| Module-wise count rates for Quadrant C Data is divided into 100 sec bins |
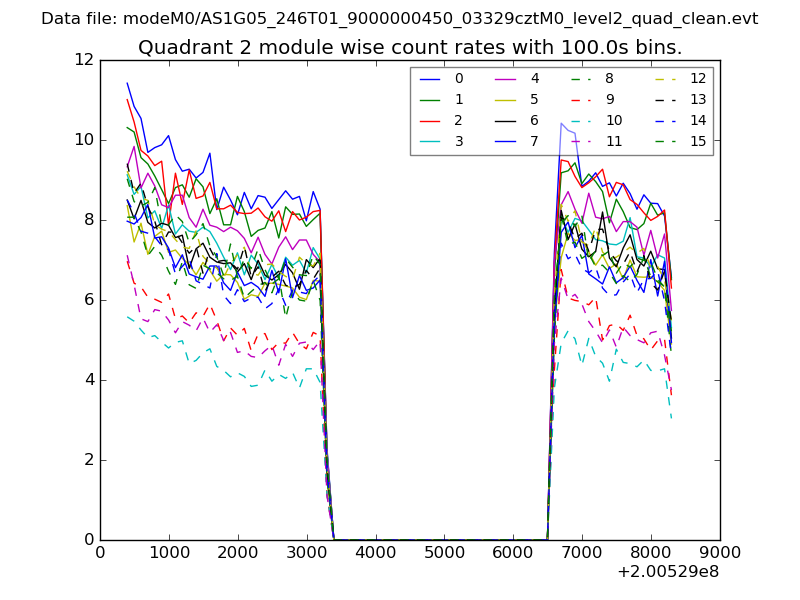 |
 |
| Module-wise count rates for Quadrant D Data is divided into 100 sec bins |
 |
 |
| Parameter | Plot |
|---|---|
| CZT HV Monitor | 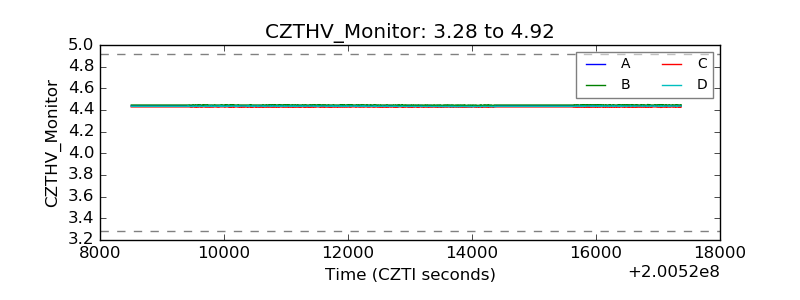 |
| D_VDD | 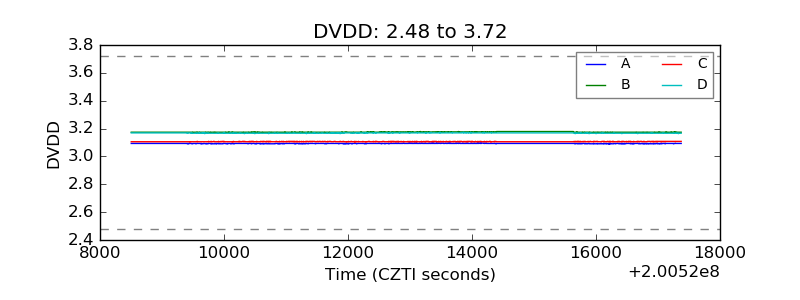 |
| Temperature 1 | 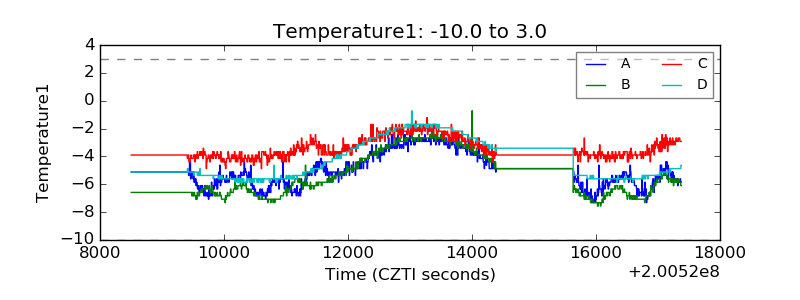 |
| Veto HV Monitor | 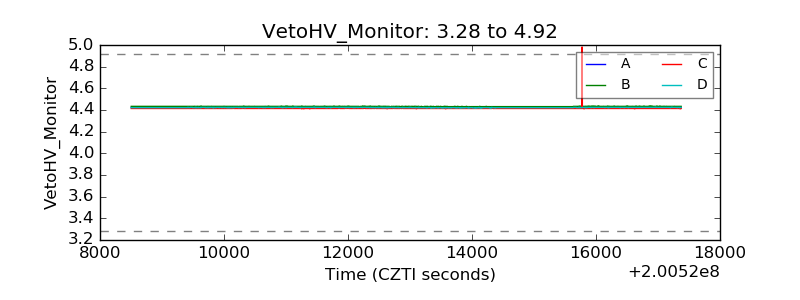 |
| Veto LLD | 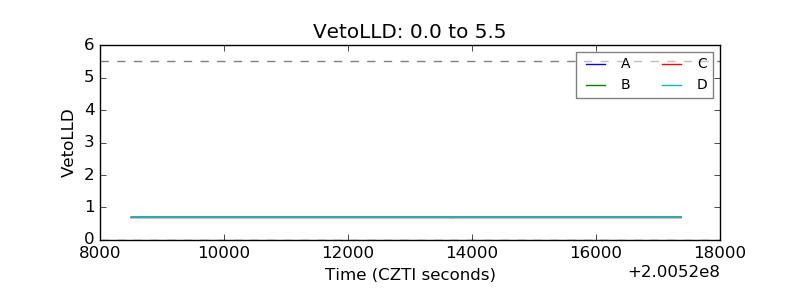 |
| Alpha Counter | 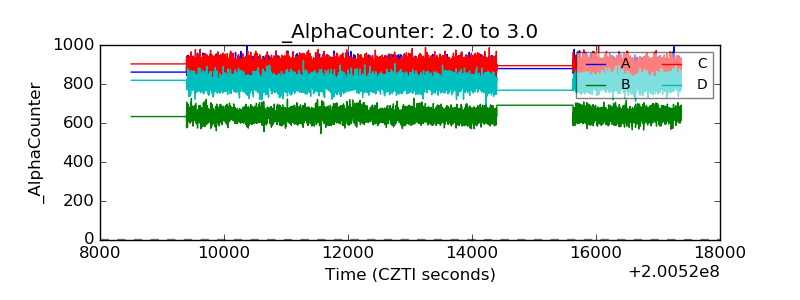 |
| _CPM_Rate | 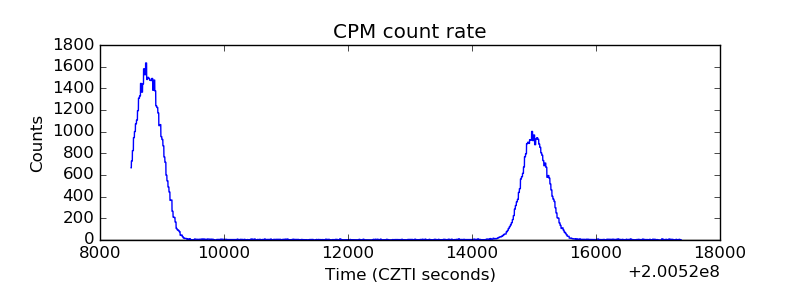 |
| CZT Counter | 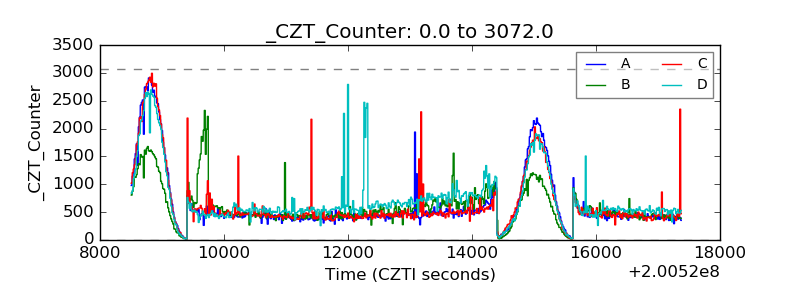 |
| +2.5 Volts monitor |  |
| +5 Volts monitor |  |
| _ROLL_ROT | 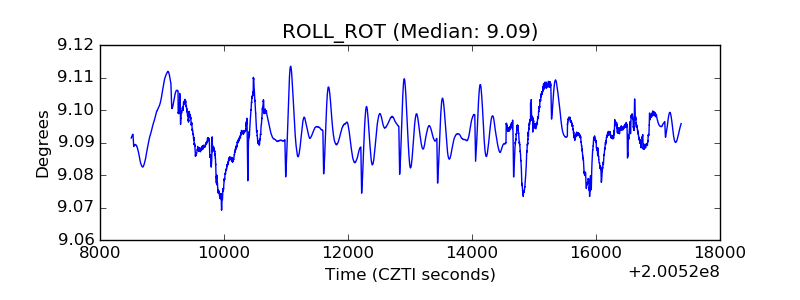 |
| _Roll_DEC | 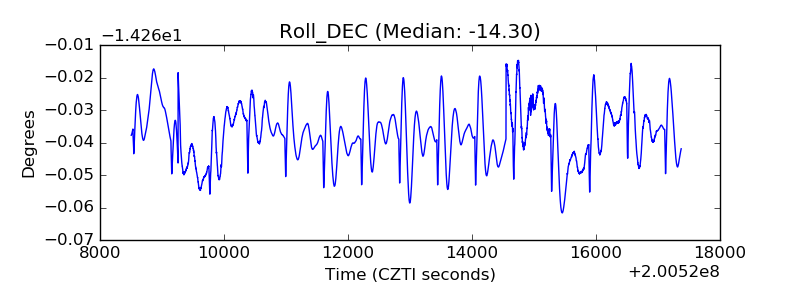 |
| _Roll_RA | 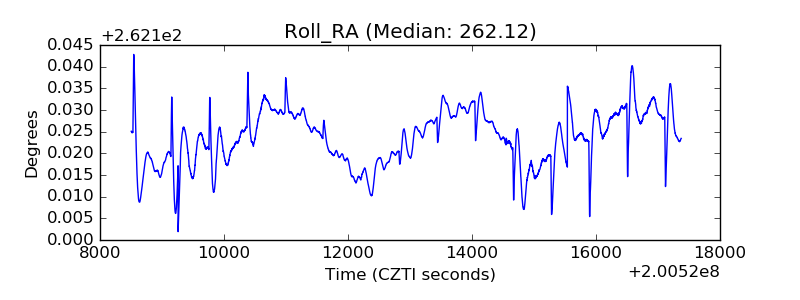 |
| Veto Counter | 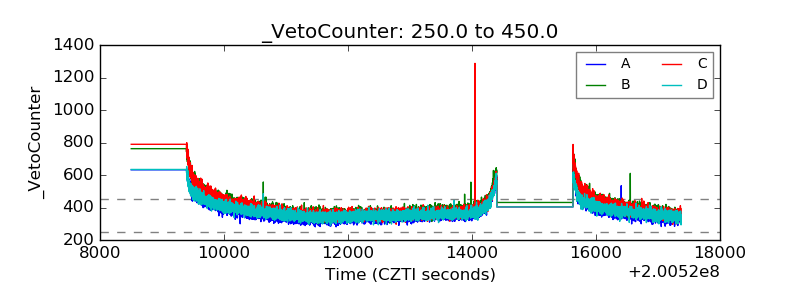 |