| Param | Original file | Final file |
|---|---|---|
| Filename | modeM0/AS1G05_246T01_9000000450_03331cztM0_level2.evt | modeM0/AS1G05_246T01_9000000450_03331cztM0_level2_quad_clean.evt |
| Size (bytes) | 439,142,400 | 76,121,280 |
| Size | 418.8 MB | 72.6 MB |
| Events in quadrant A | 3,034,924 | 459,031 |
| Events in quadrant B | 3,362,523 | 472,409 |
| Events in quadrant C | 3,387,258 | 463,467 |
| Events in quadrant D | 3,062,189 | 446,010 |
| Mode M0 | |||
|---|---|---|---|
| Quadrant | BADHDUFLAG | Total packets | Discarded packets |
| A | 0 | 13713 | 2 |
| B | 0 | 14125 | 1 |
| C | 0 | 14670 | 1 |
| D | 0 | 14095 | 1 |
| Mode SS | |||
|---|---|---|---|
| Quadrant | BADHDUFLAG | Total packets | Discarded packets |
| A | 0 | 136 | 0 |
| B | 0 | 136 | 0 |
| C | 0 | 136 | 0 |
| D | 0 | 136 | 0 |
| Mode M9 | |||
|---|---|---|---|
| Quadrant | BADHDUFLAG | Total packets | Discarded packets |
| A | 0 | 8 | 0 |
| B | 0 | 8 | 0 |
| C | 0 | 8 | 0 |
| D | 0 | 8 | 0 |
| Quadrant | Total seconds | Saturated seconds | Saturation percentage |
|---|---|---|---|
| A | 6652 | 95 | 1.428142% |
| B | 6652 | 99 | 1.488274% |
| C | 6652 | 96 | 1.443175% |
| D | 6652 | 100 | 1.503307% |
Noise dominated data is calculated using 1-second bins in cleaned event files. If a bin has >2000 counts, and if more than 50% of those come from <1% of pixels, then it is considered to be noise-dominated and hence unusable.
| Quadrant | # 1 sec bins | Bins with >0 counts | Bins with >2000 counts | High rate bins dominated by noise | Noise dominated (total time) | Noise dominated (detector-on time) | Marked lightcurve |
|---|---|---|---|---|---|---|---|
| A | 7502 | 6653 | 1 | 1 | 0.01% | 0.02% | 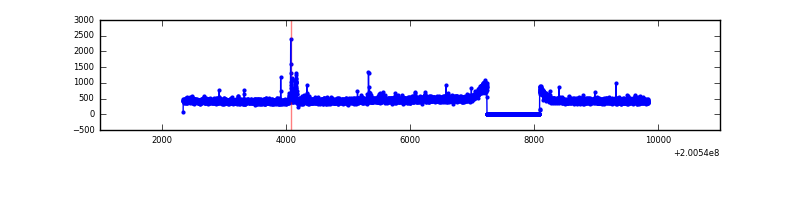 |
| B | 7502 | 6653 | 2 | 2 | 0.03% | 0.03% | 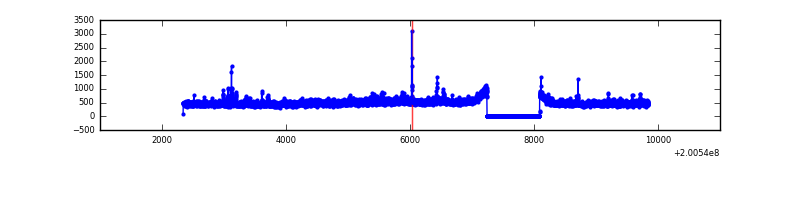 |
| C | 7502 | 6653 | 26 | 26 | 0.35% | 0.39% | 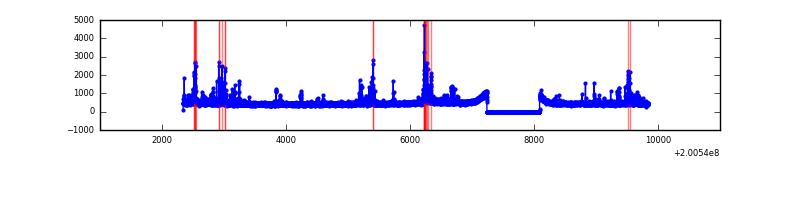 |
| D | 7502 | 6653 | 20 | 20 | 0.27% | 0.30% |  |
Top three noisy pixels from each quadrant. If the there are fewer than three noisy pixels in the level2.evt file, extra rows are filled as -1
| Pixel properties | Quadrant properties | ||||||
|---|---|---|---|---|---|---|---|
| Quadrant | DetID | PixID | Counts | Sigma | Mean | Median | Sigma |
| A | 0 | 50 | 30018 | 184.04 | 771 | 753 | 159.0 |
| A | 7 | 16 | 17598 | 105.93 | 771 | 753 | 159.0 |
| A | 8 | 15 | 13572 | 80.61 | 771 | 753 | 159.0 |
| B | 15 | 204 | 240945 | 1561.54 | 783 | 762 | 153.8 |
| B | 14 | 167 | 51757 | 331.54 | 783 | 762 | 153.8 |
| B | 0 | 229 | 40866 | 260.74 | 783 | 762 | 153.8 |
| C | 14 | 223 | 384666 | 2155.38 | 754 | 758 | 178.1 |
| C | 8 | 208 | 16345 | 87.51 | 754 | 758 | 178.1 |
| C | 6 | 80 | 11519 | 60.42 | 754 | 758 | 178.1 |
| D | 13 | 223 | 116700 | 626.67 | 754 | 733 | 185.1 |
| D | 13 | 174 | 27667 | 145.55 | 754 | 733 | 185.1 |
| D | 13 | 239 | 19048 | 98.97 | 754 | 733 | 185.1 |
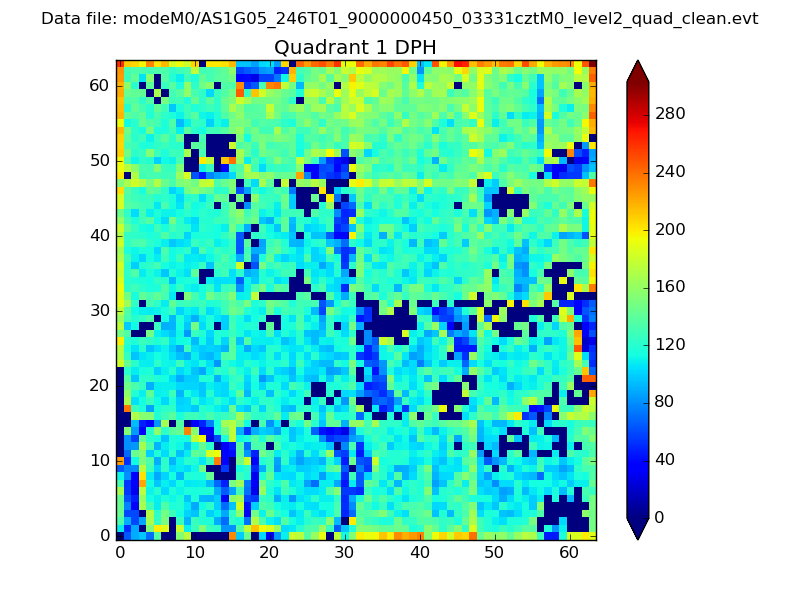
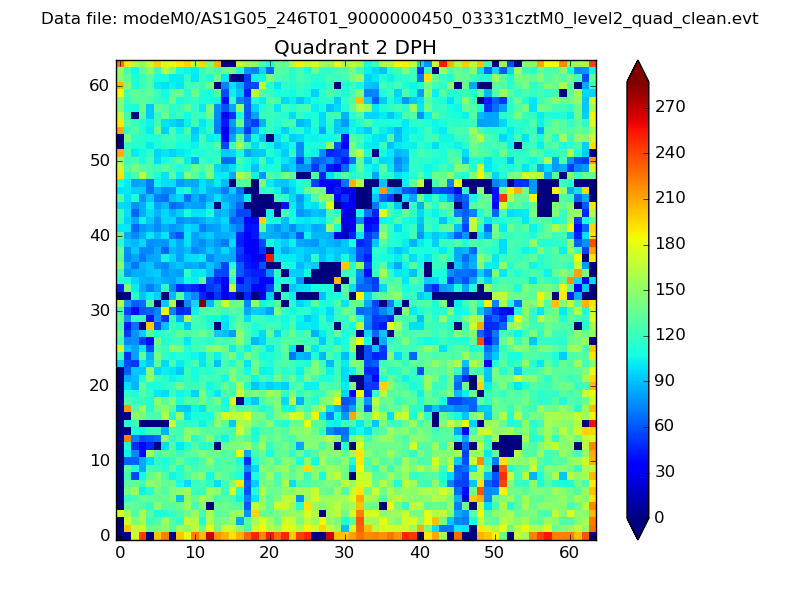
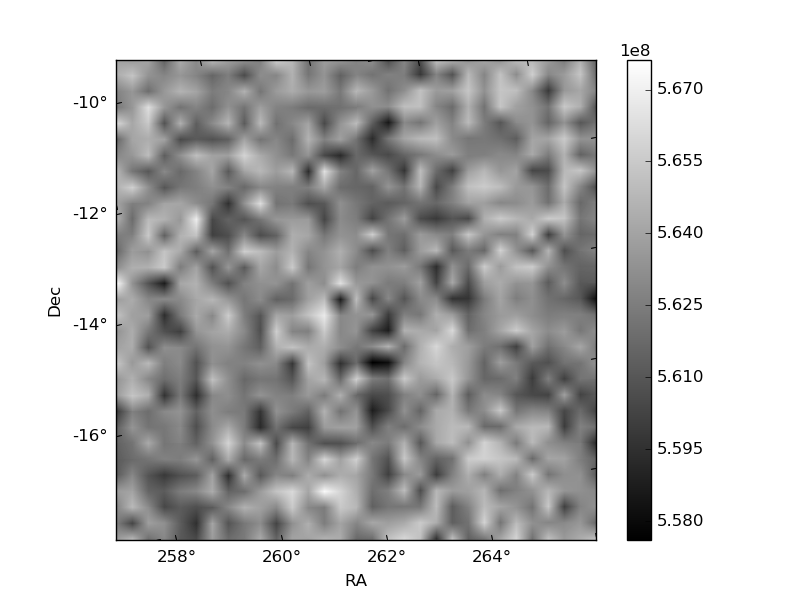
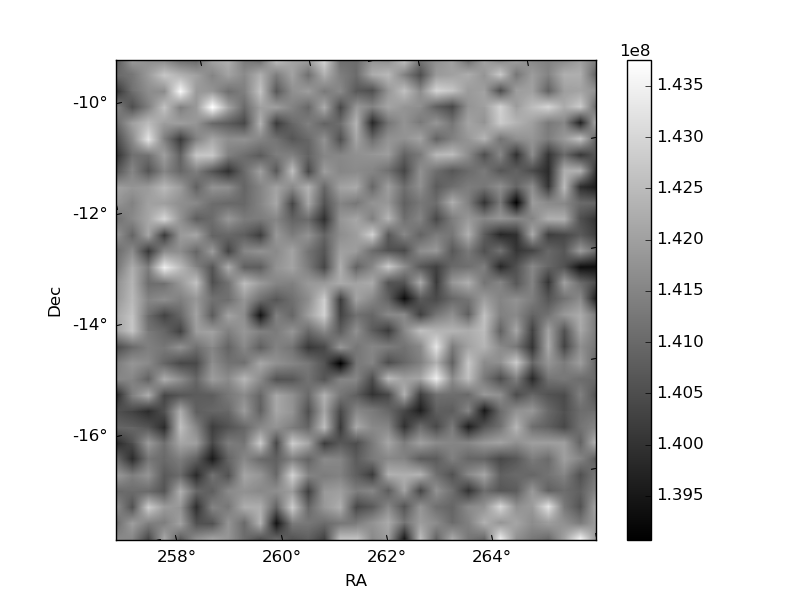
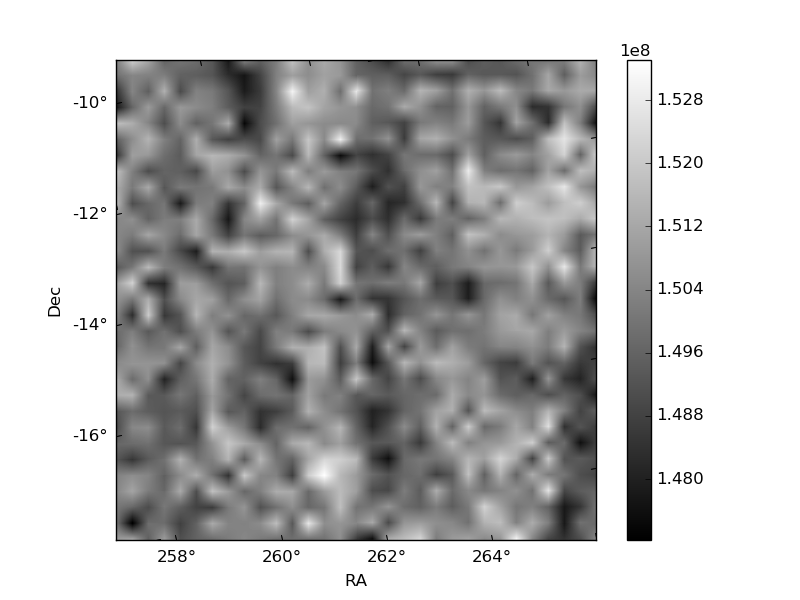
Histogram calculated using DETX and DETY for each event in the final _common_clean file
| Quadrant A | 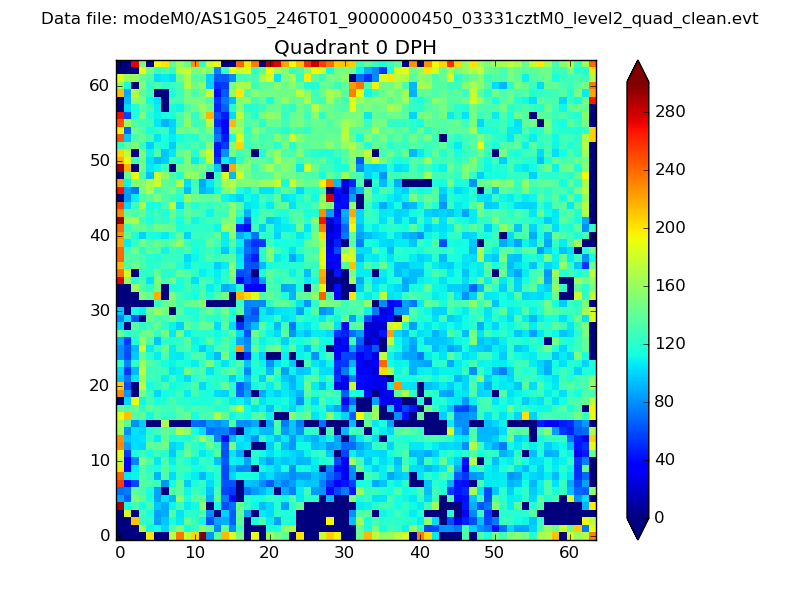 |
 |
Quadrant B |
|---|---|---|---|
| Quadrant D | 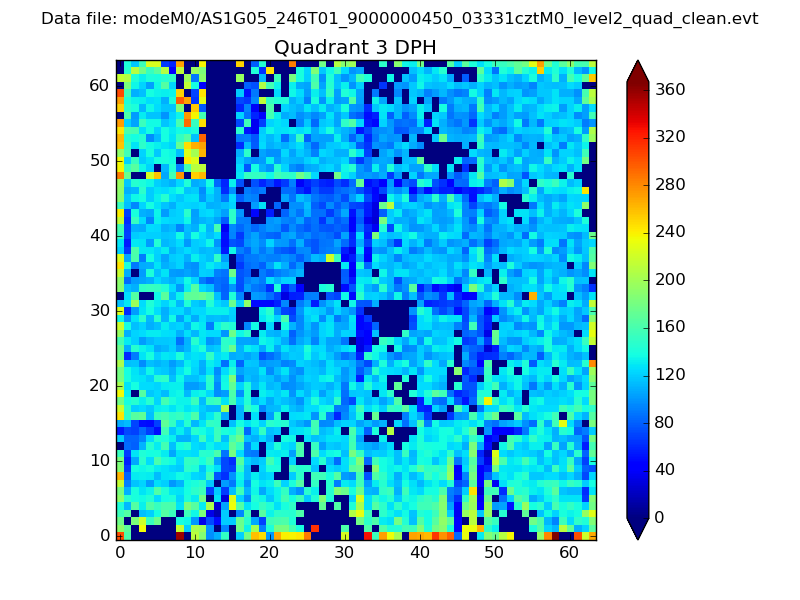 |
 |
Quadrant C |
| Plot type | Count rate plots | Images |
|---|---|---|
| Comparison with Poisson distribution Blue bars denote a histogram of data divided into 1 sec bins. Red curve is a Poisson curve with rate = median count rate of data. |
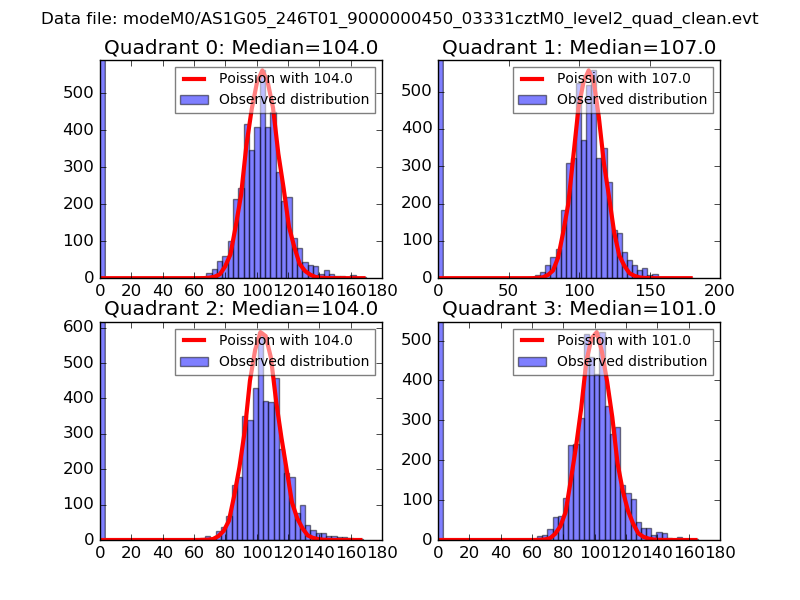 |
 |
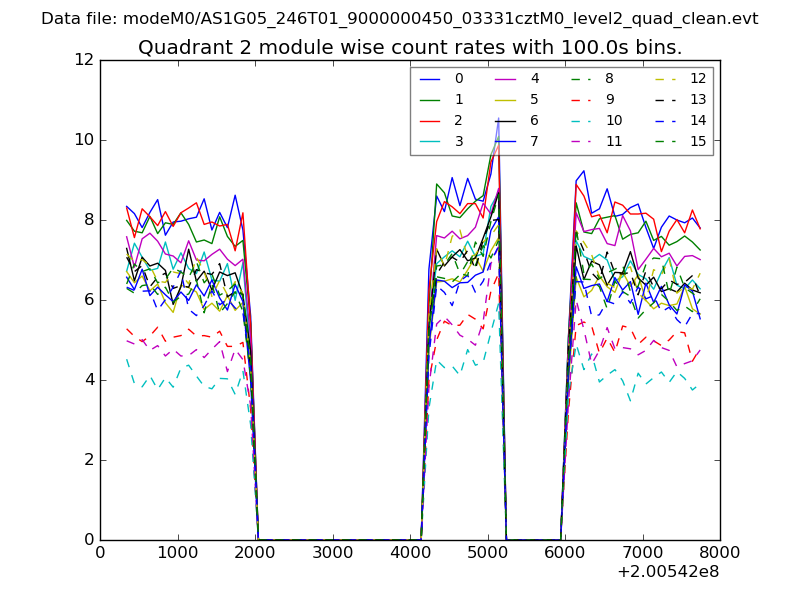
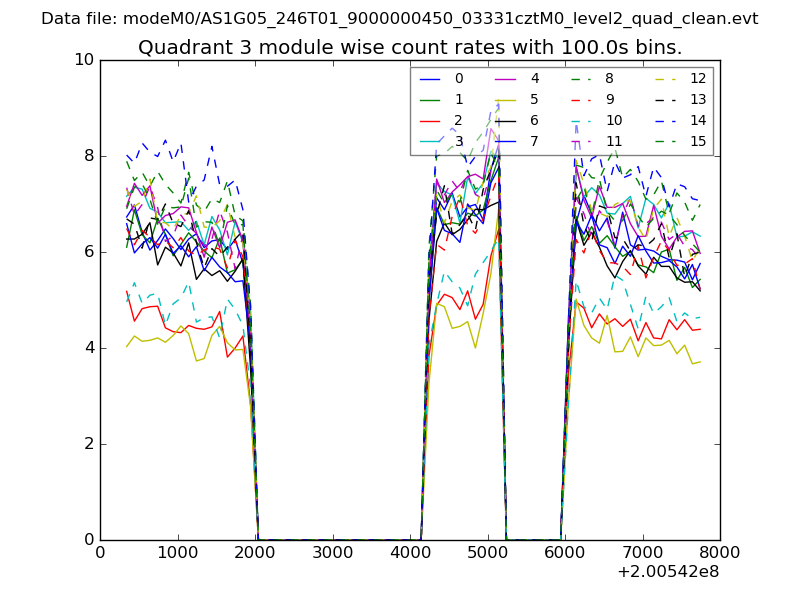
| Quadrant-wise count rates Data is divided into 100 sec bins |
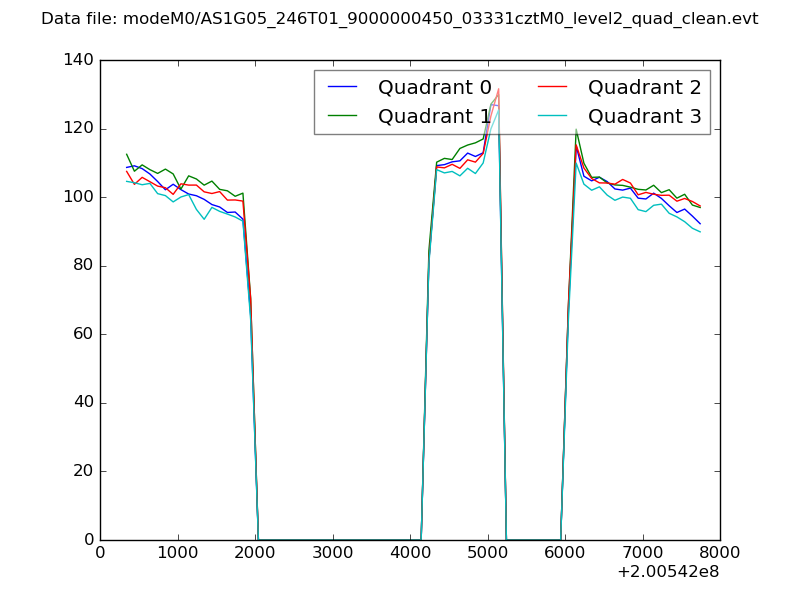 |
|
| Module-wise count rates for Quadrant A Data is divided into 100 sec bins |
 |
 |
| Module-wise count rates for Quadrant B Data is divided into 100 sec bins |
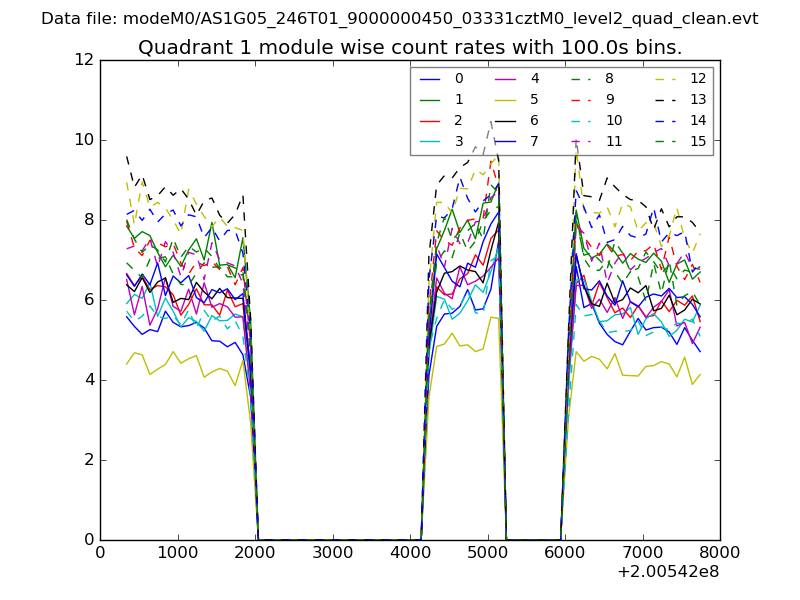 |
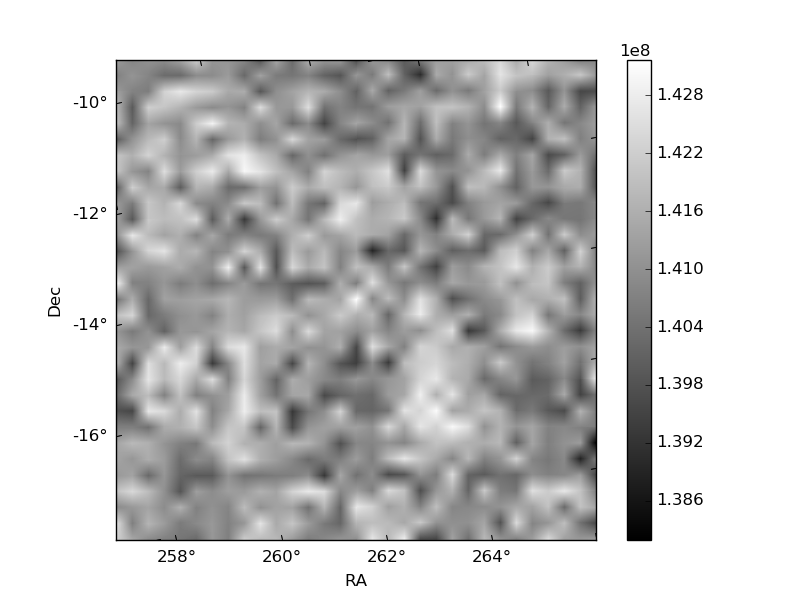 |
| Module-wise count rates for Quadrant C Data is divided into 100 sec bins |
 |
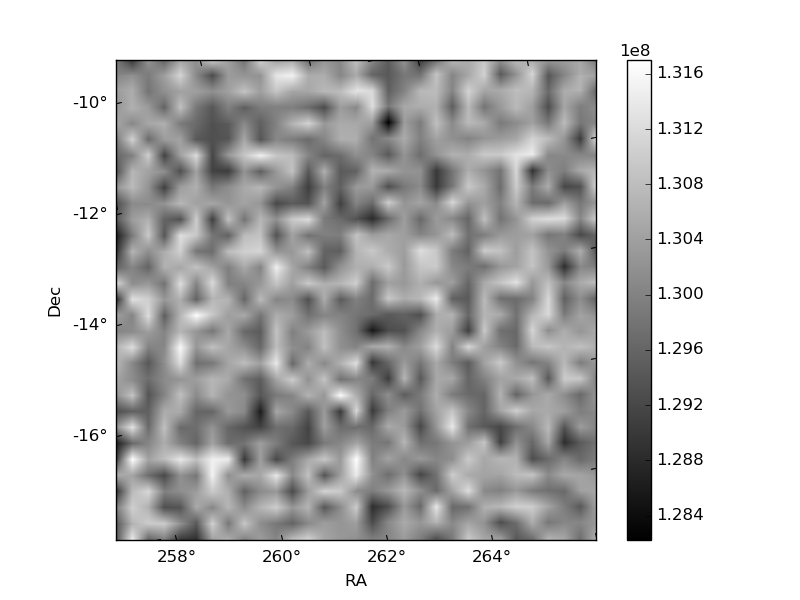 |
| Module-wise count rates for Quadrant D Data is divided into 100 sec bins |
 |
 |
| Parameter | Plot |
|---|---|
| CZT HV Monitor | 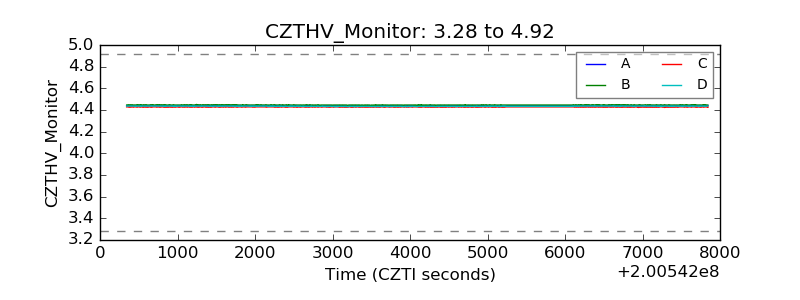 |
| D_VDD | 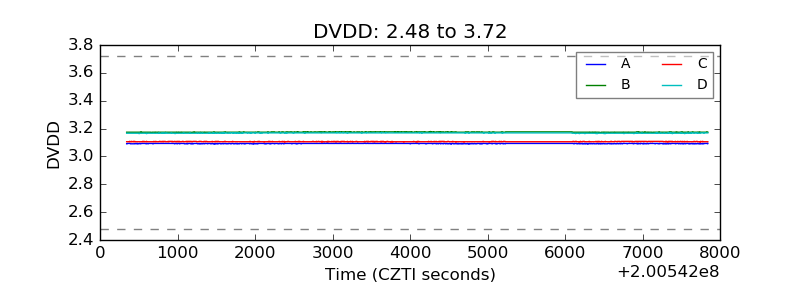 |
| Temperature 1 | 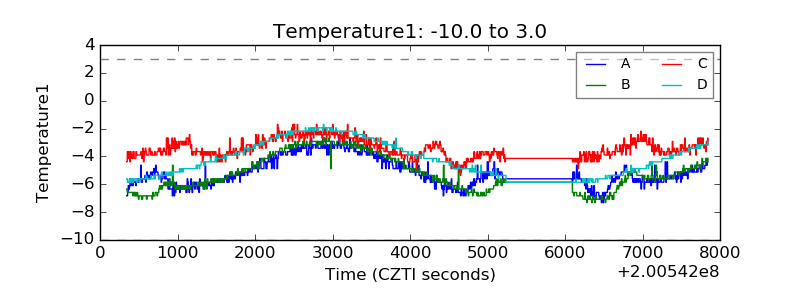 |
| Veto HV Monitor | 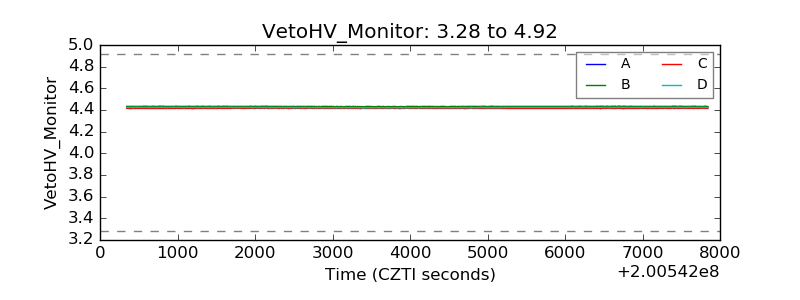 |
| Veto LLD | 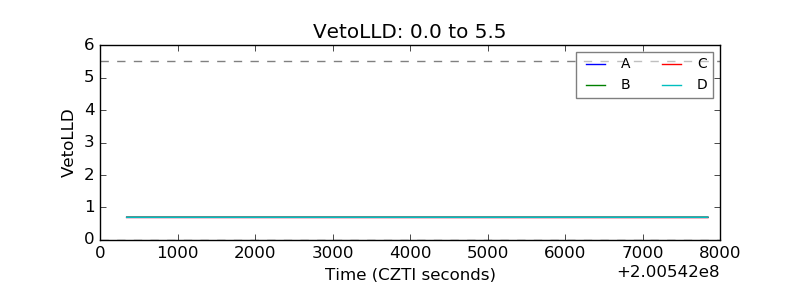 |
| Alpha Counter | 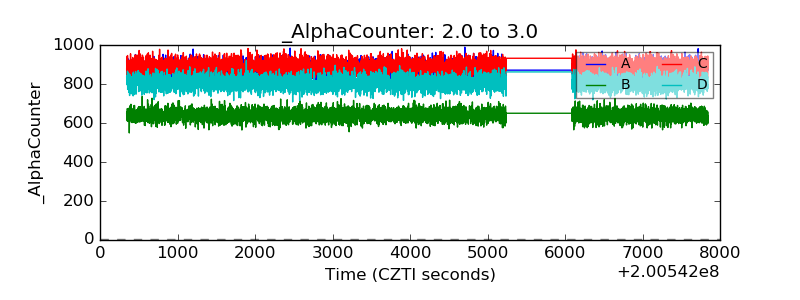 |
| _CPM_Rate | 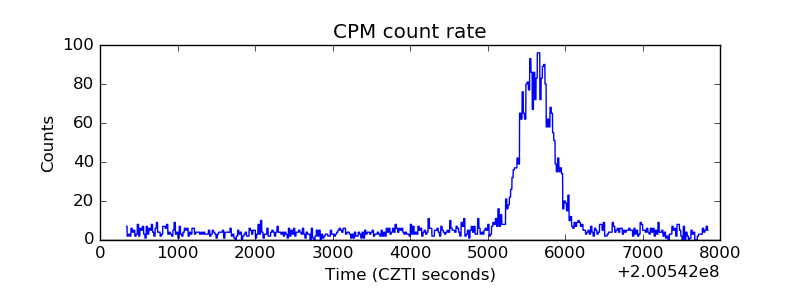 |
| CZT Counter | 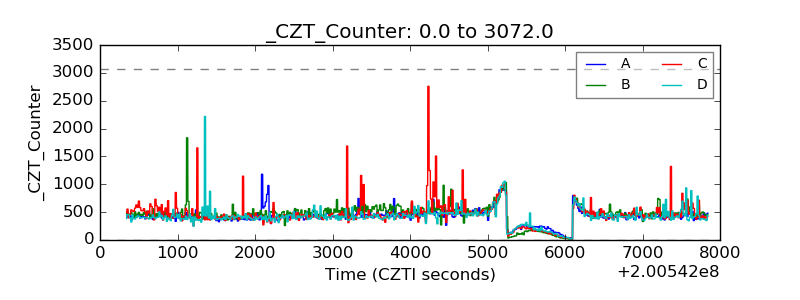 |
| +2.5 Volts monitor |  |
| +5 Volts monitor |  |
| _ROLL_ROT | 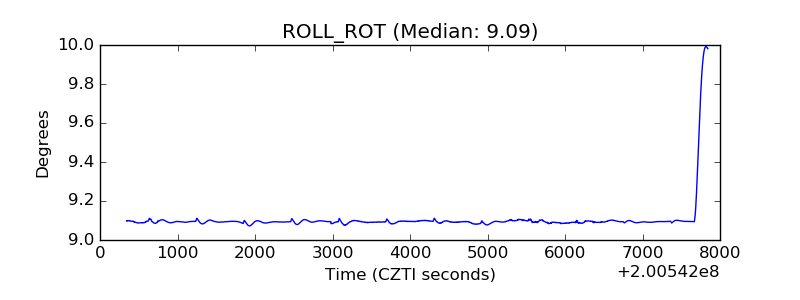 |
| _Roll_DEC | 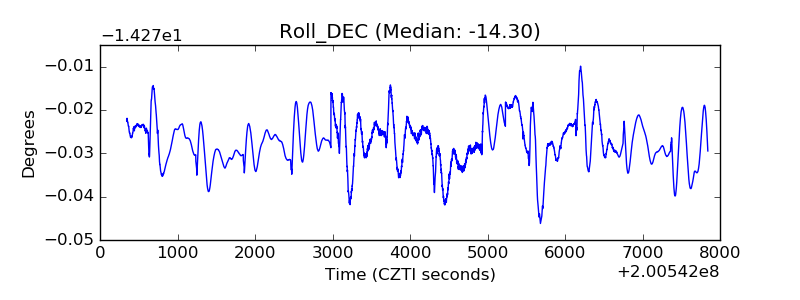 |
| _Roll_RA | 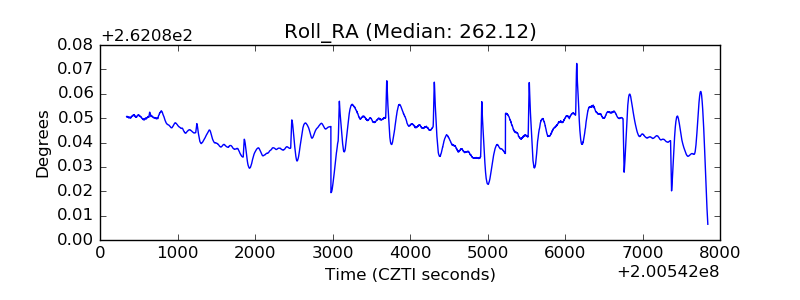 |
| Veto Counter | 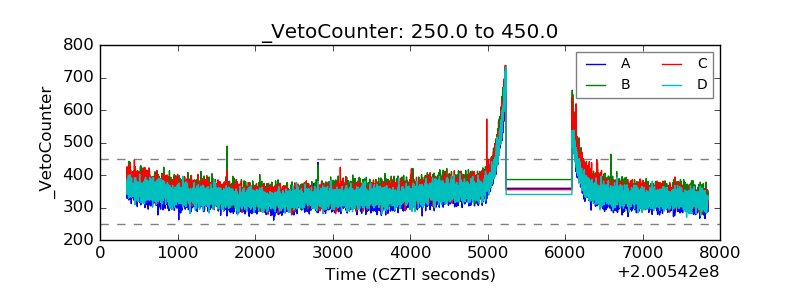 |