| Param | Original file | Final file |
|---|---|---|
| Filename | modeM0/AS1G05_246T01_9000000450_03332cztM0_level2.evt | modeM0/AS1G05_246T01_9000000450_03332cztM0_level2_quad_clean.evt |
| Size (bytes) | 557,648,640 | 83,384,640 |
| Size | 531.8 MB | 79.5 MB |
| Events in quadrant A | 3,413,768 | 502,692 |
| Events in quadrant B | 4,140,244 | 514,989 |
| Events in quadrant C | 4,714,893 | 489,206 |
| Events in quadrant D | 4,104,882 | 490,312 |
| Mode M0 | |||
|---|---|---|---|
| Quadrant | BADHDUFLAG | Total packets | Discarded packets |
| A | 0 | 15561 | 2 |
| B | 0 | 16930 | 1 |
| C | 0 | 19258 | 1 |
| D | 0 | 17807 | 1 |
| Mode SS | |||
|---|---|---|---|
| Quadrant | BADHDUFLAG | Total packets | Discarded packets |
| A | 0 | 152 | 0 |
| B | 0 | 152 | 0 |
| C | 0 | 152 | 0 |
| D | 0 | 152 | 0 |
| Mode M9 | |||
|---|---|---|---|
| Quadrant | BADHDUFLAG | Total packets | Discarded packets |
| A | 0 | 4 | 0 |
| B | 0 | 4 | 0 |
| C | 0 | 4 | 0 |
| D | 0 | 4 | 0 |
| Quadrant | Total seconds | Saturated seconds | Saturation percentage |
|---|---|---|---|
| A | 7583 | 216 | 2.848477% |
| B | 7583 | 312 | 4.114467% |
| C | 7583 | 495 | 6.527759% |
| D | 7583 | 264 | 3.481472% |
Noise dominated data is calculated using 1-second bins in cleaned event files. If a bin has >2000 counts, and if more than 50% of those come from <1% of pixels, then it is considered to be noise-dominated and hence unusable.
| Quadrant | # 1 sec bins | Bins with >0 counts | Bins with >2000 counts | High rate bins dominated by noise | Noise dominated (total time) | Noise dominated (detector-on time) | Marked lightcurve |
|---|---|---|---|---|---|---|---|
| A | 7943 | 7584 | 0 | 0 | 0.00% | 0.00% | 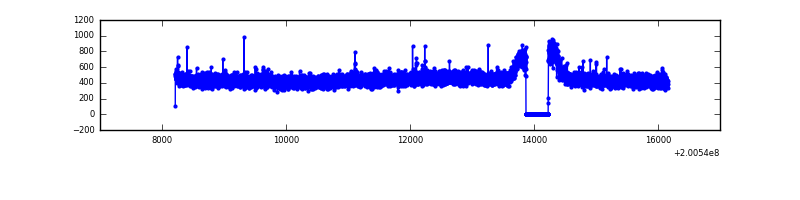 |
| B | 7943 | 7584 | 74 | 74 | 0.93% | 0.98% |  |
| C | 7943 | 7584 | 260 | 260 | 3.27% | 3.43% |  |
| D | 7943 | 7584 | 83 | 83 | 1.04% | 1.09% |  |
Top three noisy pixels from each quadrant. If the there are fewer than three noisy pixels in the level2.evt file, extra rows are filled as -1
| Pixel properties | Quadrant properties | ||||||
|---|---|---|---|---|---|---|---|
| Quadrant | DetID | PixID | Counts | Sigma | Mean | Median | Sigma |
| A | 8 | 15 | 23637 | 125.89 | 875 | 852 | 181.0 |
| A | 13 | 14 | 11004 | 56.09 | 875 | 852 | 181.0 |
| A | 0 | 226 | 9475 | 47.64 | 875 | 852 | 181.0 |
| B | 15 | 204 | 387481 | 2229.76 | 885 | 862 | 173.4 |
| B | 6 | 203 | 159284 | 913.67 | 885 | 862 | 173.4 |
| B | 14 | 167 | 136503 | 782.29 | 885 | 862 | 173.4 |
| C | 9 | 144 | 803216 | 4094.39 | 839 | 841 | 196.0 |
| C | 1 | 192 | 449770 | 2290.81 | 839 | 841 | 196.0 |
| C | 14 | 223 | 99313 | 502.49 | 839 | 841 | 196.0 |
| D | 12 | 246 | 650869 | 3104.1 | 854 | 828 | 209.4 |
| D | 13 | 223 | 121148 | 574.56 | 854 | 828 | 209.4 |
| D | 2 | 216 | 40072 | 187.4 | 854 | 828 | 209.4 |
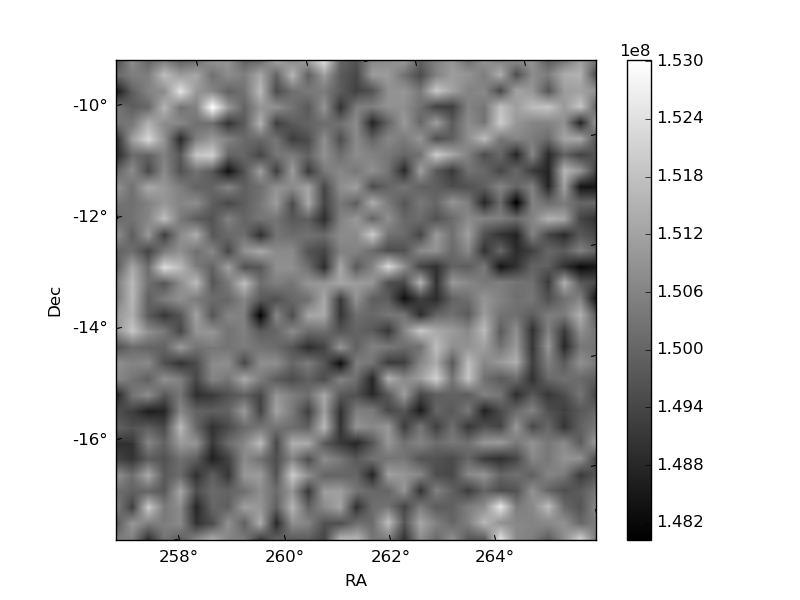
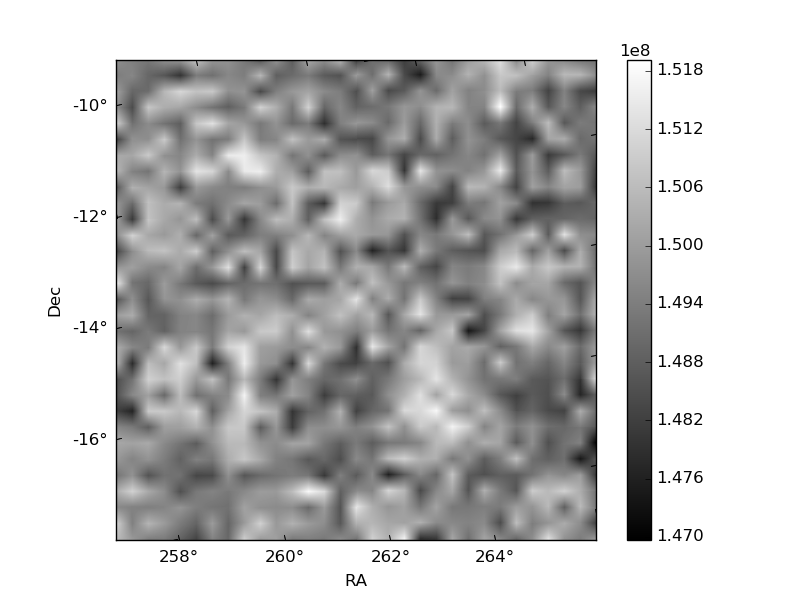
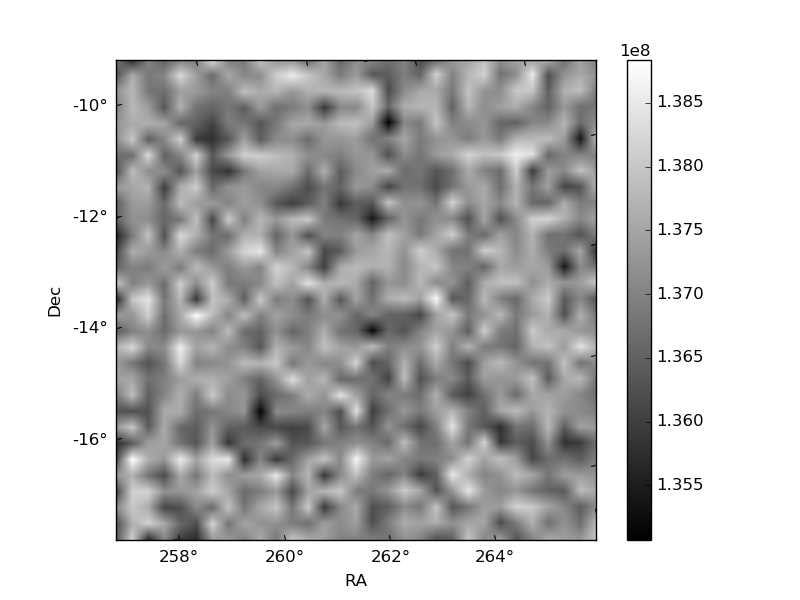
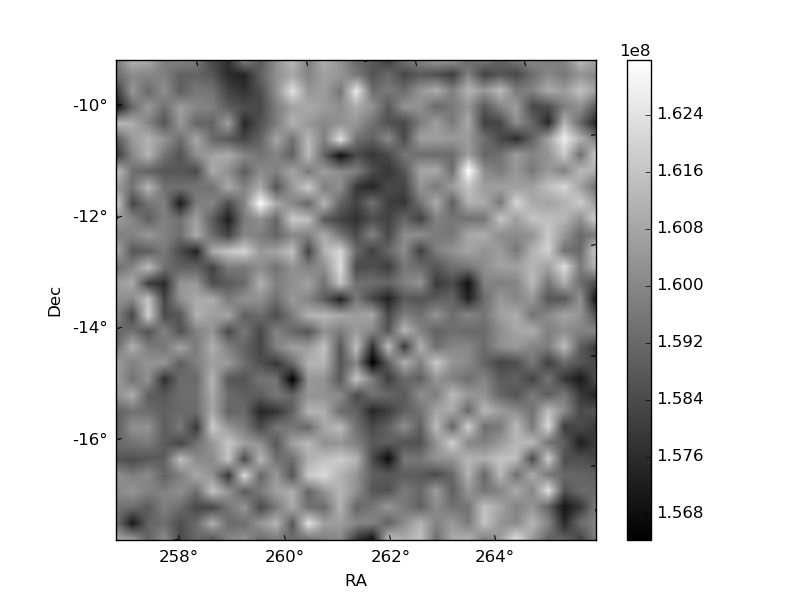
Histogram calculated using DETX and DETY for each event in the final _common_clean file
| Quadrant A | 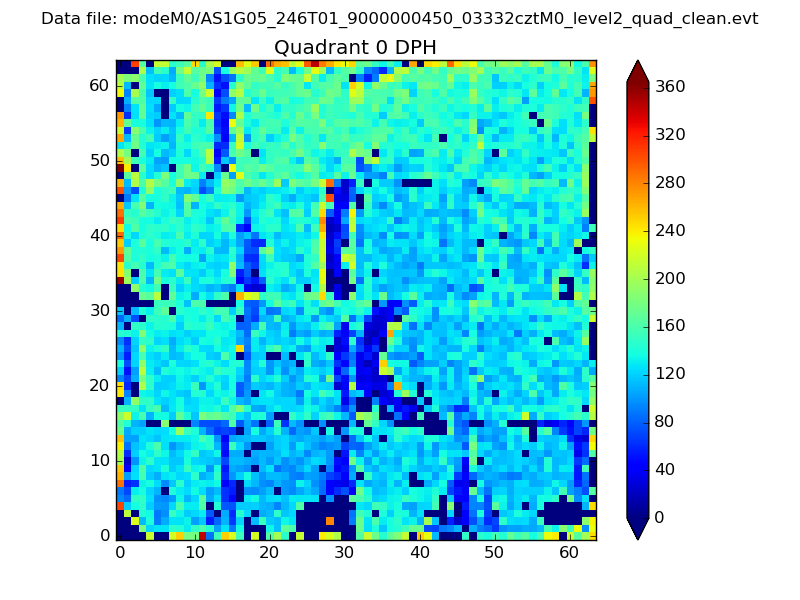 |
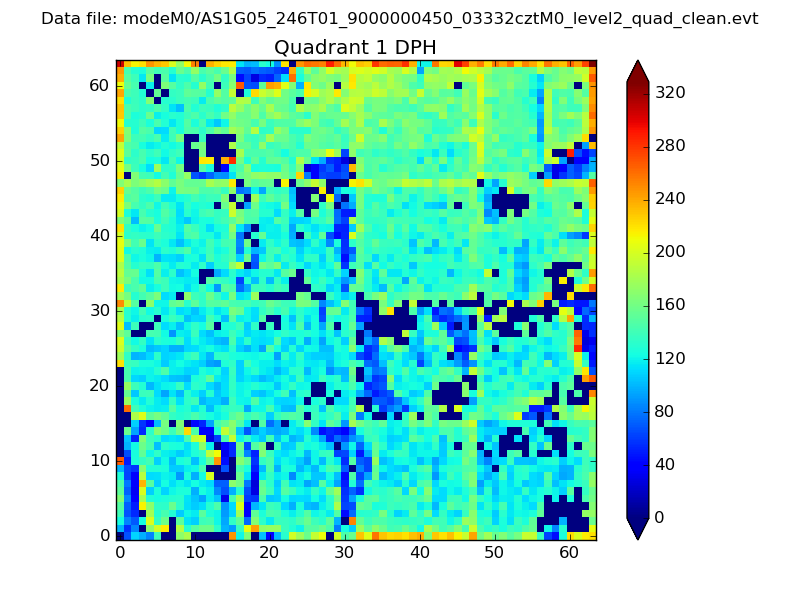 |
Quadrant B |
|---|---|---|---|
| Quadrant D | 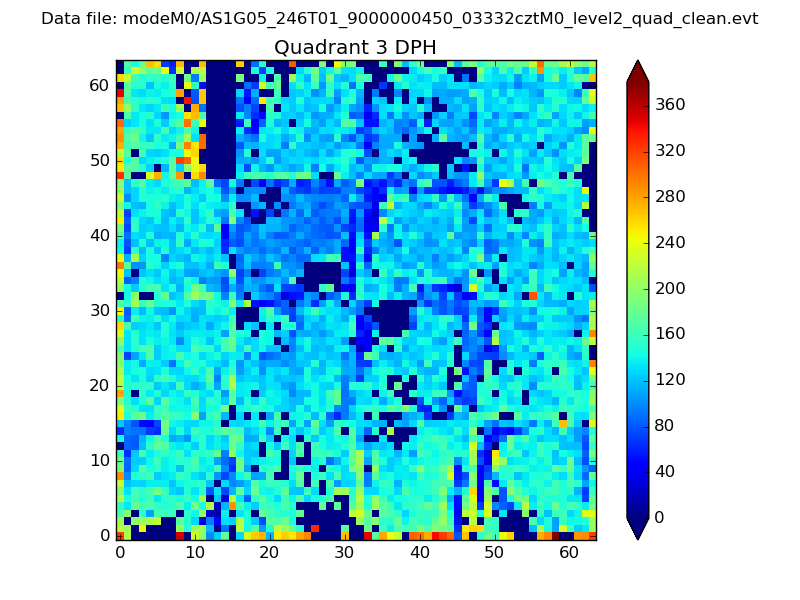 |
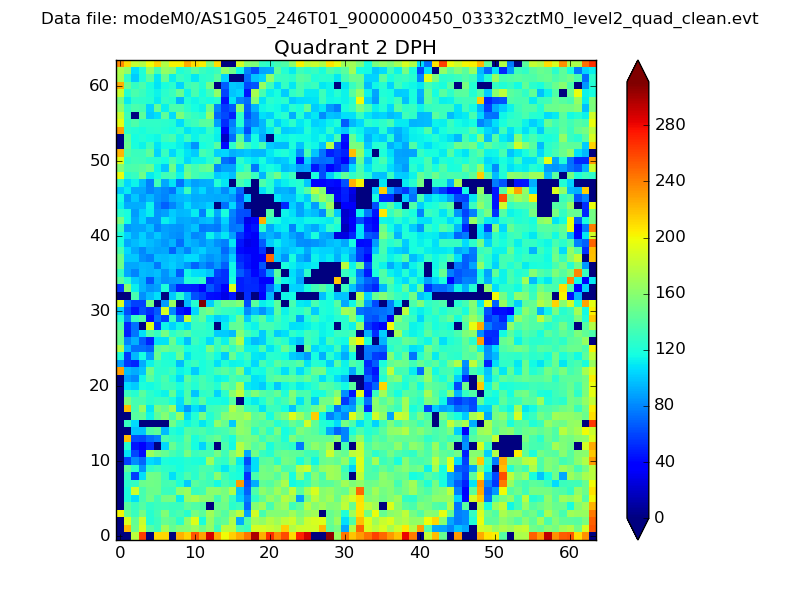 |
Quadrant C |
| Plot type | Count rate plots | Images |
|---|---|---|
| Comparison with Poisson distribution Blue bars denote a histogram of data divided into 1 sec bins. Red curve is a Poisson curve with rate = median count rate of data. |
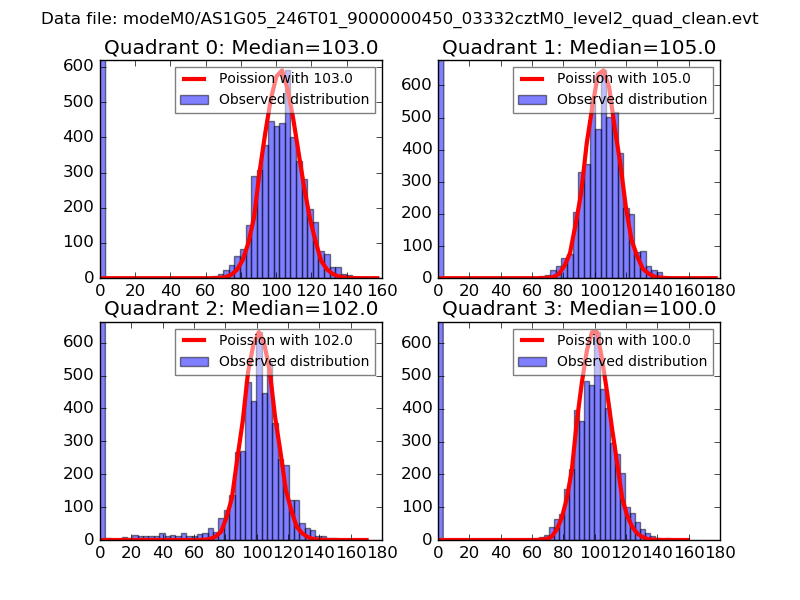 |
 |
| Quadrant-wise count rates Data is divided into 100 sec bins |
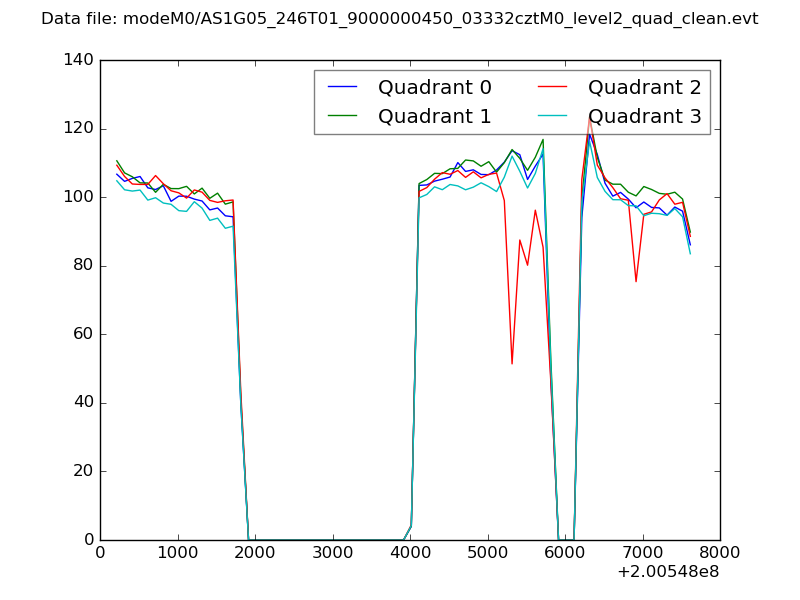 |
|
| Module-wise count rates for Quadrant A Data is divided into 100 sec bins |
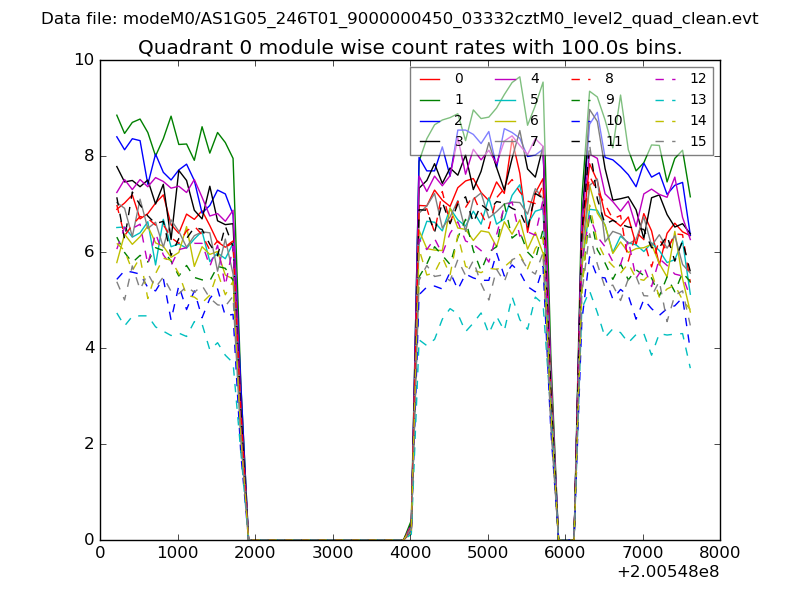 |
 |
| Module-wise count rates for Quadrant B Data is divided into 100 sec bins |
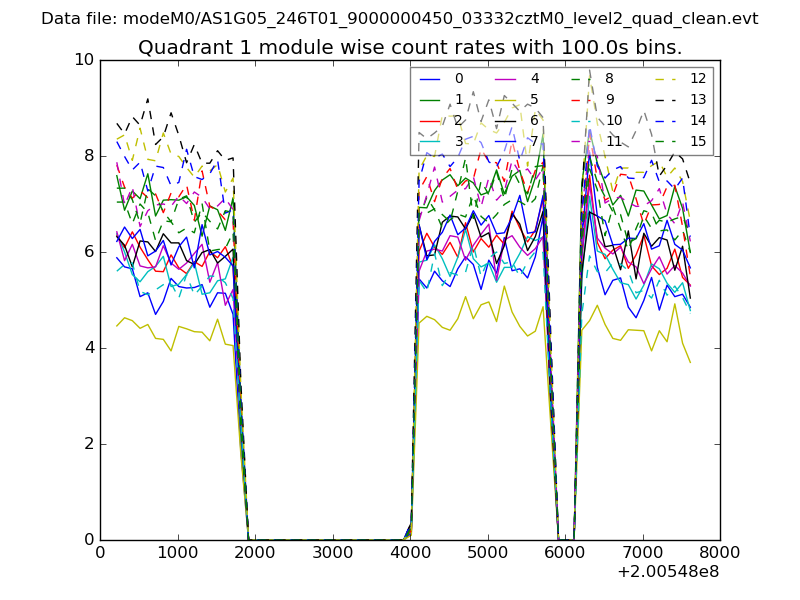 |
 |
| Module-wise count rates for Quadrant C Data is divided into 100 sec bins |
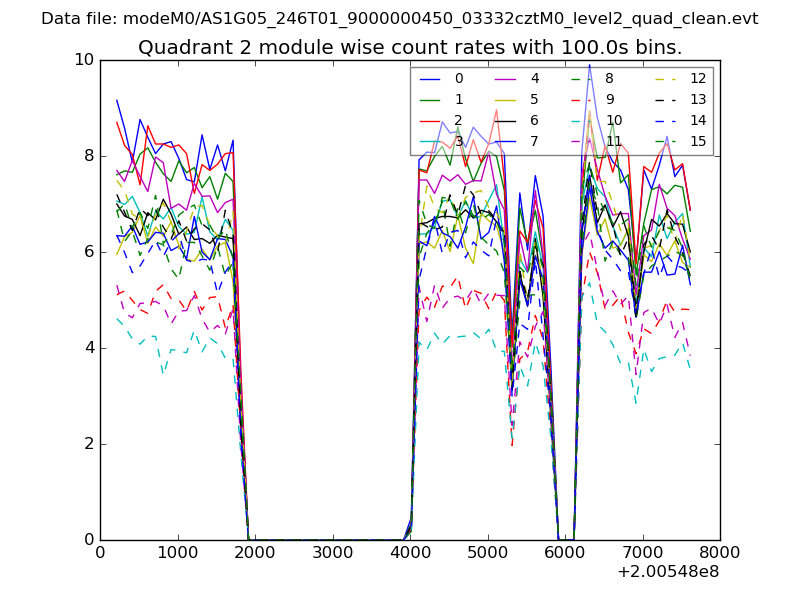 |
 |
| Module-wise count rates for Quadrant D Data is divided into 100 sec bins |
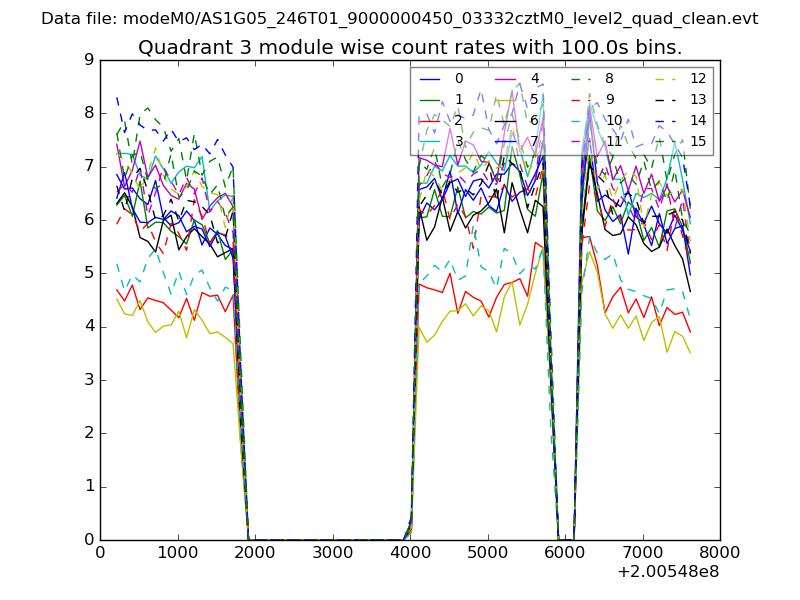 |
 |
| Parameter | Plot |
|---|---|
| CZT HV Monitor | 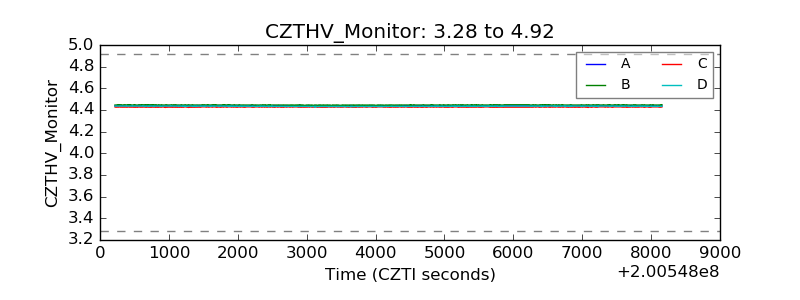 |
| D_VDD | 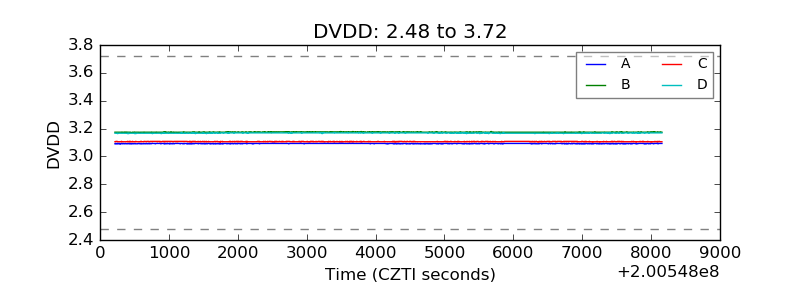 |
| Temperature 1 | 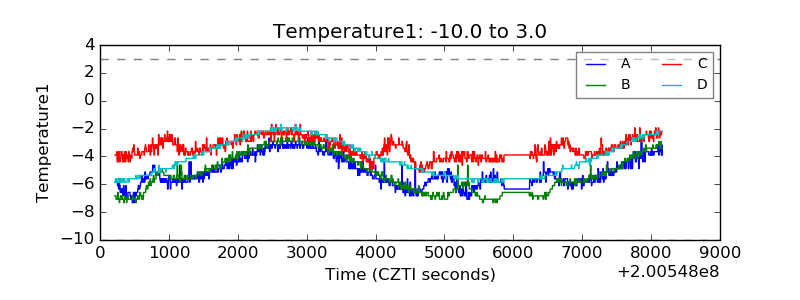 |
| Veto HV Monitor | 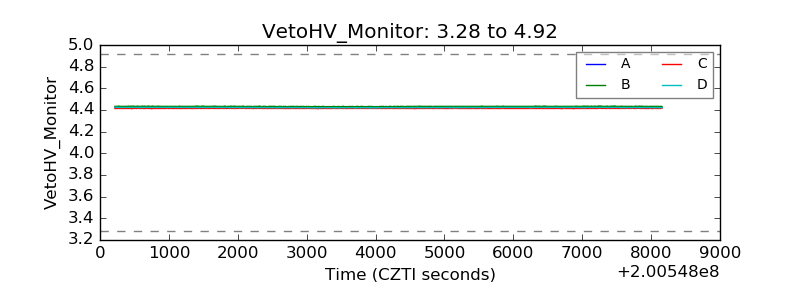 |
| Veto LLD | 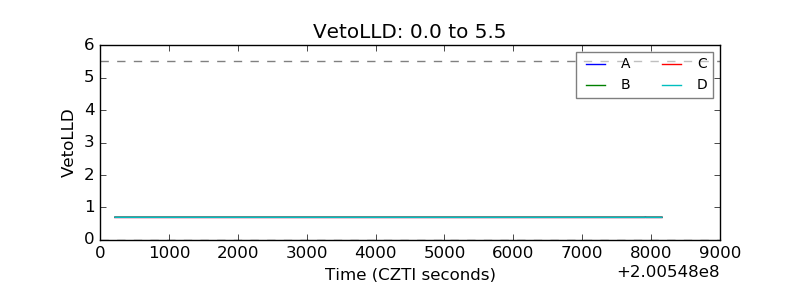 |
| Alpha Counter | 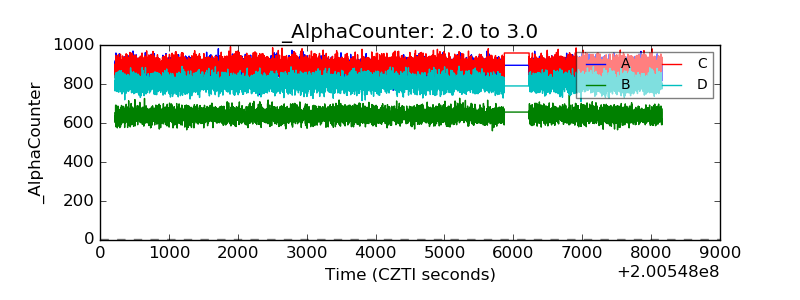 |
| _CPM_Rate | 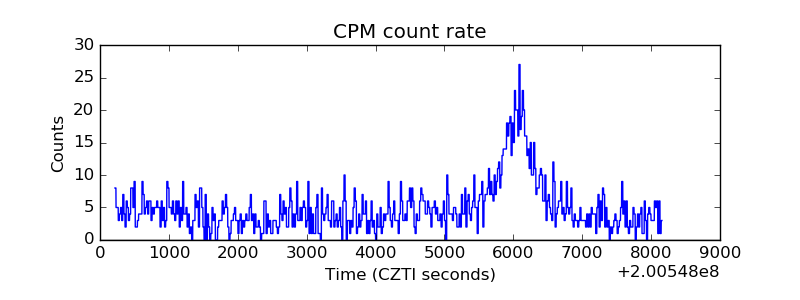 |
| CZT Counter | 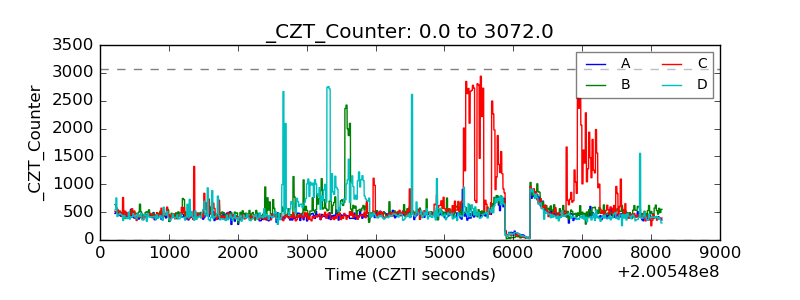 |
| +2.5 Volts monitor |  |
| +5 Volts monitor |  |
| _ROLL_ROT | 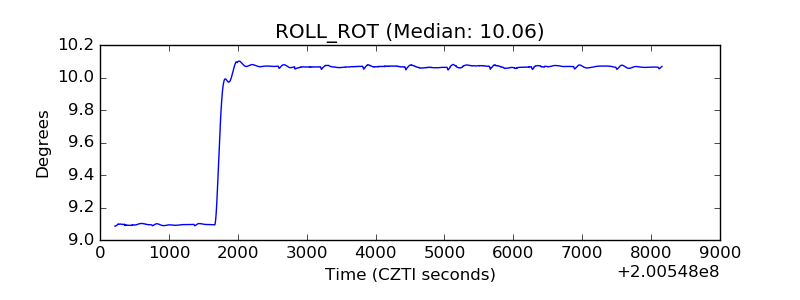 |
| _Roll_DEC | 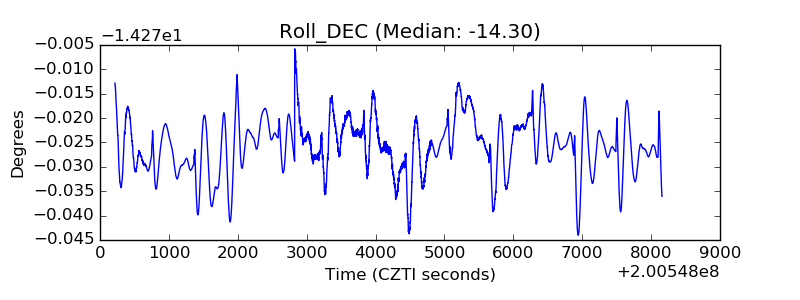 |
| _Roll_RA | 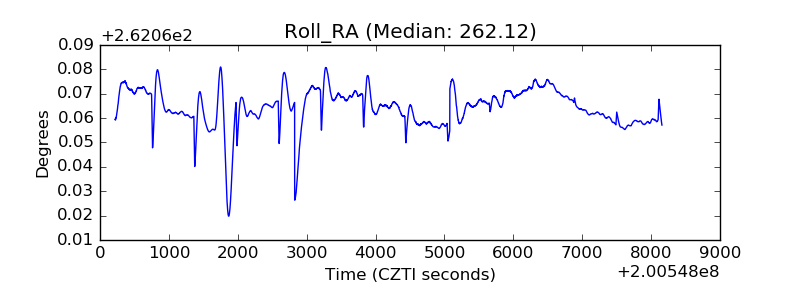 |
| Veto Counter | 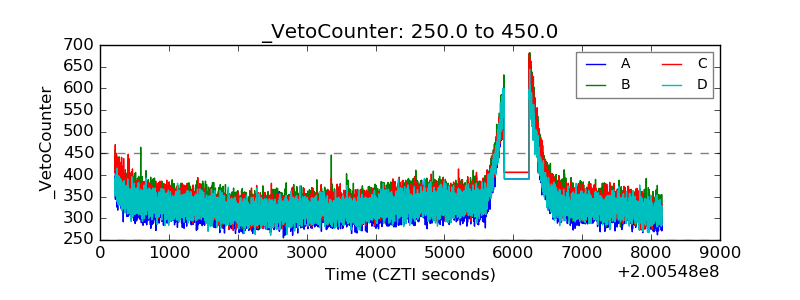 |