| Param | Original file | Final file |
|---|---|---|
| Filename | modeM0/AS1G05_246T01_9000000450_03333cztM0_level2.evt | modeM0/AS1G05_246T01_9000000450_03333cztM0_level2_quad_clean.evt |
| Size (bytes) | 489,530,880 | 73,287,360 |
| Size | 466.9 MB | 69.9 MB |
| Events in quadrant A | 3,313,573 | 426,871 |
| Events in quadrant B | 3,988,459 | 438,746 |
| Events in quadrant C | 3,538,560 | 434,759 |
| Events in quadrant D | 3,495,353 | 416,858 |
| Mode M0 | |||
|---|---|---|---|
| Quadrant | BADHDUFLAG | Total packets | Discarded packets |
| A | 0 | 15011 | 1 |
| B | 0 | 16412 | 0 |
| C | 0 | 15565 | 0 |
| D | 0 | 15814 | 0 |
| Mode SS | |||
|---|---|---|---|
| Quadrant | BADHDUFLAG | Total packets | Discarded packets |
| A | 0 | 144 | 0 |
| B | 0 | 144 | 0 |
| C | 0 | 144 | 0 |
| D | 0 | 144 | 0 |
| Quadrant | Total seconds | Saturated seconds | Saturation percentage |
|---|---|---|---|
| A | 7201 | 272 | 3.777253% |
| B | 7201 | 243 | 3.374531% |
| C | 7201 | 144 | 1.999722% |
| D | 7201 | 239 | 3.318983% |
Noise dominated data is calculated using 1-second bins in cleaned event files. If a bin has >2000 counts, and if more than 50% of those come from <1% of pixels, then it is considered to be noise-dominated and hence unusable.
| Quadrant | # 1 sec bins | Bins with >0 counts | Bins with >2000 counts | High rate bins dominated by noise | Noise dominated (total time) | Noise dominated (detector-on time) | Marked lightcurve |
|---|---|---|---|---|---|---|---|
| A | 7201 | 7201 | 1 | 1 | 0.01% | 0.01% | 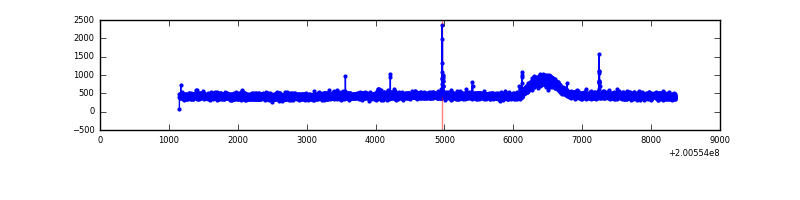 |
| B | 7201 | 7201 | 0 | 0 | 0.00% | 0.00% | 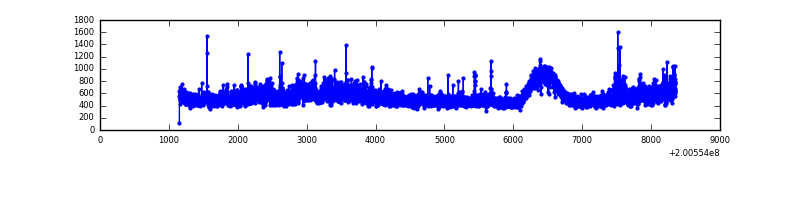 |
| C | 7201 | 7201 | 14 | 14 | 0.19% | 0.19% | 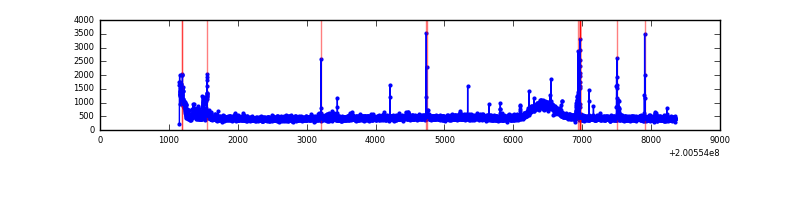 |
| D | 7201 | 7201 | 43 | 43 | 0.60% | 0.60% | 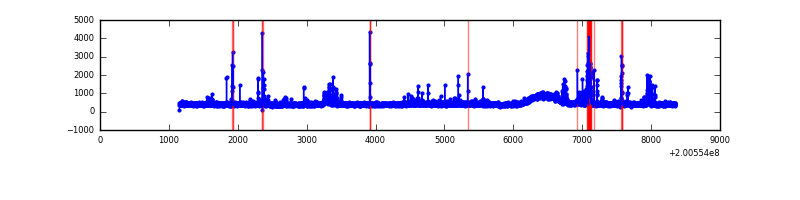 |
Top three noisy pixels from each quadrant. If the there are fewer than three noisy pixels in the level2.evt file, extra rows are filled as -1
| Pixel properties | Quadrant properties | ||||||
|---|---|---|---|---|---|---|---|
| Quadrant | DetID | PixID | Counts | Sigma | Mean | Median | Sigma |
| A | 13 | 14 | 22400 | 122.01 | 848 | 828 | 176.8 |
| A | 0 | 50 | 16908 | 90.95 | 848 | 828 | 176.8 |
| A | 0 | 226 | 9349 | 48.19 | 848 | 828 | 176.8 |
| B | 15 | 204 | 553156 | 3241.33 | 861 | 838 | 170.4 |
| B | 4 | 81 | 30477 | 173.94 | 861 | 838 | 170.4 |
| B | 0 | 229 | 27988 | 159.33 | 861 | 838 | 170.4 |
| C | 1 | 192 | 120270 | 610.13 | 829 | 832 | 195.8 |
| C | 9 | 144 | 41472 | 207.6 | 829 | 832 | 195.8 |
| C | 8 | 208 | 39786 | 198.99 | 829 | 832 | 195.8 |
| D | 13 | 223 | 181988 | 882.9 | 830 | 801 | 205.2 |
| D | 2 | 216 | 72708 | 350.39 | 830 | 801 | 205.2 |
| D | 9 | 85 | 29436 | 139.53 | 830 | 801 | 205.2 |
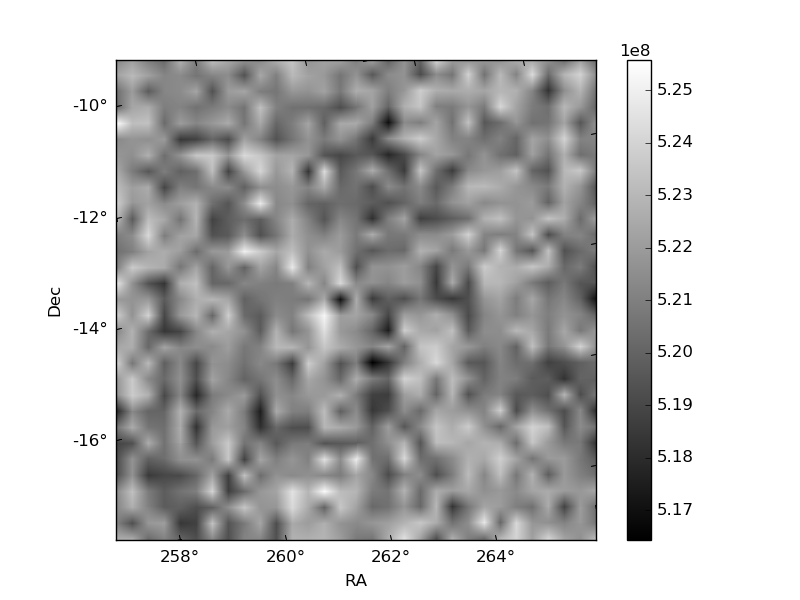
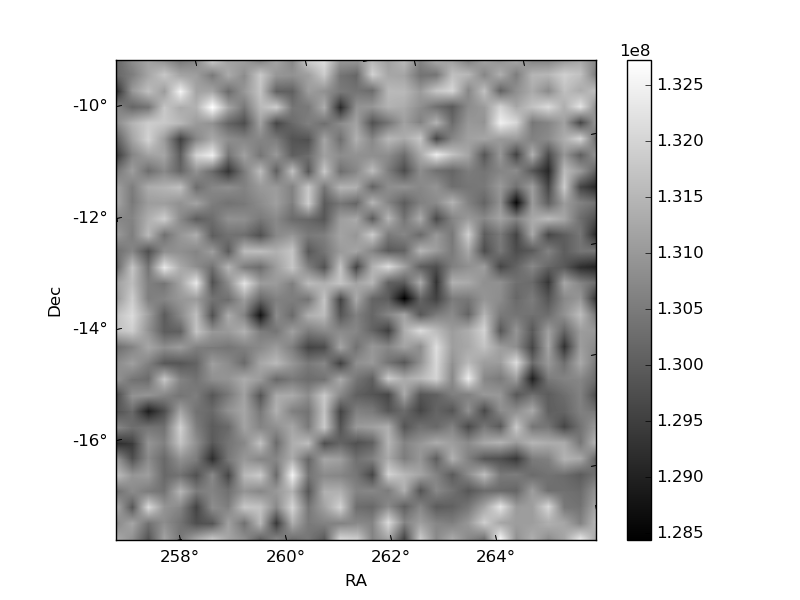
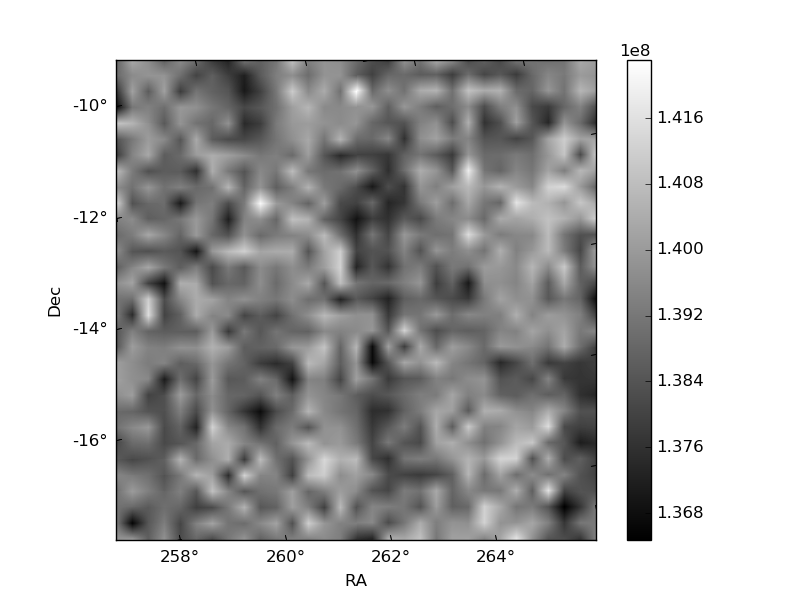
Histogram calculated using DETX and DETY for each event in the final _common_clean file
| Quadrant A | 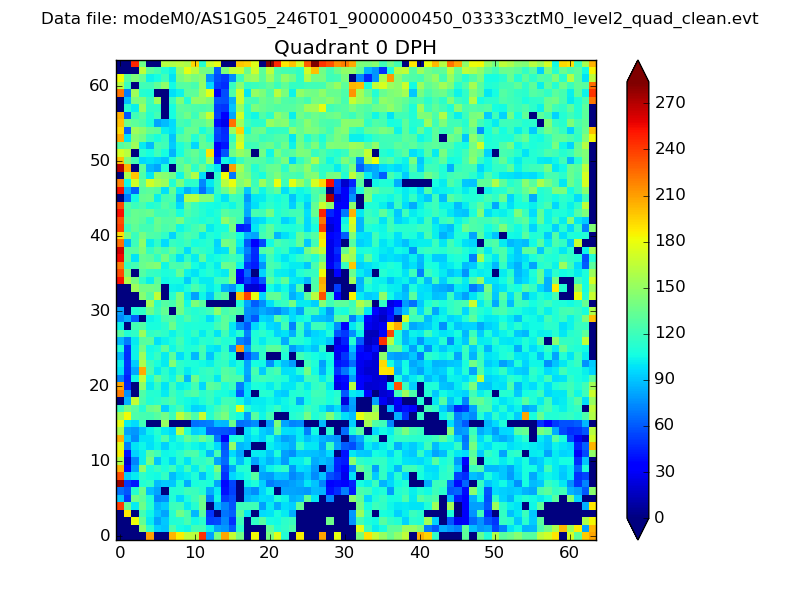 |
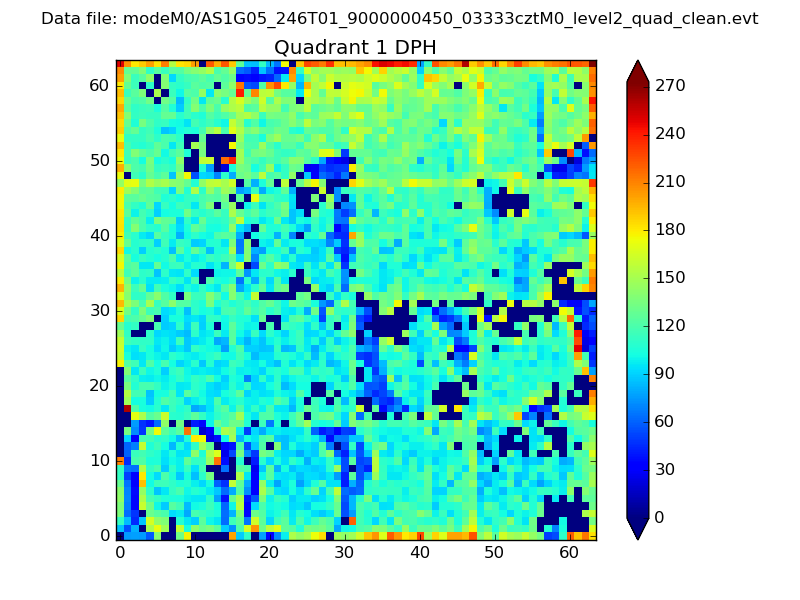 |
Quadrant B |
|---|---|---|---|
| Quadrant D | 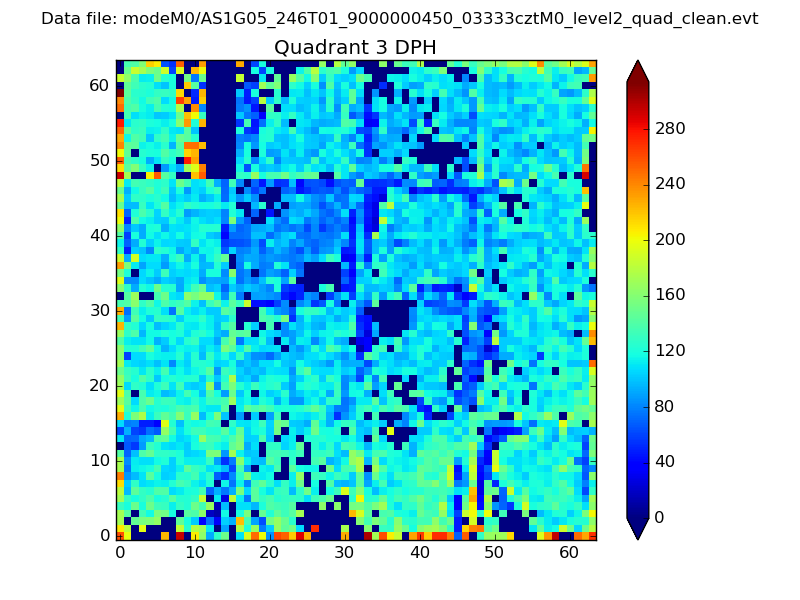 |
 |
Quadrant C |
| Plot type | Count rate plots | Images |
|---|---|---|
| Comparison with Poisson distribution Blue bars denote a histogram of data divided into 1 sec bins. Red curve is a Poisson curve with rate = median count rate of data. |
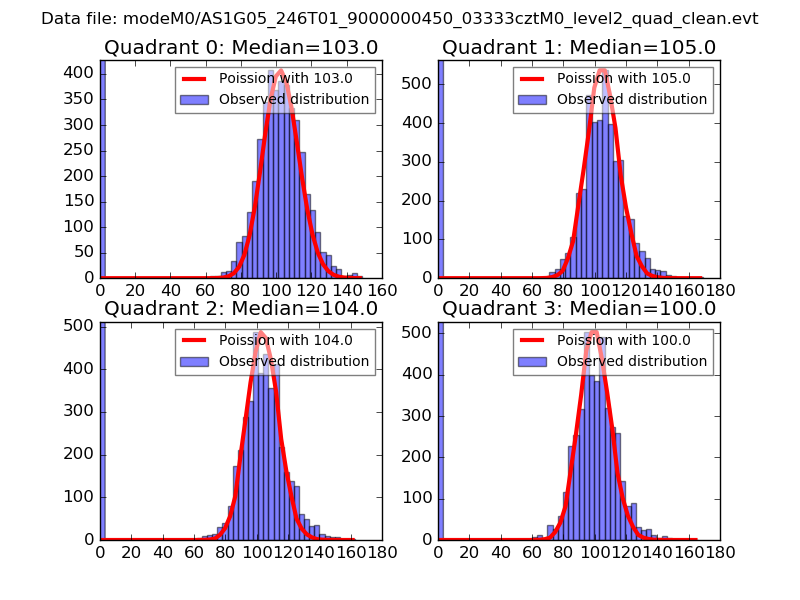 |
 |
| Quadrant-wise count rates Data is divided into 100 sec bins |
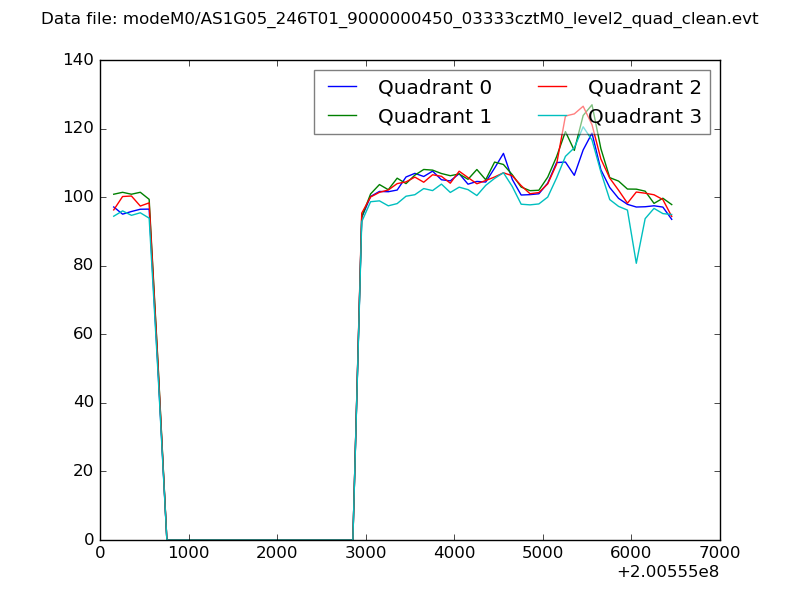 |
|
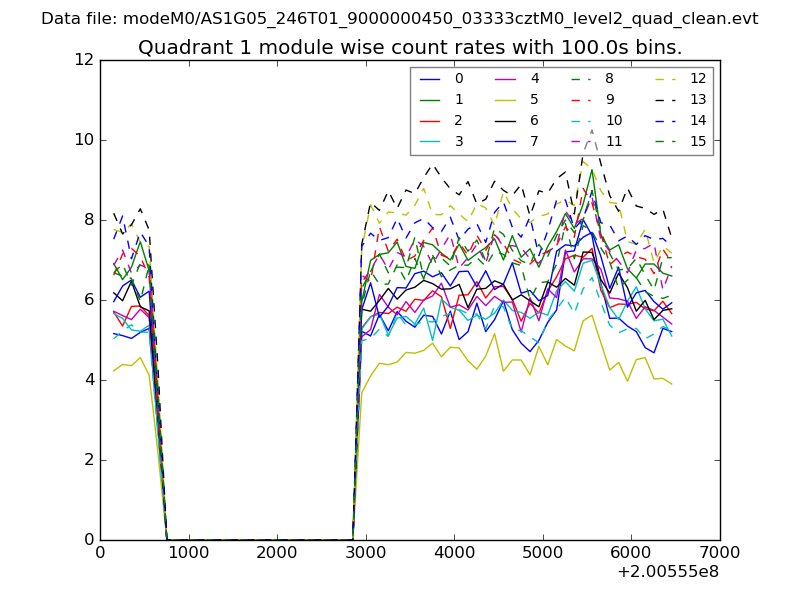
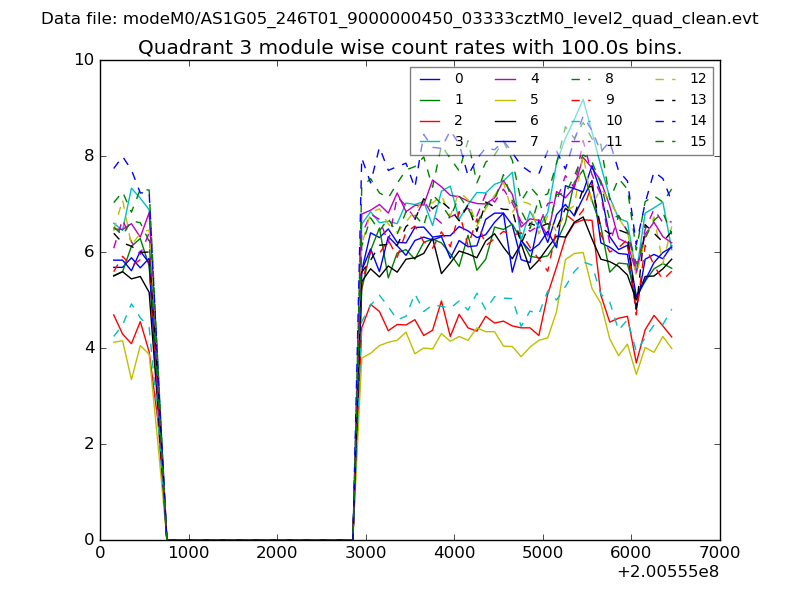
| Module-wise count rates for Quadrant A Data is divided into 100 sec bins |
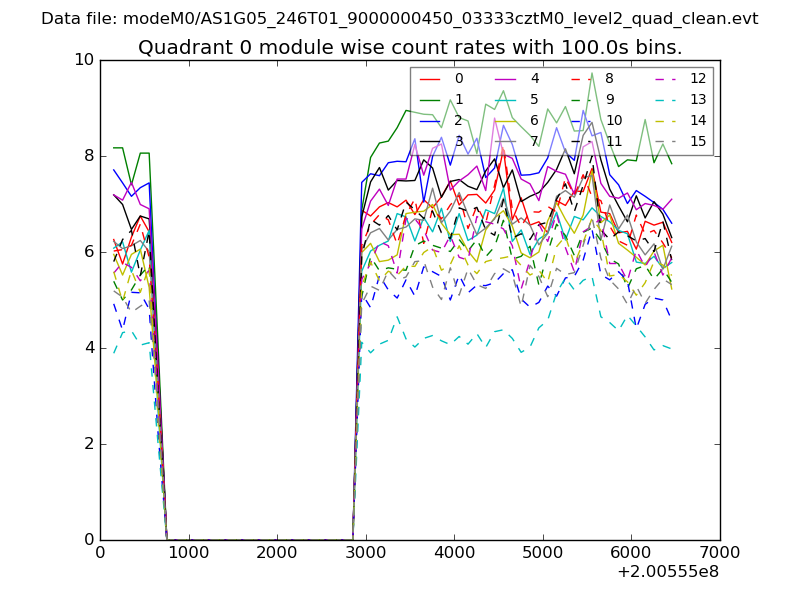 |
 |
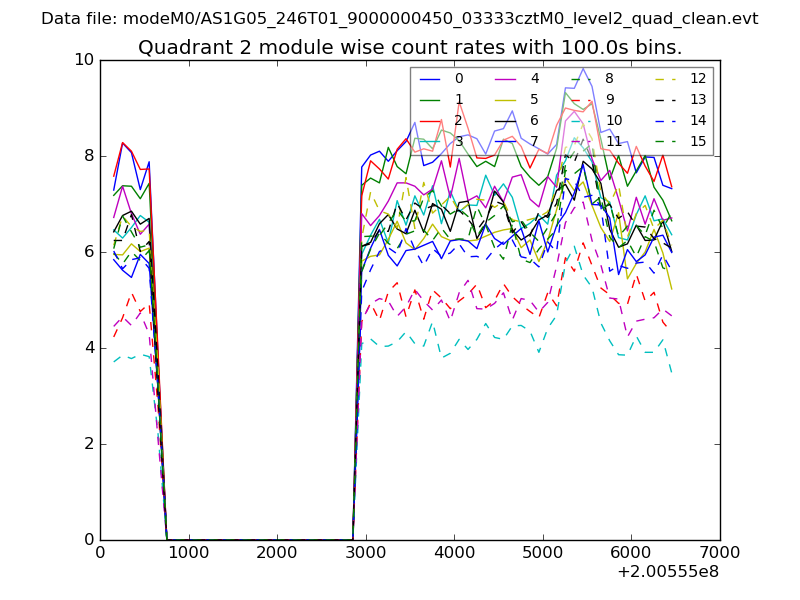
| Module-wise count rates for Quadrant B Data is divided into 100 sec bins |
 |
 |
| Module-wise count rates for Quadrant C Data is divided into 100 sec bins |
 |
 |
| Module-wise count rates for Quadrant D Data is divided into 100 sec bins |
 |
 |
| Parameter | Plot |
|---|---|
| CZT HV Monitor | 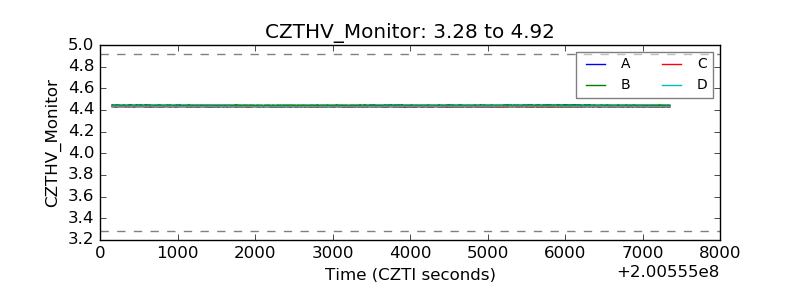 |
| D_VDD | 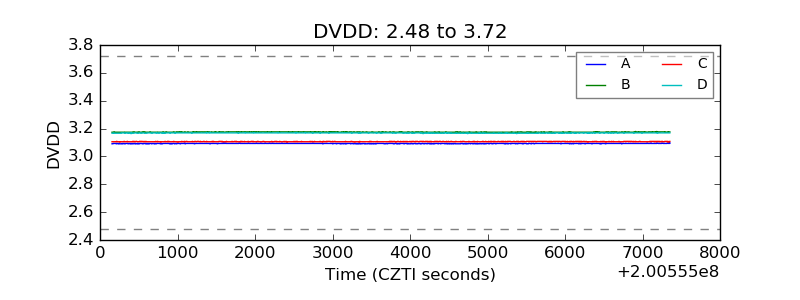 |
| Temperature 1 | 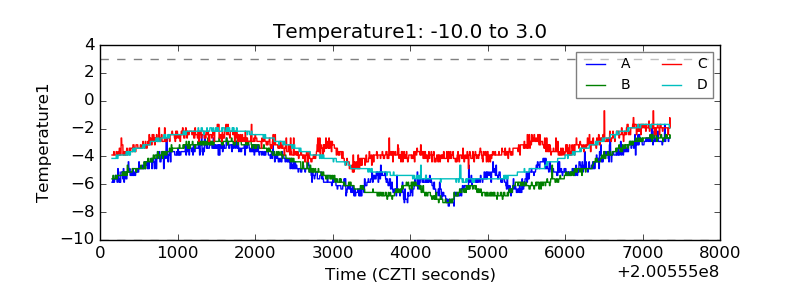 |
| Veto HV Monitor | 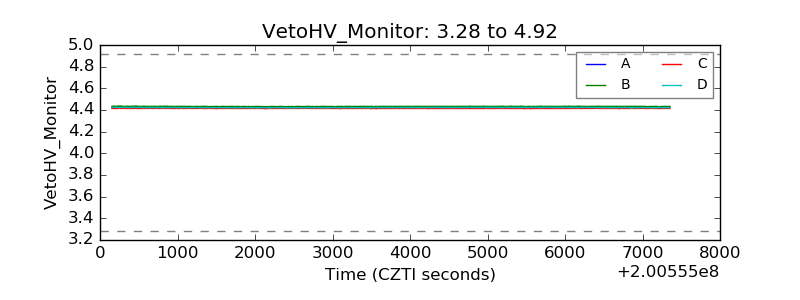 |
| Veto LLD | 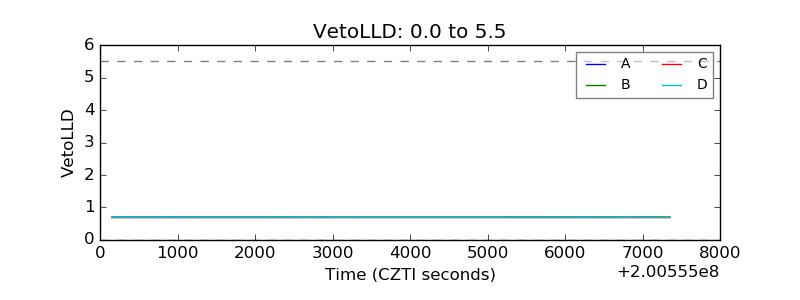 |
| Alpha Counter |  |
| _CPM_Rate |  |
| CZT Counter | 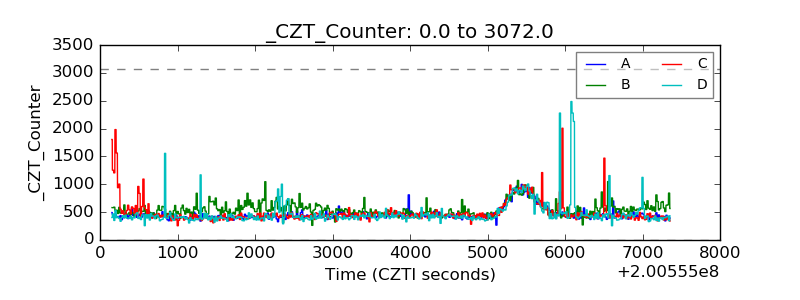 |
| +2.5 Volts monitor |  |
| +5 Volts monitor |  |
| _ROLL_ROT | 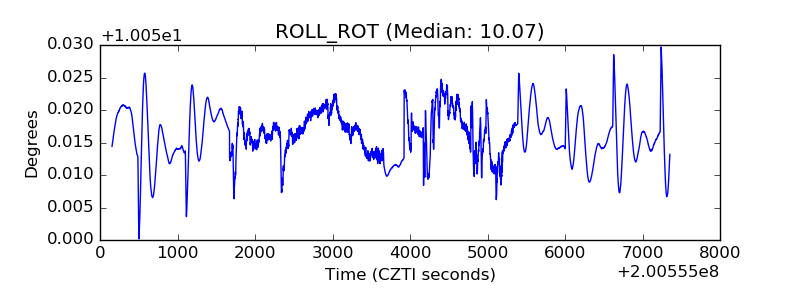 |
| _Roll_DEC | 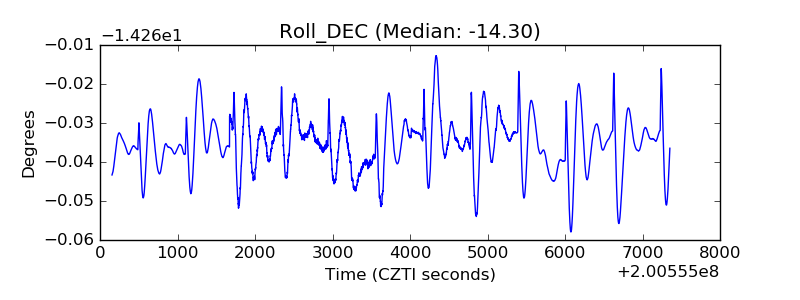 |
| _Roll_RA | 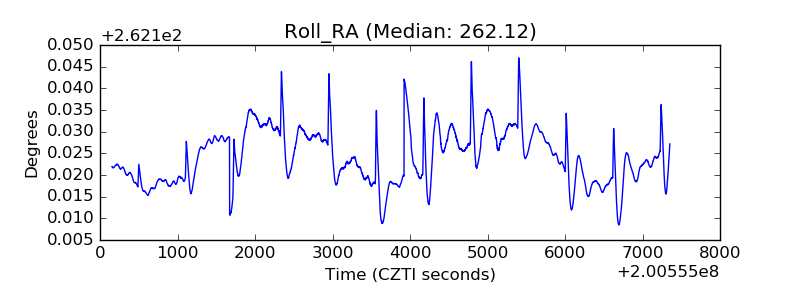 |
| Veto Counter | 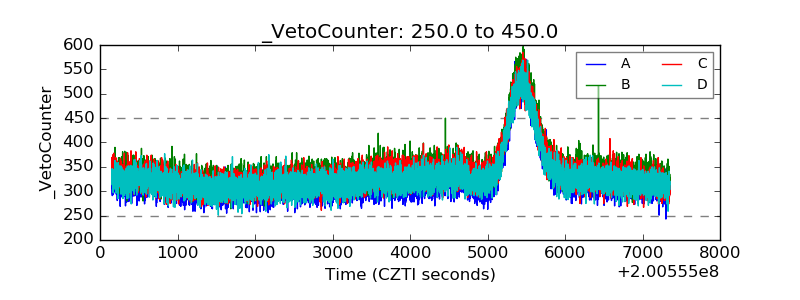 |