| Param | Original file | Final file |
|---|---|---|
| Filename | modeM0/AS1G05_246T01_9000000450_03334cztM0_level2.evt | modeM0/AS1G05_246T01_9000000450_03334cztM0_level2_quad_clean.evt |
| Size (bytes) | 526,276,800 | 74,914,560 |
| Size | 501.9 MB | 71.4 MB |
| Events in quadrant A | 3,515,953 | 434,966 |
| Events in quadrant B | 4,484,360 | 442,620 |
| Events in quadrant C | 3,719,619 | 440,360 |
| Events in quadrant D | 3,703,206 | 422,475 |
| Mode M0 | |||
|---|---|---|---|
| Quadrant | BADHDUFLAG | Total packets | Discarded packets |
| A | 0 | 15855 | 2 |
| B | 0 | 18146 | 1 |
| C | 0 | 16397 | 1 |
| D | 0 | 16797 | 1 |
| Mode SS | |||
|---|---|---|---|
| Quadrant | BADHDUFLAG | Total packets | Discarded packets |
| A | 0 | 152 | 0 |
| B | 0 | 152 | 0 |
| C | 0 | 152 | 0 |
| D | 0 | 152 | 0 |
| Mode M9 | |||
|---|---|---|---|
| Quadrant | BADHDUFLAG | Total packets | Discarded packets |
| A | 0 | 1 | 0 |
| B | 0 | 1 | 0 |
| C | 0 | 1 | 0 |
| D | 0 | 1 | 0 |
| Quadrant | Total seconds | Saturated seconds | Saturation percentage |
|---|---|---|---|
| A | 7590 | 263 | 3.465086% |
| B | 7590 | 292 | 3.847167% |
| C | 7590 | 199 | 2.621871% |
| D | 7590 | 274 | 3.610013% |
Noise dominated data is calculated using 1-second bins in cleaned event files. If a bin has >2000 counts, and if more than 50% of those come from <1% of pixels, then it is considered to be noise-dominated and hence unusable.
| Quadrant | # 1 sec bins | Bins with >0 counts | Bins with >2000 counts | High rate bins dominated by noise | Noise dominated (total time) | Noise dominated (detector-on time) | Marked lightcurve |
|---|---|---|---|---|---|---|---|
| A | 7630 | 7591 | 2 | 2 | 0.03% | 0.03% | 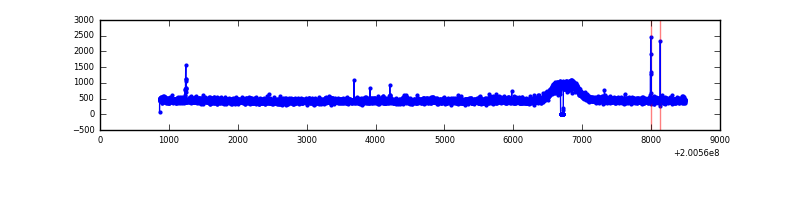 |
| B | 7630 | 7591 | 11 | 11 | 0.14% | 0.14% | 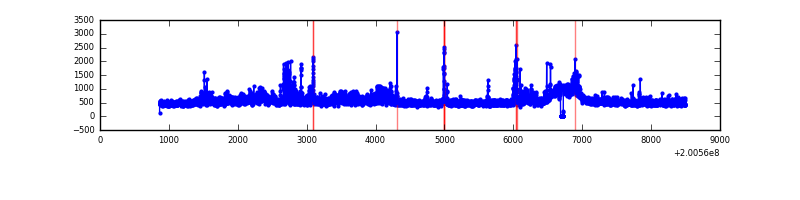 |
| C | 7630 | 7591 | 20 | 20 | 0.26% | 0.26% | 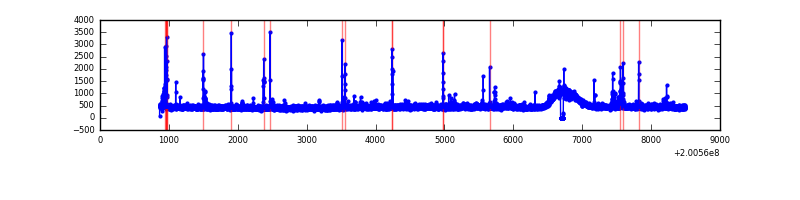 |
| D | 7630 | 7591 | 66 | 66 | 0.87% | 0.87% | 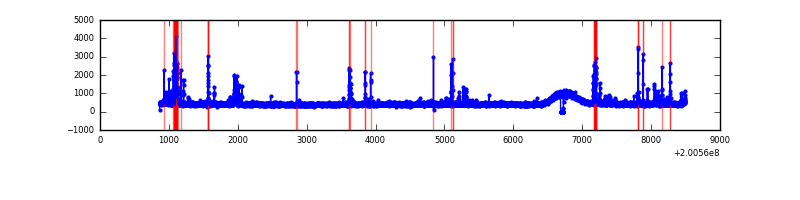 |
Top three noisy pixels from each quadrant. If the there are fewer than three noisy pixels in the level2.evt file, extra rows are filled as -1
| Pixel properties | Quadrant properties | ||||||
|---|---|---|---|---|---|---|---|
| Quadrant | DetID | PixID | Counts | Sigma | Mean | Median | Sigma |
| A | 13 | 14 | 25986 | 134.26 | 899 | 878 | 187.0 |
| A | 0 | 226 | 10155 | 49.61 | 899 | 878 | 187.0 |
| A | 0 | 118 | 9394 | 45.54 | 899 | 878 | 187.0 |
| B | 15 | 204 | 620924 | 3445.65 | 906 | 883 | 179.9 |
| B | 10 | 249 | 125235 | 691.04 | 906 | 883 | 179.9 |
| B | 14 | 167 | 110083 | 606.84 | 906 | 883 | 179.9 |
| C | 14 | 223 | 116939 | 558.04 | 875 | 879 | 208.0 |
| C | 1 | 16 | 58969 | 279.31 | 875 | 879 | 208.0 |
| C | 8 | 208 | 49506 | 233.81 | 875 | 879 | 208.0 |
| D | 13 | 223 | 279751 | 1271.14 | 879 | 850 | 219.4 |
| D | 13 | 239 | 33349 | 148.12 | 879 | 850 | 219.4 |
| D | 9 | 85 | 26924 | 118.84 | 879 | 850 | 219.4 |
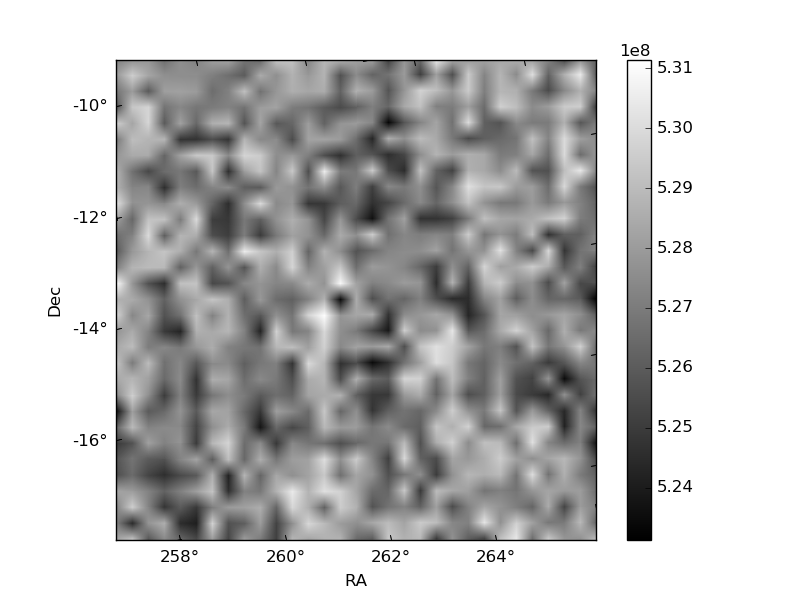
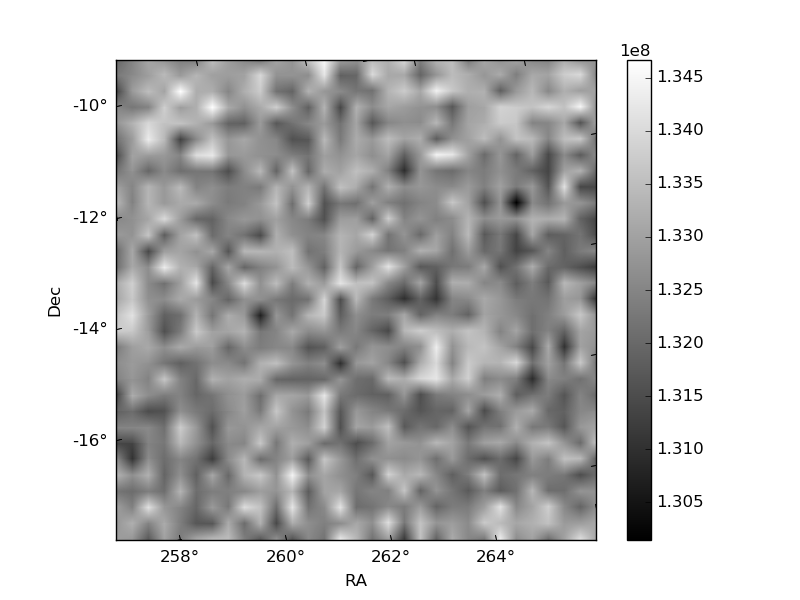
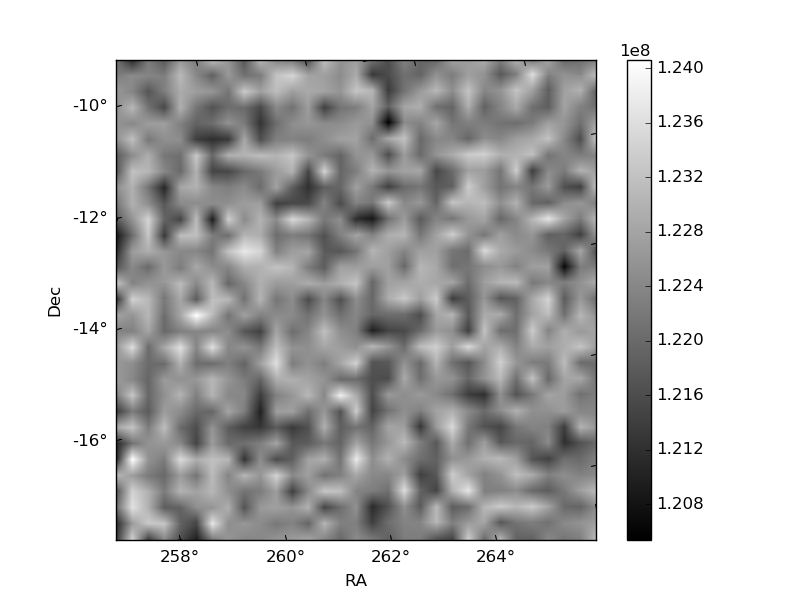
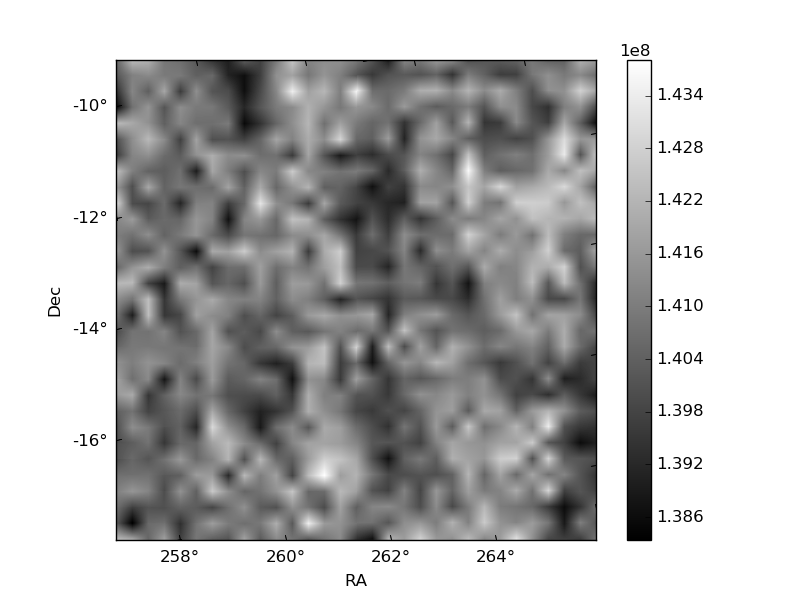
Histogram calculated using DETX and DETY for each event in the final _common_clean file
| Quadrant A | 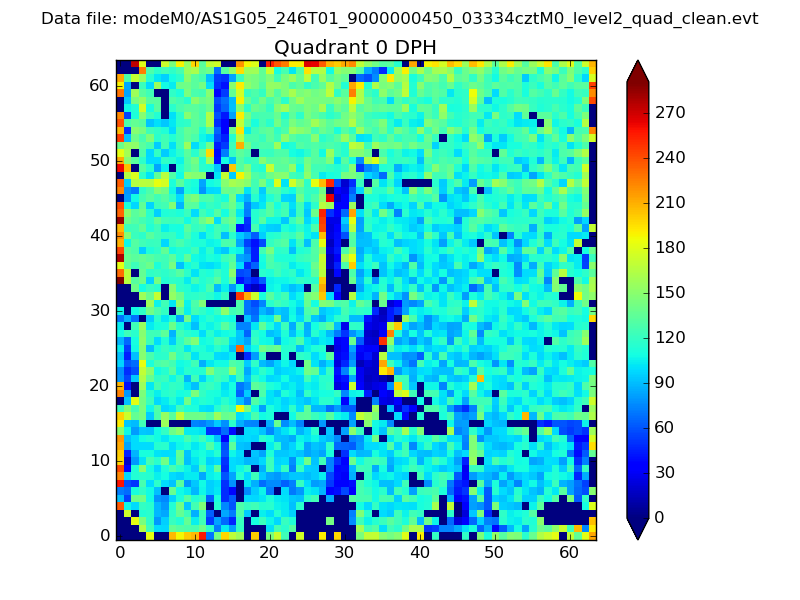 |
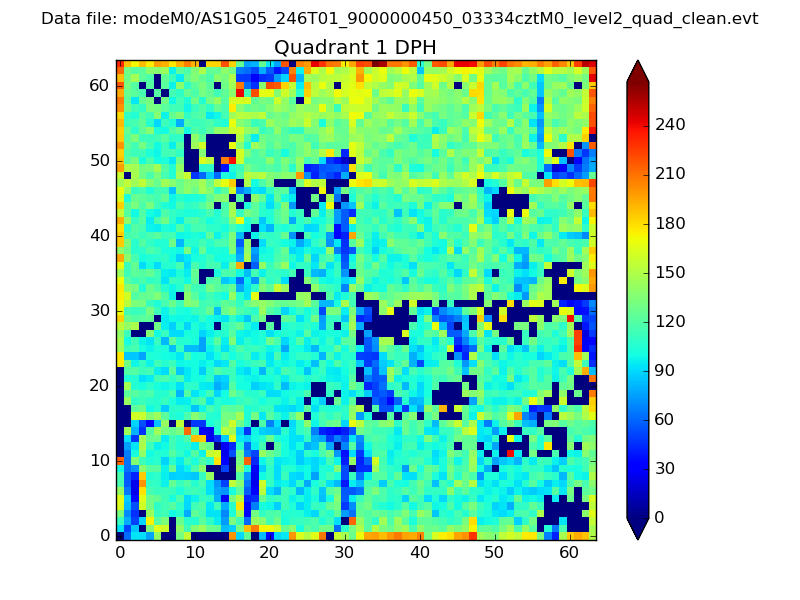 |
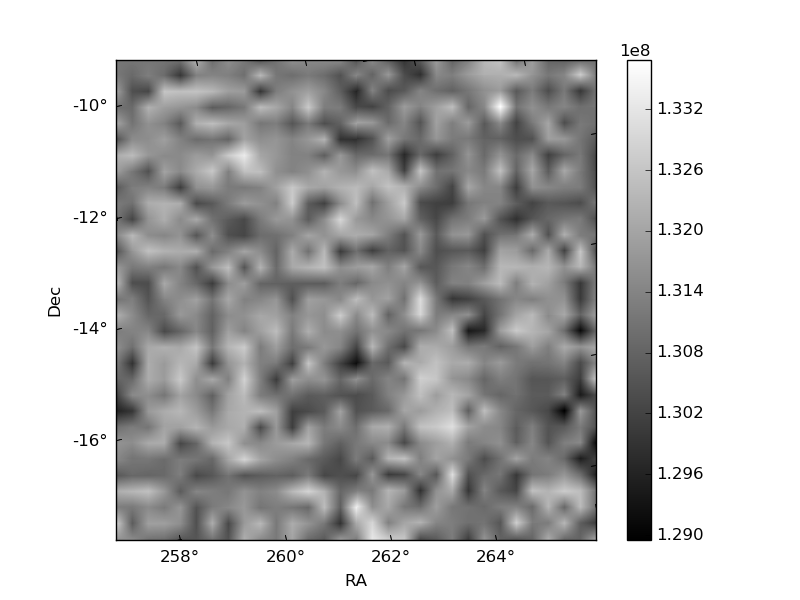
Quadrant B |
|---|---|---|---|
| Quadrant D | 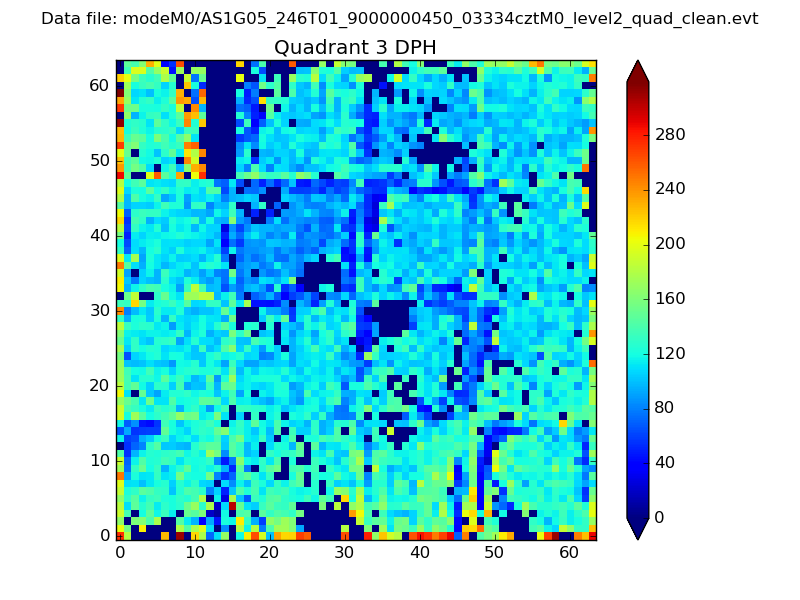 |
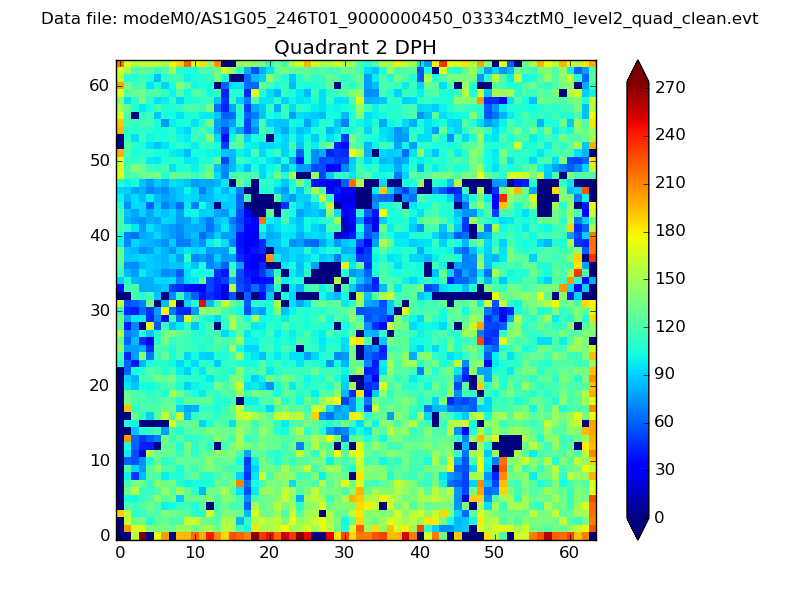 |
Quadrant C |
| Plot type | Count rate plots | Images |
|---|---|---|
| Comparison with Poisson distribution Blue bars denote a histogram of data divided into 1 sec bins. Red curve is a Poisson curve with rate = median count rate of data. |
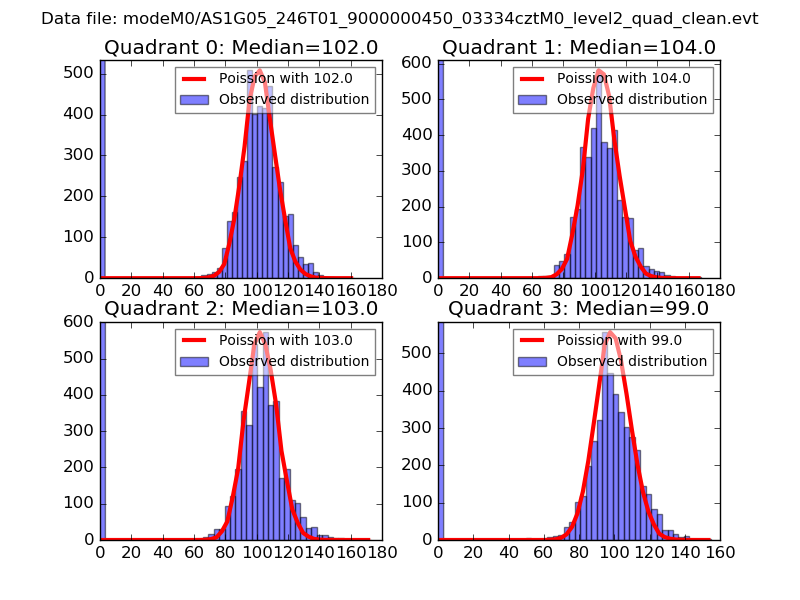 |
 |
| Quadrant-wise count rates Data is divided into 100 sec bins |
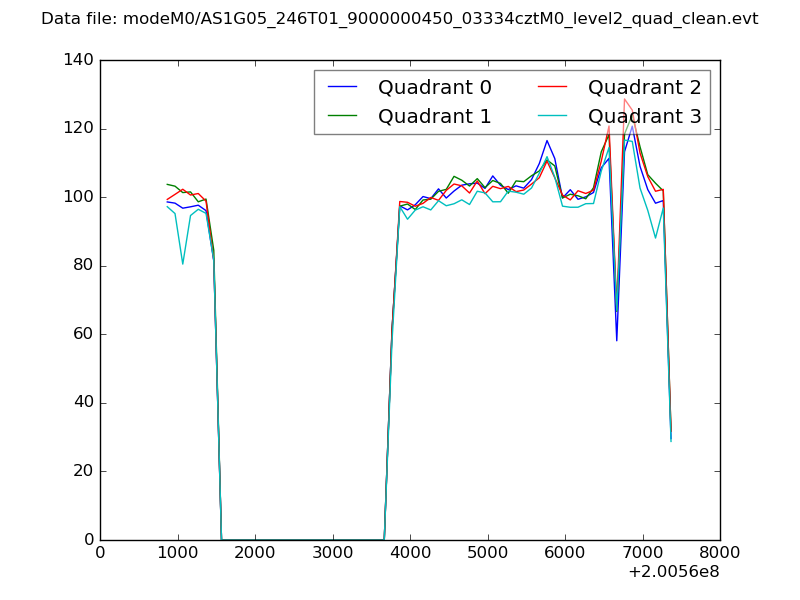 |
|
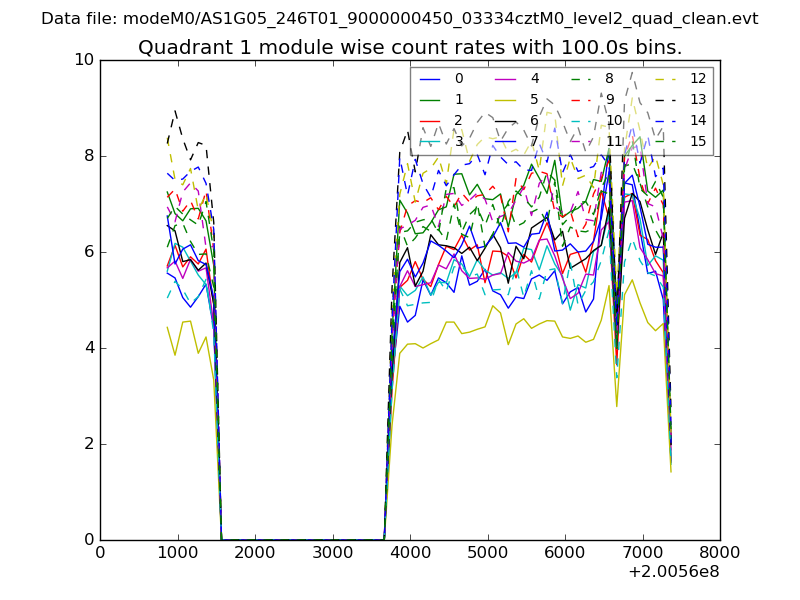
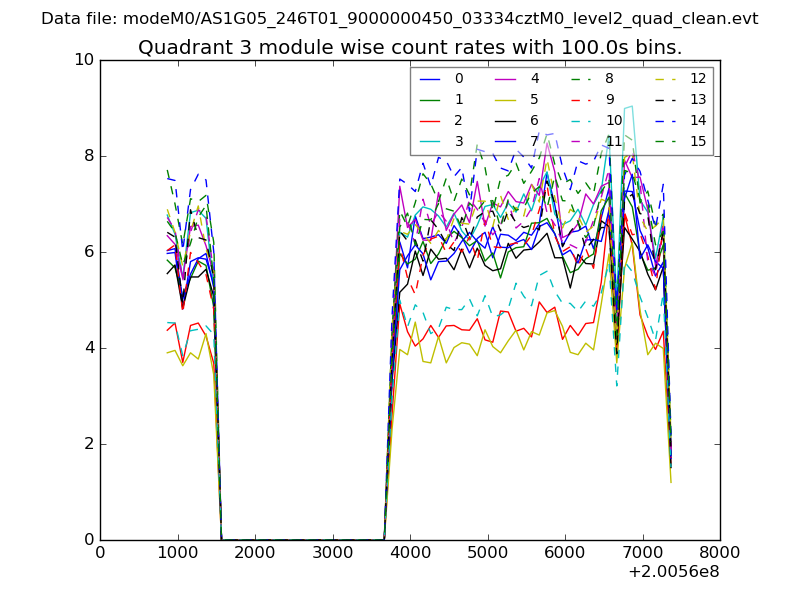
| Module-wise count rates for Quadrant A Data is divided into 100 sec bins |
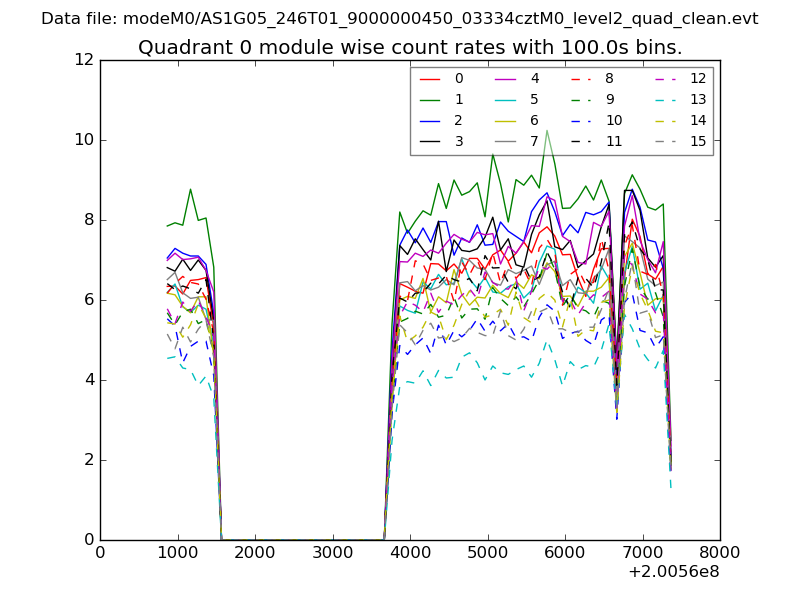 |
 |
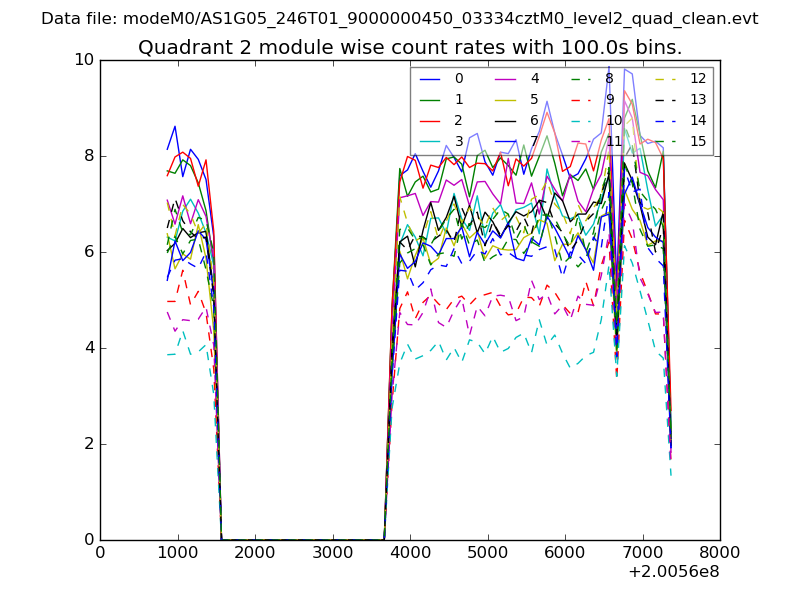
| Module-wise count rates for Quadrant B Data is divided into 100 sec bins |
 |
 |
| Module-wise count rates for Quadrant C Data is divided into 100 sec bins |
 |
 |
| Module-wise count rates for Quadrant D Data is divided into 100 sec bins |
 |
 |
| Parameter | Plot |
|---|---|
| CZT HV Monitor | 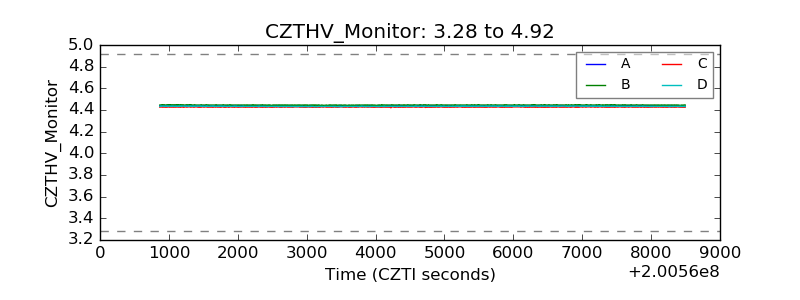 |
| D_VDD |  |
| Temperature 1 | 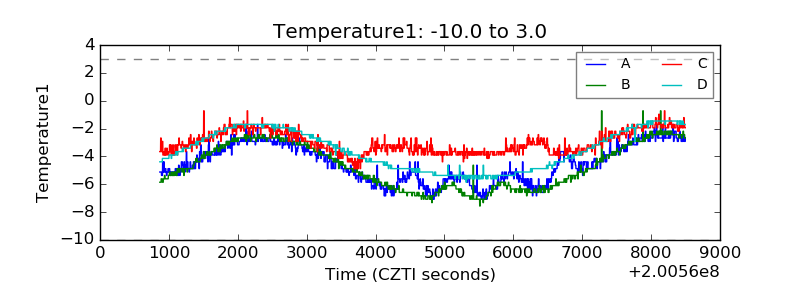 |
| Veto HV Monitor | 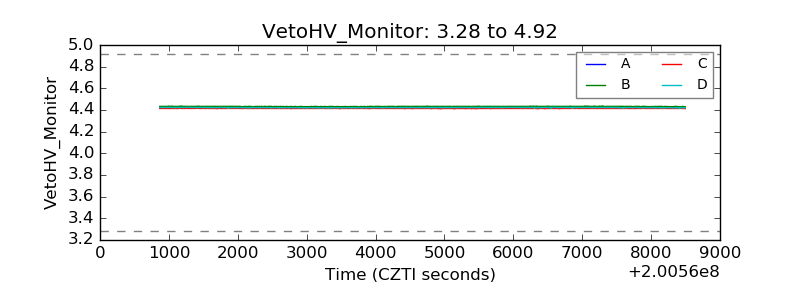 |
| Veto LLD | 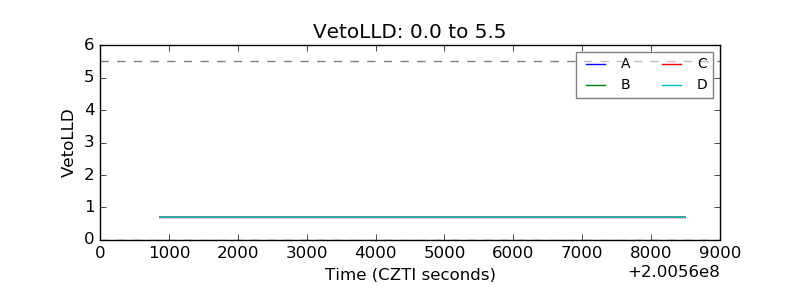 |
| Alpha Counter | 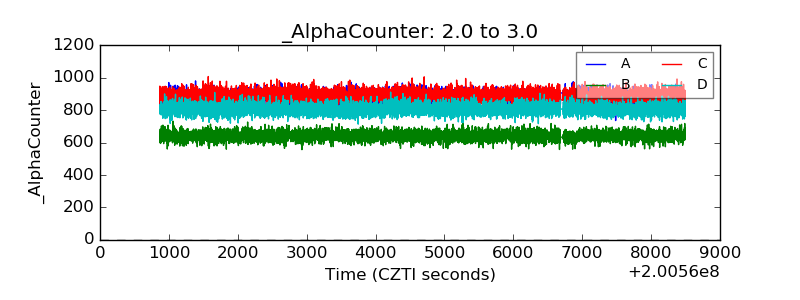 |
| _CPM_Rate | 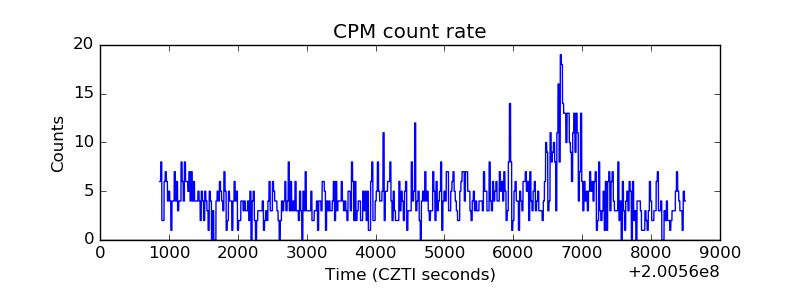 |
| CZT Counter | 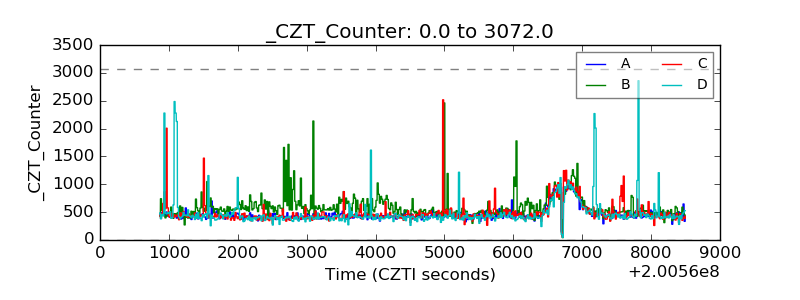 |
| +2.5 Volts monitor |  |
| +5 Volts monitor |  |
| _ROLL_ROT | 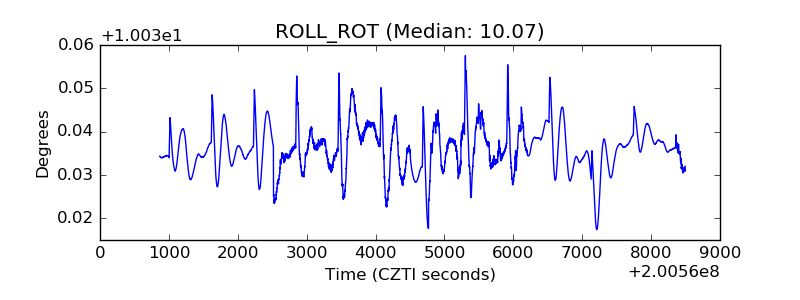 |
| _Roll_DEC | 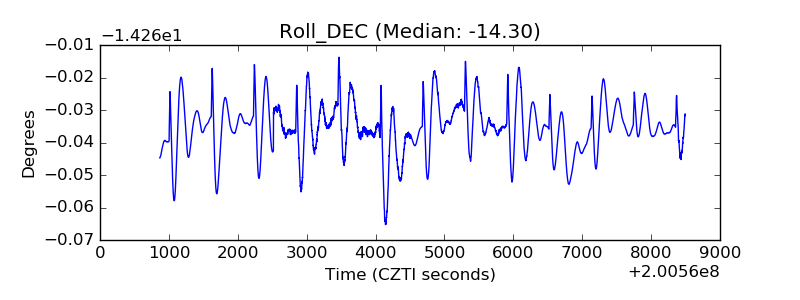 |
| _Roll_RA | 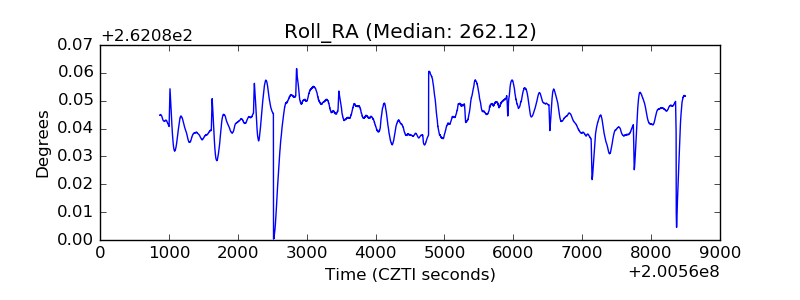 |
| Veto Counter | 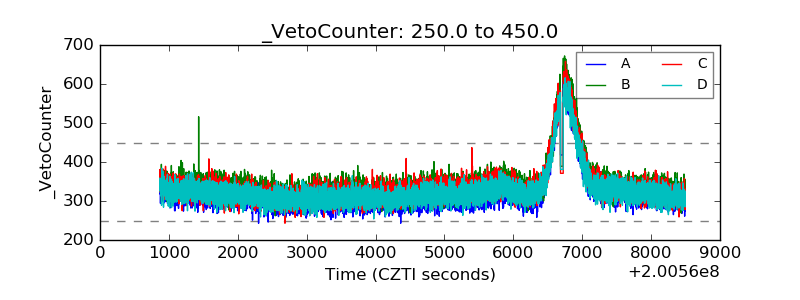 |