| Param | Original file | Final file |
|---|---|---|
| Filename | modeM0/AS1G05_246T01_9000000450_03338cztM0_level2.evt | modeM0/AS1G05_246T01_9000000450_03338cztM0_level2_quad_clean.evt |
| Size (bytes) | 1,195,968,960 | 168,048,000 |
| Size | 1.1 GB | 160.3 MB |
| Events in quadrant A | 7,420,634 | 997,298 |
| Events in quadrant B | 9,376,471 | 1,001,809 |
| Events in quadrant C | 9,730,095 | 979,464 |
| Events in quadrant D | 8,557,717 | 952,578 |
| Mode M0 | |||
|---|---|---|---|
| Quadrant | BADHDUFLAG | Total packets | Discarded packets |
| A | 0 | 34219 | 3 |
| B | 0 | 38734 | 4 |
| C | 0 | 40454 | 2 |
| D | 0 | 38043 | 5 |
| Mode SS | |||
|---|---|---|---|
| Quadrant | BADHDUFLAG | Total packets | Discarded packets |
| A | 0 | 340 | 0 |
| B | 0 | 340 | 0 |
| C | 0 | 340 | 0 |
| D | 0 | 340 | 0 |
| Mode M9 | |||
|---|---|---|---|
| Quadrant | BADHDUFLAG | Total packets | Discarded packets |
| A | 0 | 13 | 0 |
| B | 0 | 13 | 0 |
| C | 0 | 13 | 0 |
| D | 0 | 13 | 0 |
| Quadrant | Total seconds | Saturated seconds | Saturation percentage |
|---|---|---|---|
| A | 16787 | 149 | 0.887592% |
| B | 16786 | 243 | 1.447635% |
| C | 16787 | 470 | 2.799786% |
| D | 16786 | 466 | 2.776123% |
Noise dominated data is calculated using 1-second bins in cleaned event files. If a bin has >2000 counts, and if more than 50% of those come from <1% of pixels, then it is considered to be noise-dominated and hence unusable.
| Quadrant | # 1 sec bins | Bins with >0 counts | Bins with >2000 counts | High rate bins dominated by noise | Noise dominated (total time) | Noise dominated (detector-on time) | Marked lightcurve |
|---|---|---|---|---|---|---|---|
| A | 26217 | 16790 | 3 | 3 | 0.01% | 0.02% | 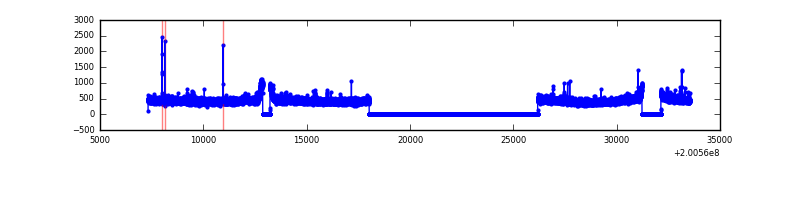 |
| B | 26217 | 16790 | 44 | 44 | 0.17% | 0.26% | 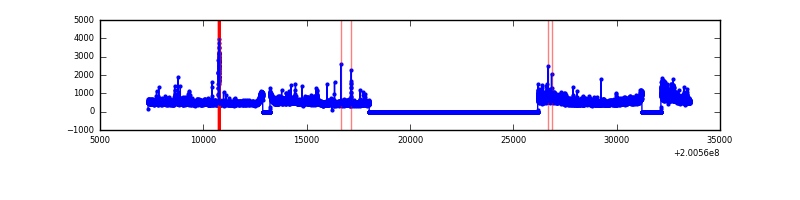 |
| C | 26217 | 16790 | 269 | 269 | 1.03% | 1.60% | 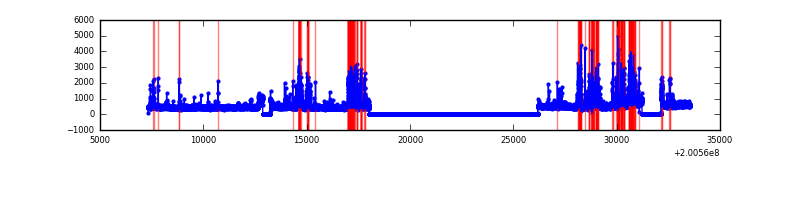 |
| D | 26217 | 16789 | 268 | 268 | 1.02% | 1.60% |  |
Top three noisy pixels from each quadrant. If the there are fewer than three noisy pixels in the level2.evt file, extra rows are filled as -1
| Pixel properties | Quadrant properties | ||||||
|---|---|---|---|---|---|---|---|
| Quadrant | DetID | PixID | Counts | Sigma | Mean | Median | Sigma |
| A | 13 | 14 | 39896 | 97.37 | 1902 | 1860 | 390.6 |
| A | 0 | 118 | 26772 | 63.77 | 1902 | 1860 | 390.6 |
| A | 0 | 226 | 21812 | 51.07 | 1902 | 1860 | 390.6 |
| B | 15 | 204 | 1073113 | 2849.58 | 1929 | 1879 | 375.9 |
| B | 14 | 167 | 513848 | 1361.89 | 1929 | 1879 | 375.9 |
| B | 0 | 229 | 229639 | 605.86 | 1929 | 1879 | 375.9 |
| C | 14 | 223 | 1728916 | 3995.59 | 1848 | 1858 | 432.2 |
| C | 8 | 208 | 574716 | 1325.32 | 1848 | 1858 | 432.2 |
| C | 1 | 192 | 71653 | 161.47 | 1848 | 1858 | 432.2 |
| D | 13 | 223 | 1078059 | 2382.59 | 1837 | 1779 | 451.7 |
| D | 2 | 216 | 291603 | 641.59 | 1837 | 1779 | 451.7 |
| D | 5 | 233 | 61671 | 132.58 | 1837 | 1779 | 451.7 |
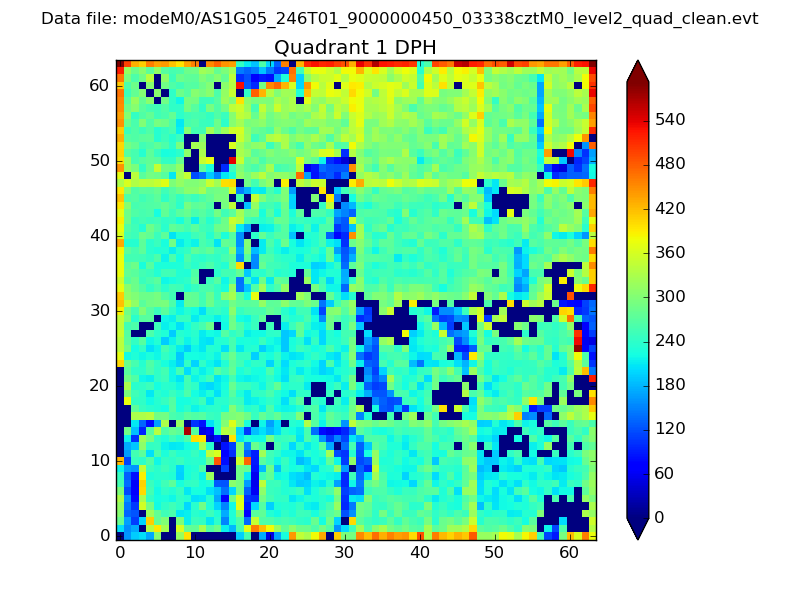
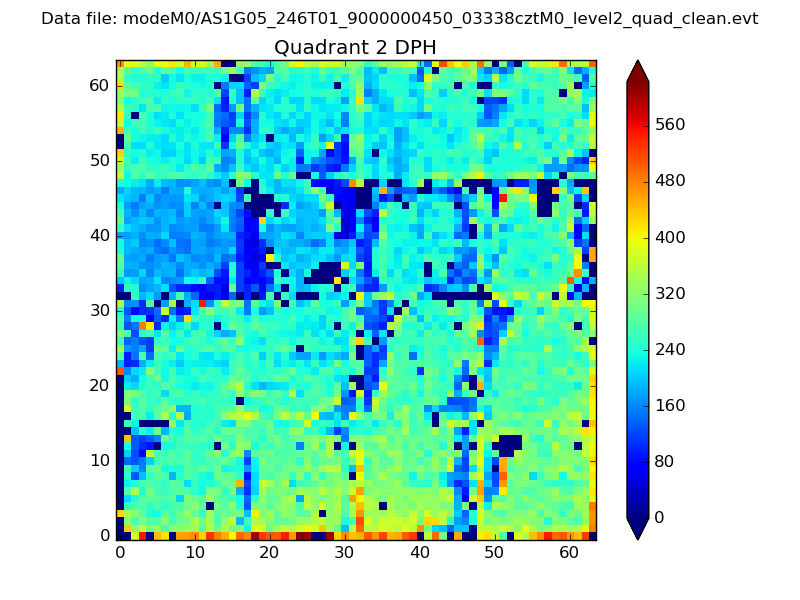
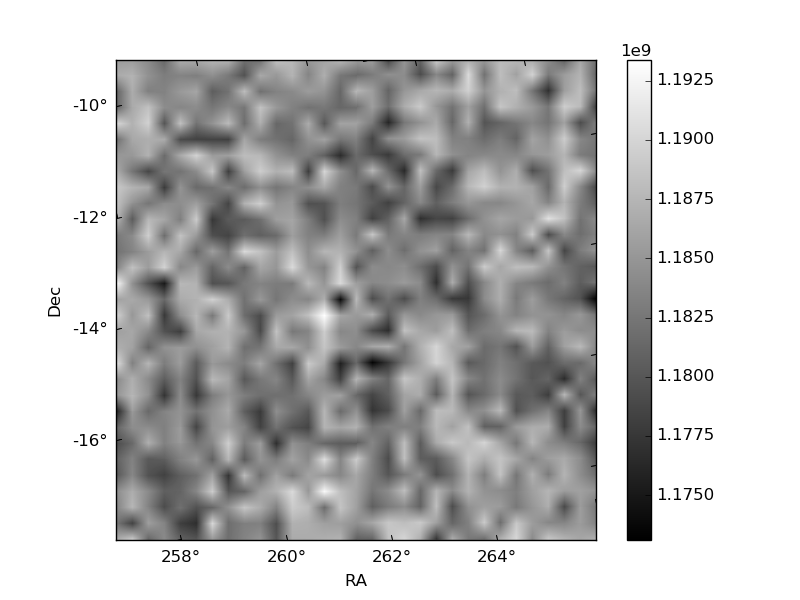
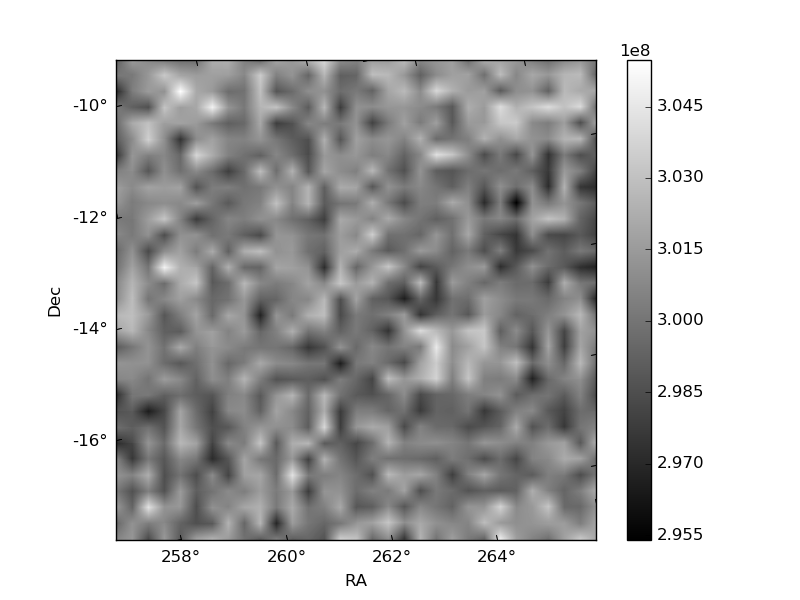
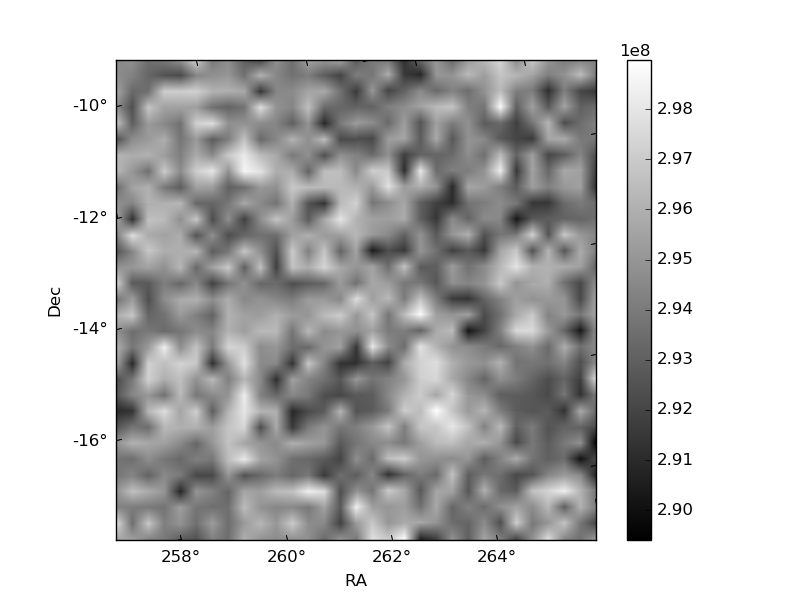
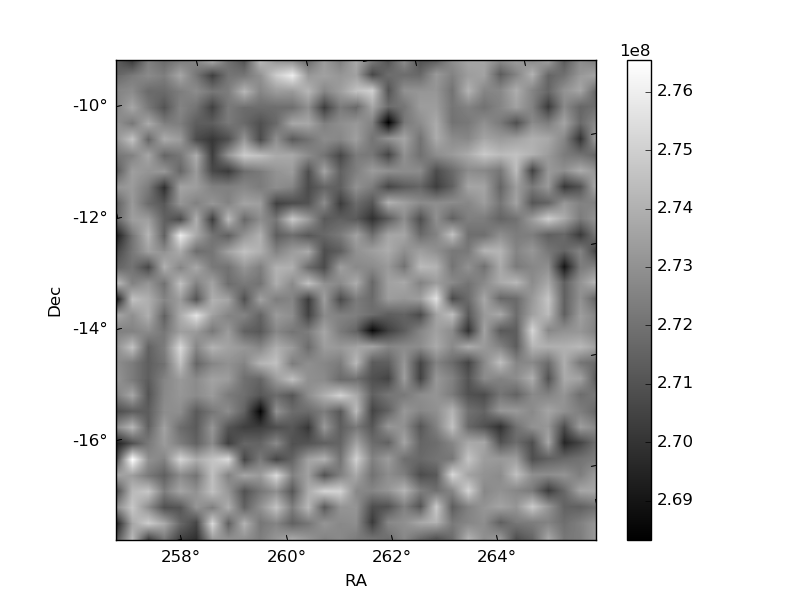
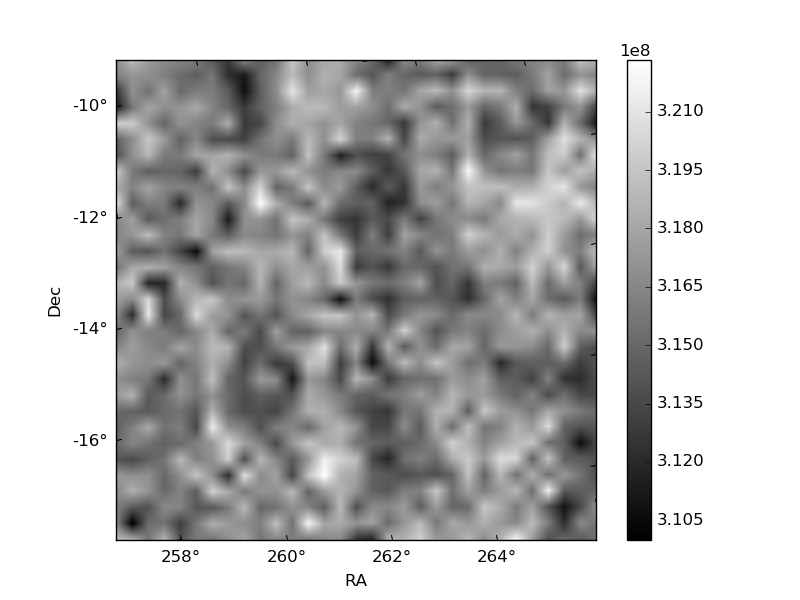
Histogram calculated using DETX and DETY for each event in the final _common_clean file
| Quadrant A | 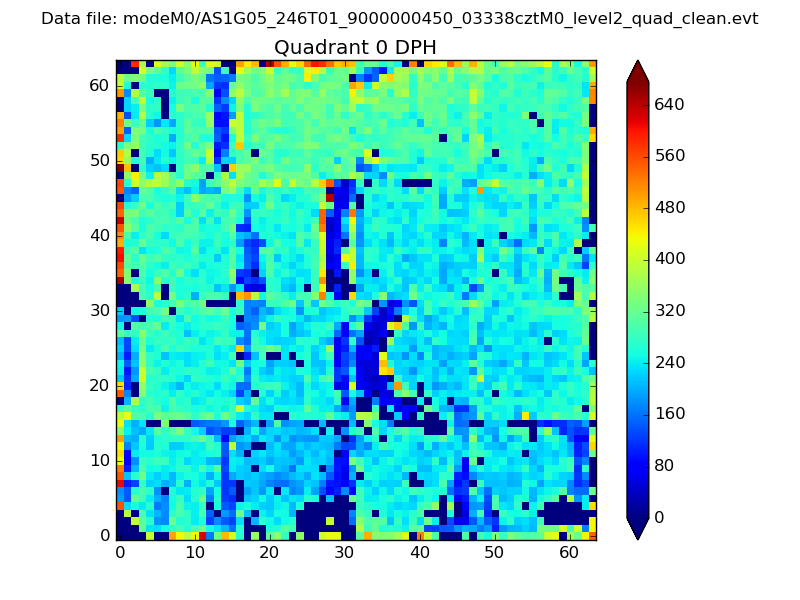 |
 |
Quadrant B |
|---|---|---|---|
| Quadrant D | 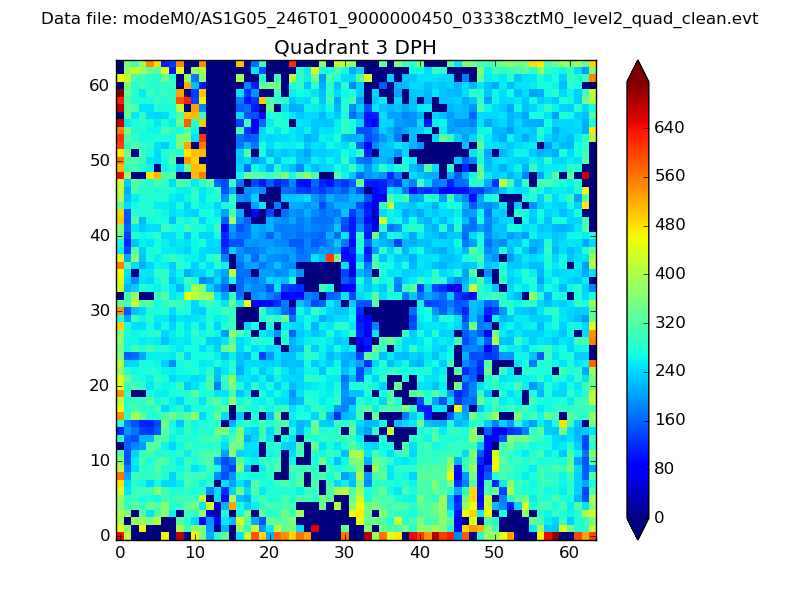 |
 |
Quadrant C |
| Plot type | Count rate plots | Images |
|---|---|---|
| Comparison with Poisson distribution Blue bars denote a histogram of data divided into 1 sec bins. Red curve is a Poisson curve with rate = median count rate of data. |
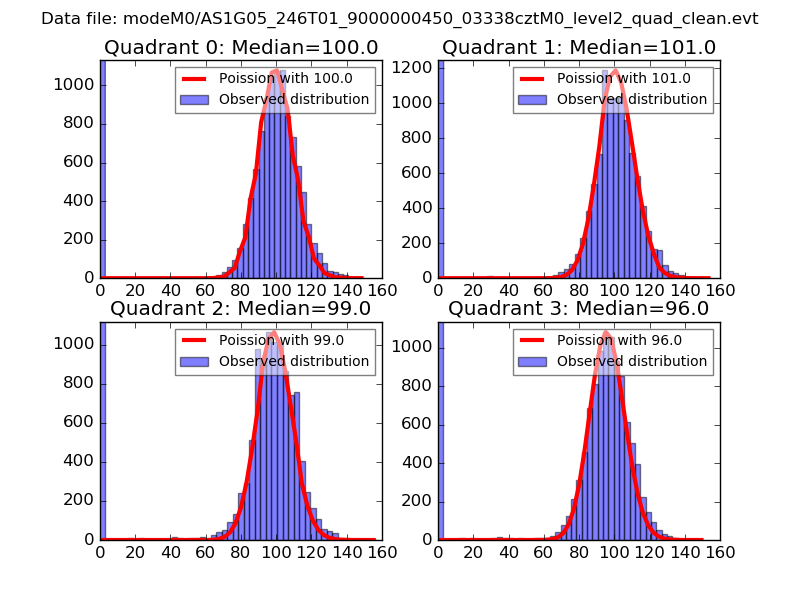 |
 |
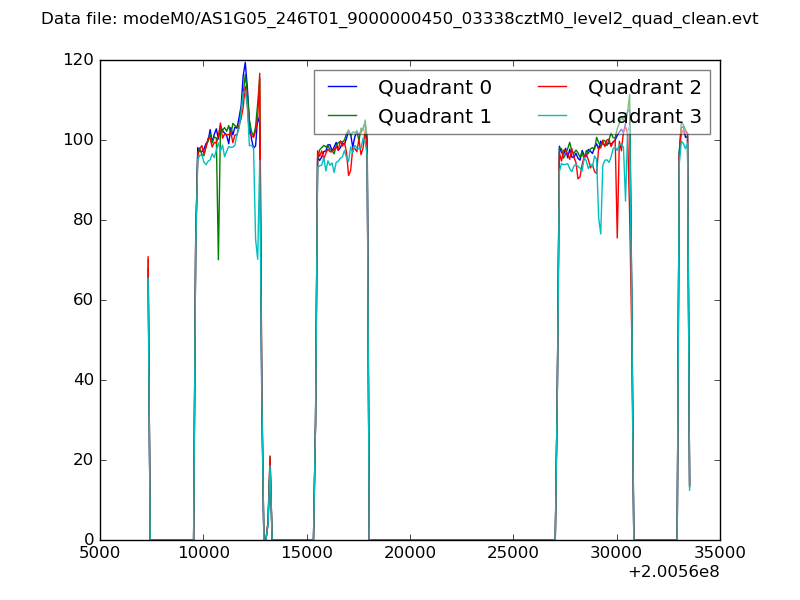
| Quadrant-wise count rates Data is divided into 100 sec bins |
 |
|
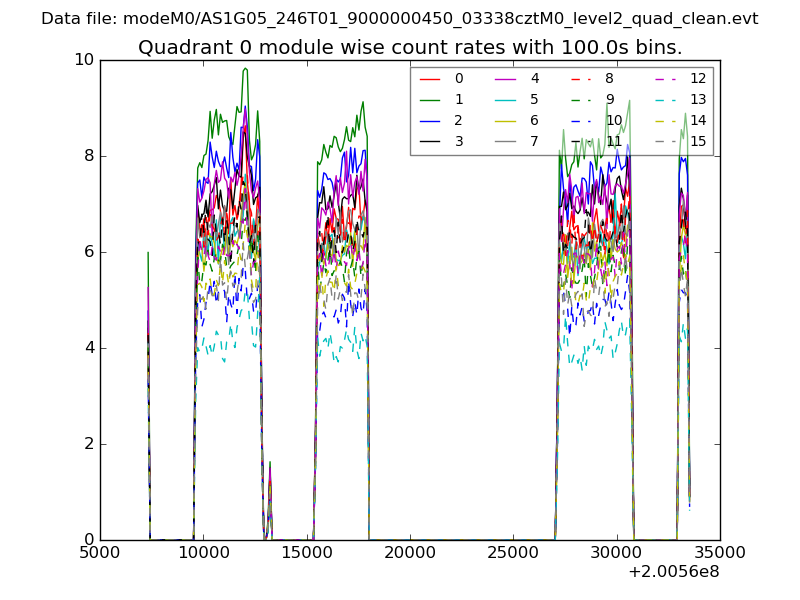
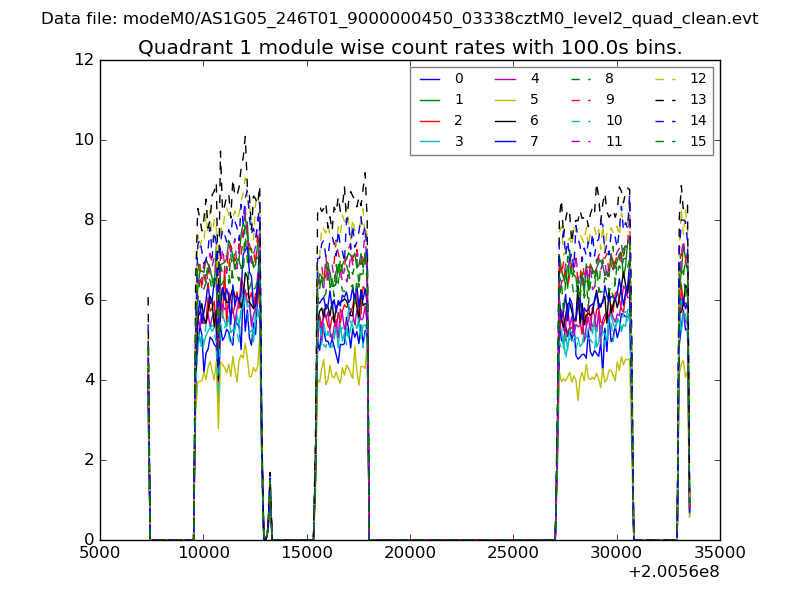
| Module-wise count rates for Quadrant A Data is divided into 100 sec bins |
 |
 |
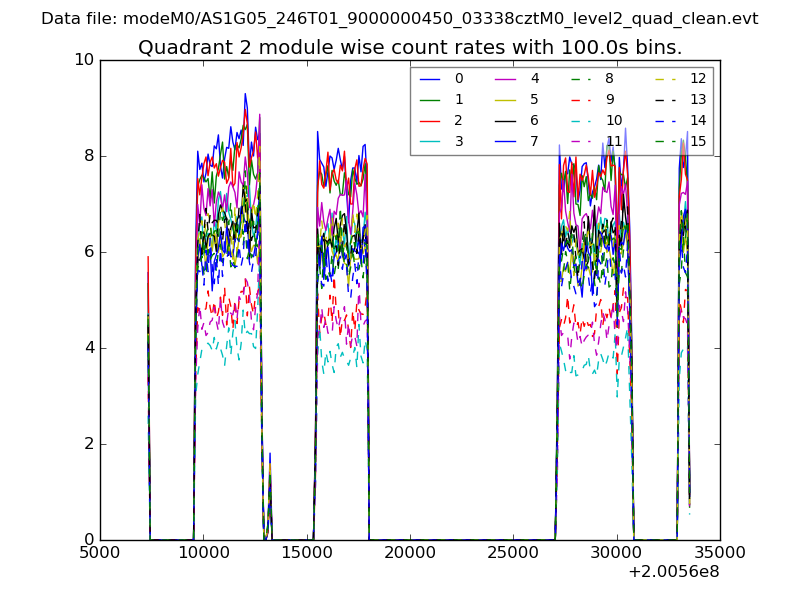
| Module-wise count rates for Quadrant B Data is divided into 100 sec bins |
 |
 |
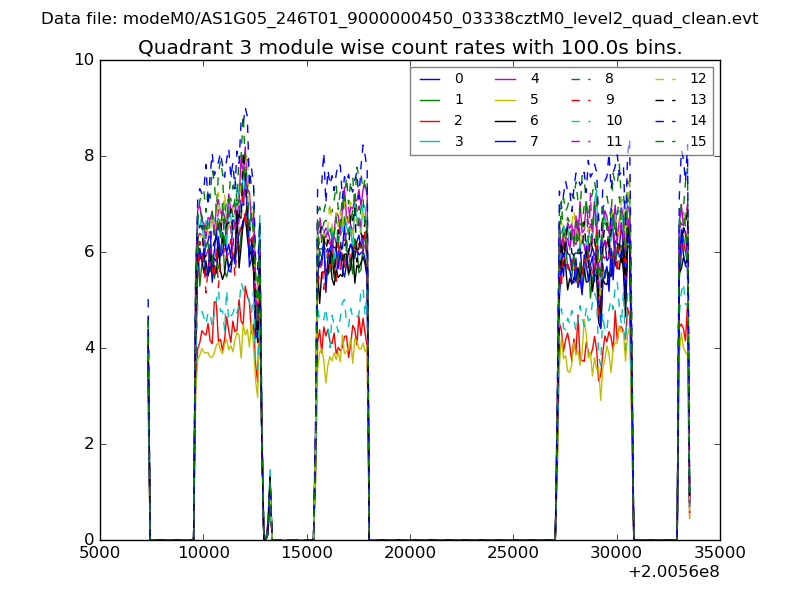
| Module-wise count rates for Quadrant C Data is divided into 100 sec bins |
 |
 |
| Module-wise count rates for Quadrant D Data is divided into 100 sec bins |
 |
 |
| Parameter | Plot |
|---|---|
| CZT HV Monitor | 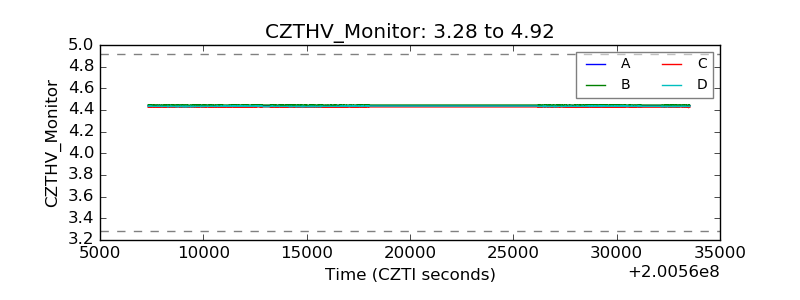 |
| D_VDD | 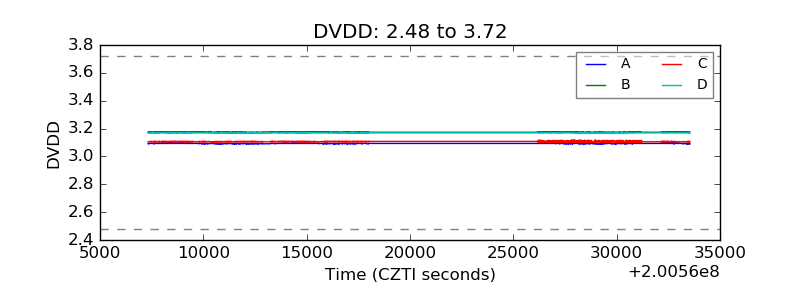 |
| Temperature 1 | 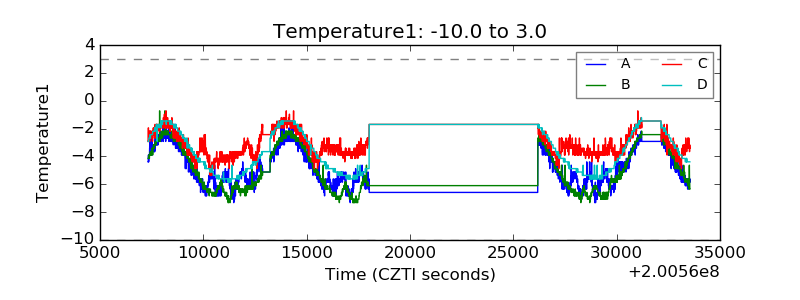 |
| Veto HV Monitor | 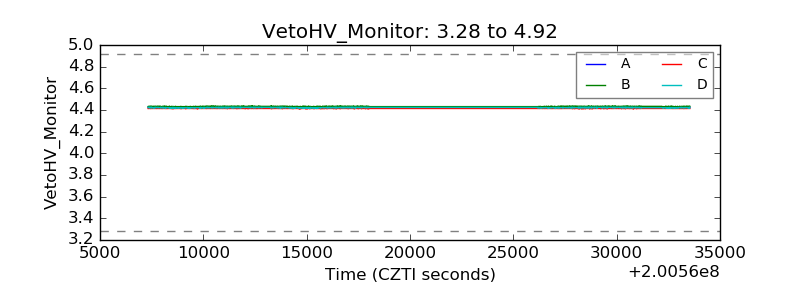 |
| Veto LLD | 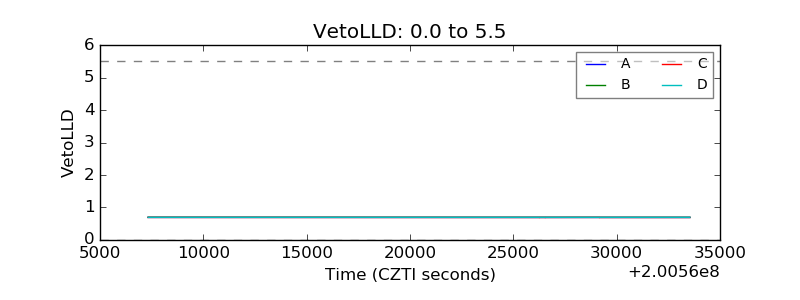 |
| Alpha Counter | 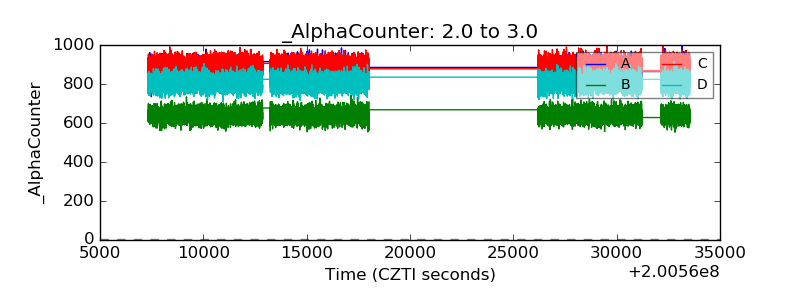 |
| _CPM_Rate | 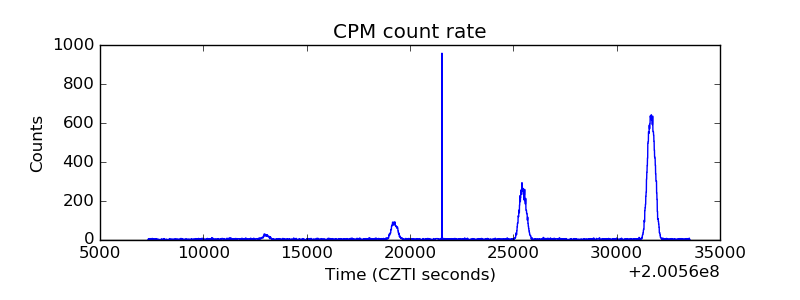 |
| CZT Counter | 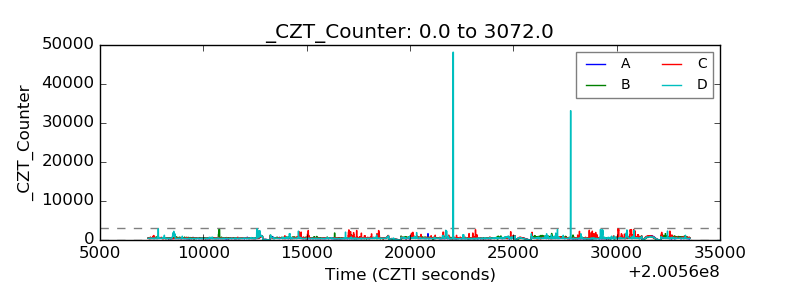 |
| +2.5 Volts monitor | 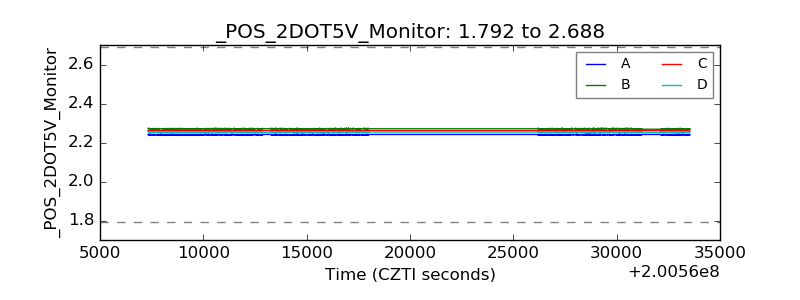 |
| +5 Volts monitor | 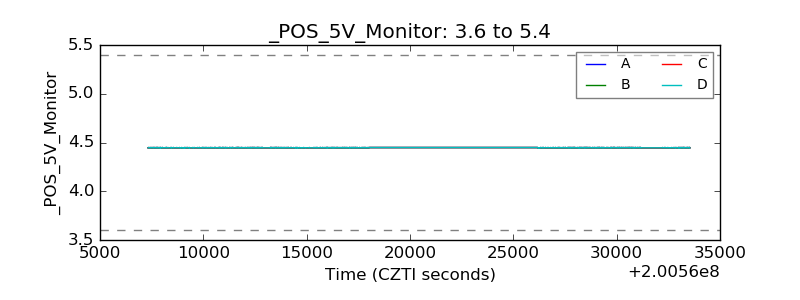 |
| _ROLL_ROT | 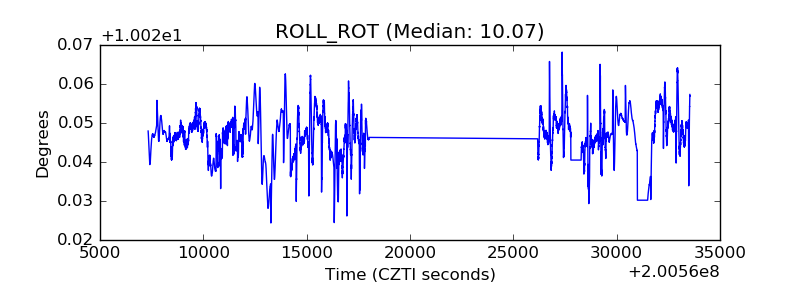 |
| _Roll_DEC | 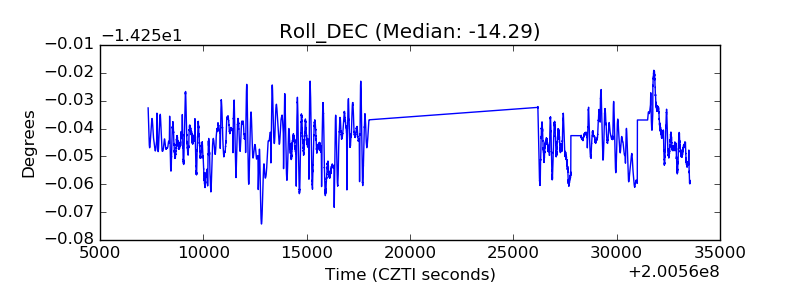 |
| _Roll_RA | 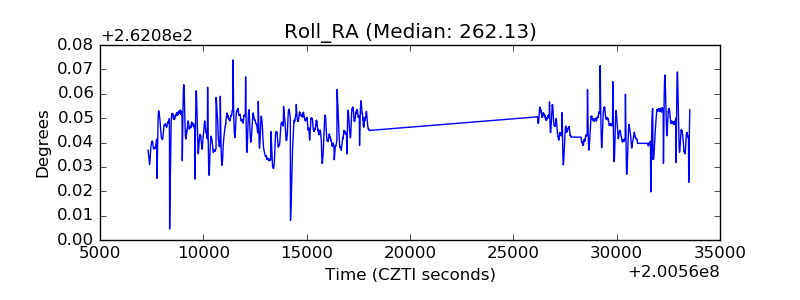 |
| Veto Counter | 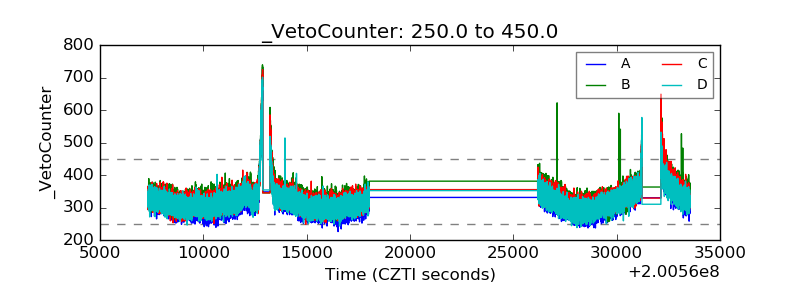 |