| Param | Original file | Final file |
|---|---|---|
| Filename | modeM0/AS1G05_246T01_9000000450_03341cztM0_level2.evt | modeM0/AS1G05_246T01_9000000450_03341cztM0_level2_quad_clean.evt |
| Size (bytes) | 533,545,920 | 83,842,560 |
| Size | 508.8 MB | 80.0 MB |
| Events in quadrant A | 3,119,991 | 518,706 |
| Events in quadrant B | 4,129,691 | 528,883 |
| Events in quadrant C | 5,347,654 | 518,904 |
| Events in quadrant D | 3,109,133 | 507,488 |
| Mode M0 | |||
|---|---|---|---|
| Quadrant | BADHDUFLAG | Total packets | Discarded packets |
| A | 0 | 13817 | 3 |
| B | 0 | 16685 | 2 |
| C | 0 | 20491 | 2 |
| D | 0 | 14029 | 2 |
| Mode SS | |||
|---|---|---|---|
| Quadrant | BADHDUFLAG | Total packets | Discarded packets |
| A | 0 | 136 | 0 |
| B | 0 | 136 | 0 |
| C | 0 | 136 | 0 |
| D | 0 | 136 | 0 |
| Mode M9 | |||
|---|---|---|---|
| Quadrant | BADHDUFLAG | Total packets | Discarded packets |
| A | 0 | 22 | 0 |
| B | 0 | 22 | 0 |
| C | 0 | 22 | 0 |
| D | 0 | 22 | 0 |
| Quadrant | Total seconds | Saturated seconds | Saturation percentage |
|---|---|---|---|
| A | 6674 | 49 | 0.734192% |
| B | 6674 | 108 | 1.618220% |
| C | 6674 | 257 | 3.850764% |
| D | 6674 | 26 | 0.389571% |
Noise dominated data is calculated using 1-second bins in cleaned event files. If a bin has >2000 counts, and if more than 50% of those come from <1% of pixels, then it is considered to be noise-dominated and hence unusable.
| Quadrant | # 1 sec bins | Bins with >0 counts | Bins with >2000 counts | High rate bins dominated by noise | Noise dominated (total time) | Noise dominated (detector-on time) | Marked lightcurve |
|---|---|---|---|---|---|---|---|
| A | 8880 | 6676 | 0 | 0 | 0.00% | 0.00% | 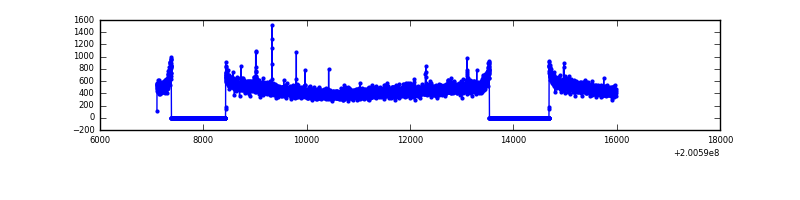 |
| B | 8880 | 6676 | 6 | 6 | 0.07% | 0.09% | 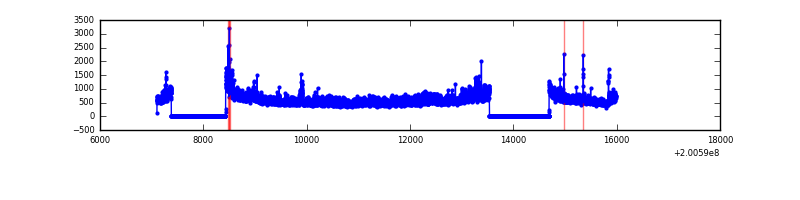 |
| C | 8880 | 6676 | 172 | 172 | 1.94% | 2.58% | 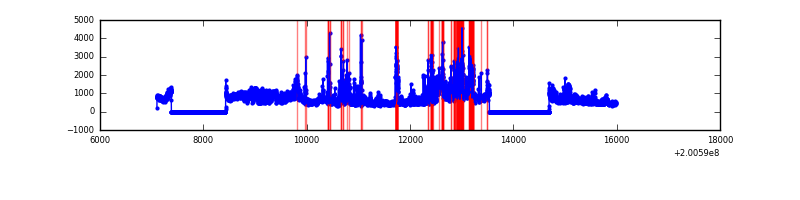 |
| D | 8880 | 6676 | 6 | 6 | 0.07% | 0.09% | 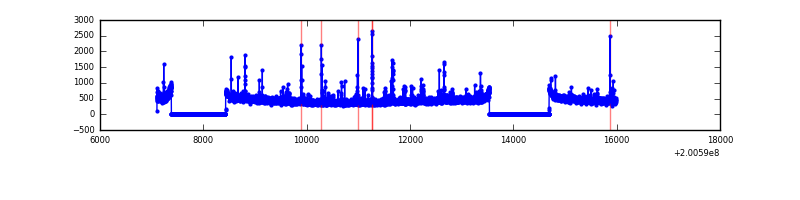 |
Top three noisy pixels from each quadrant. If the there are fewer than three noisy pixels in the level2.evt file, extra rows are filled as -1
| Pixel properties | Quadrant properties | ||||||
|---|---|---|---|---|---|---|---|
| Quadrant | DetID | PixID | Counts | Sigma | Mean | Median | Sigma |
| A | 14 | 249 | 26266 | 154.02 | 795 | 776 | 165.5 |
| A | 8 | 15 | 12596 | 71.42 | 795 | 776 | 165.5 |
| A | 0 | 226 | 8747 | 48.16 | 795 | 776 | 165.5 |
| B | 14 | 167 | 383755 | 2430.97 | 812 | 794 | 157.5 |
| B | 15 | 204 | 287743 | 1821.5 | 812 | 794 | 157.5 |
| B | 3 | 0 | 176424 | 1114.87 | 812 | 794 | 157.5 |
| C | 8 | 208 | 1351330 | 7426.29 | 774 | 780 | 181.9 |
| C | 14 | 223 | 632014 | 3470.98 | 774 | 780 | 181.9 |
| C | 1 | 192 | 185474 | 1015.58 | 774 | 780 | 181.9 |
| D | 13 | 239 | 41423 | 209.3 | 780 | 757 | 194.3 |
| D | 8 | 195 | 34643 | 174.4 | 780 | 757 | 194.3 |
| D | 13 | 223 | 19507 | 96.5 | 780 | 757 | 194.3 |
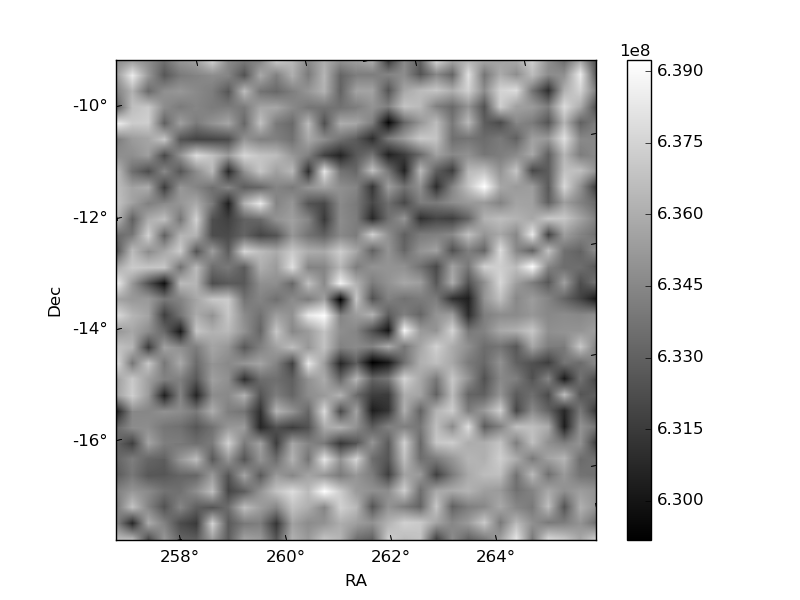
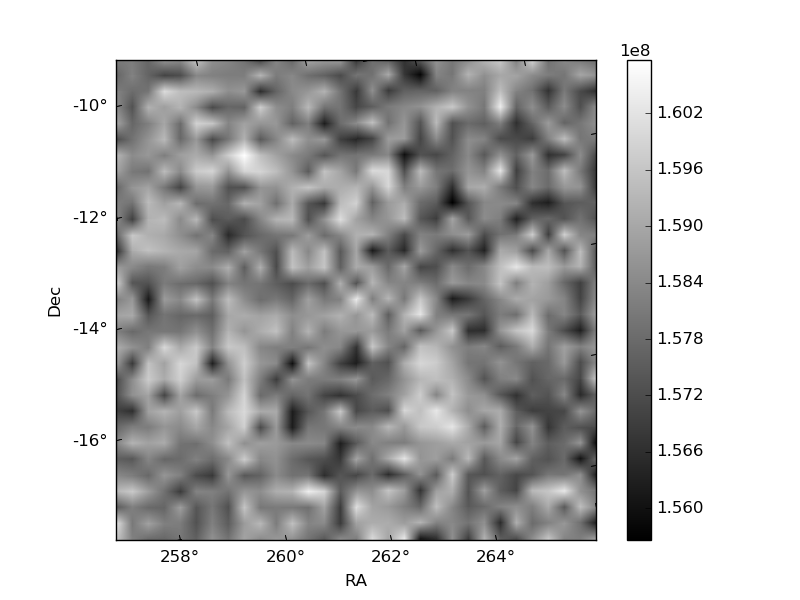
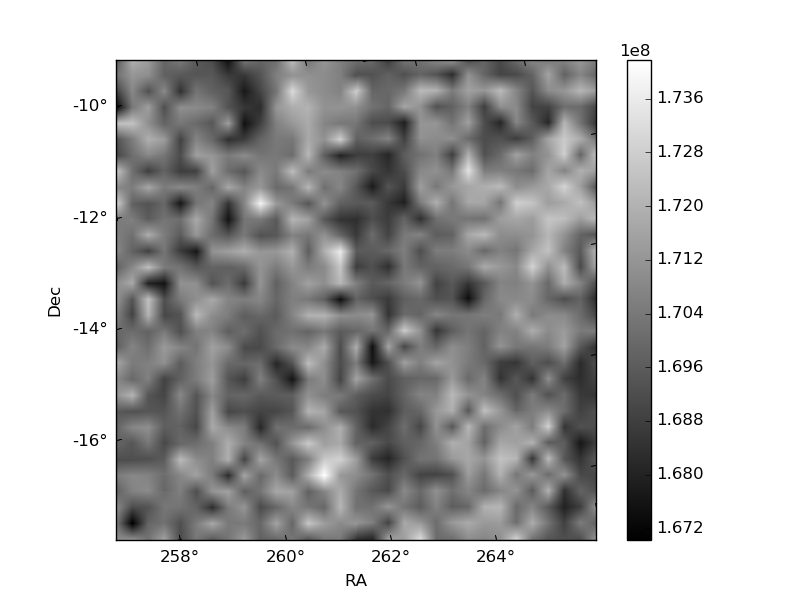
Histogram calculated using DETX and DETY for each event in the final _common_clean file
| Quadrant A | 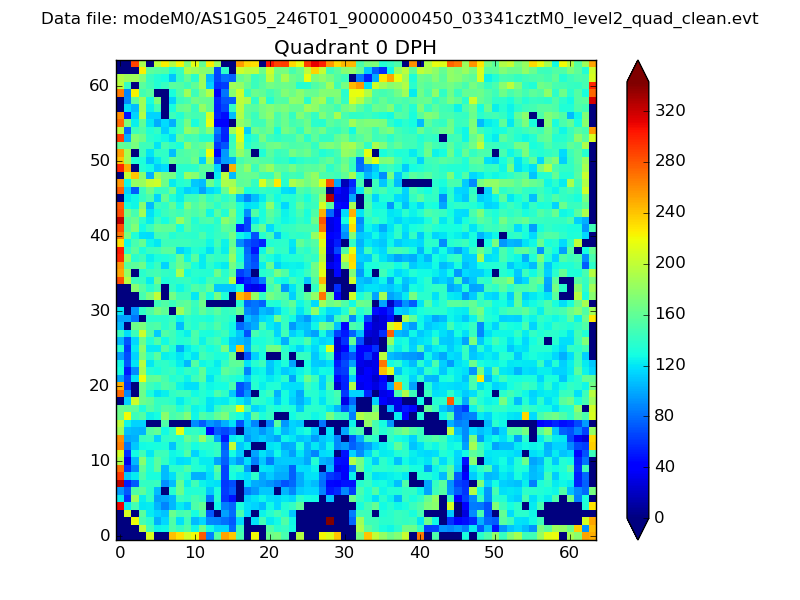 |
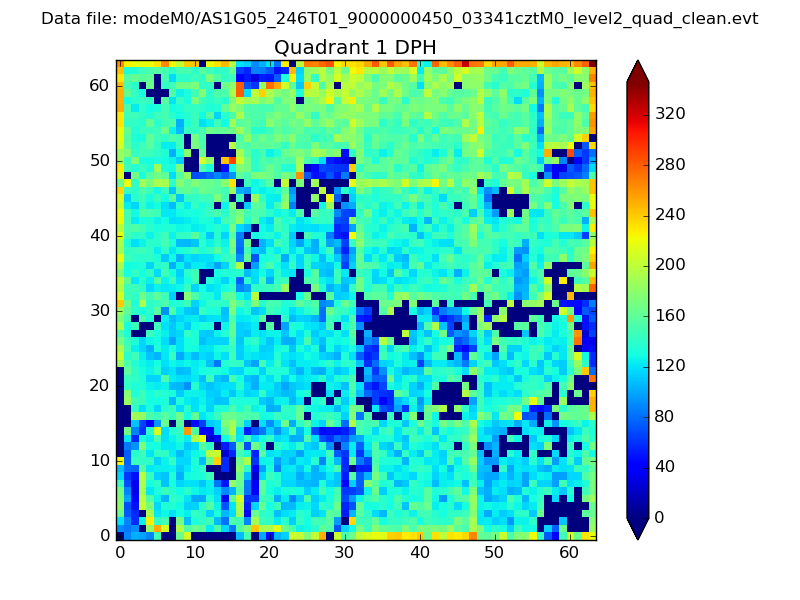 |
Quadrant B |
|---|---|---|---|
| Quadrant D | 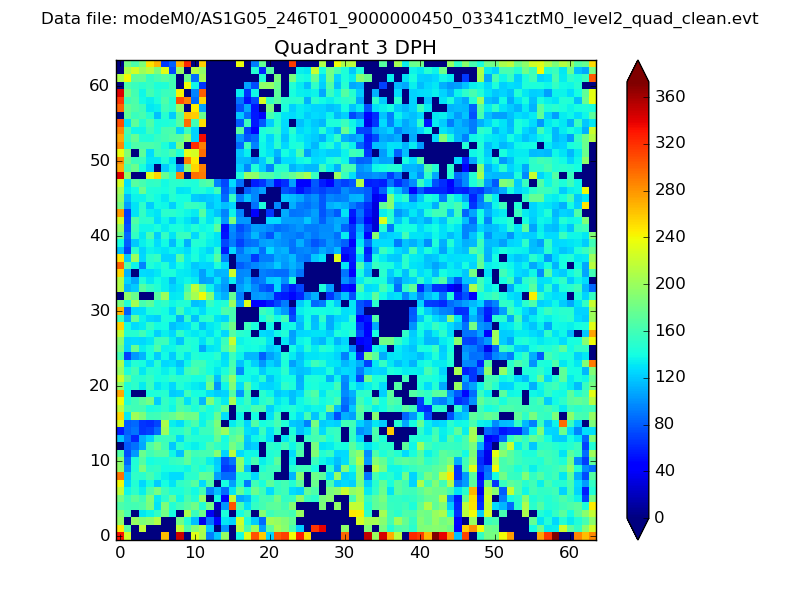 |
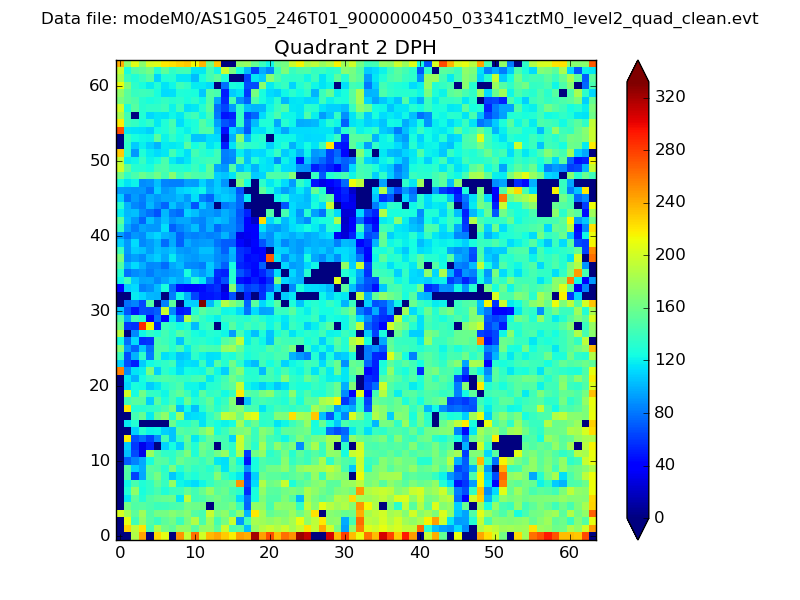 |
Quadrant C |
| Plot type | Count rate plots | Images |
|---|---|---|
| Comparison with Poisson distribution Blue bars denote a histogram of data divided into 1 sec bins. Red curve is a Poisson curve with rate = median count rate of data. |
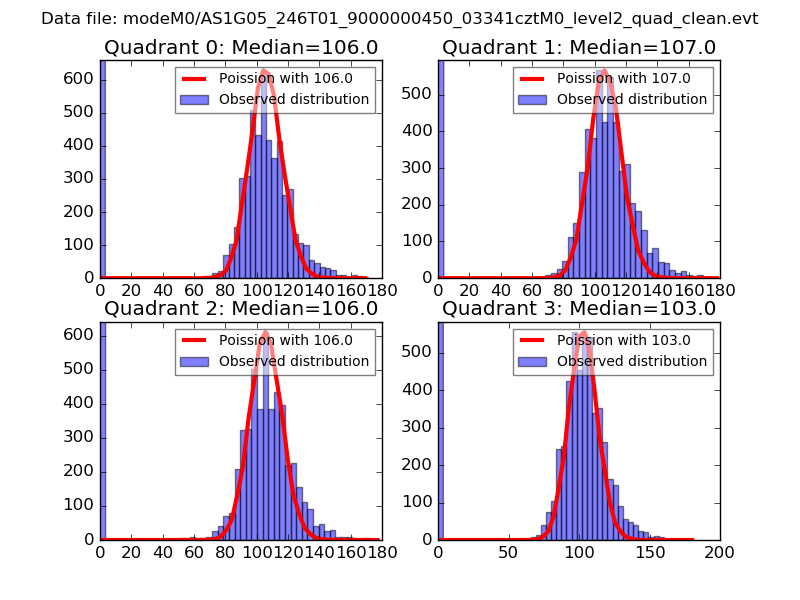 |
 |
| Quadrant-wise count rates Data is divided into 100 sec bins |
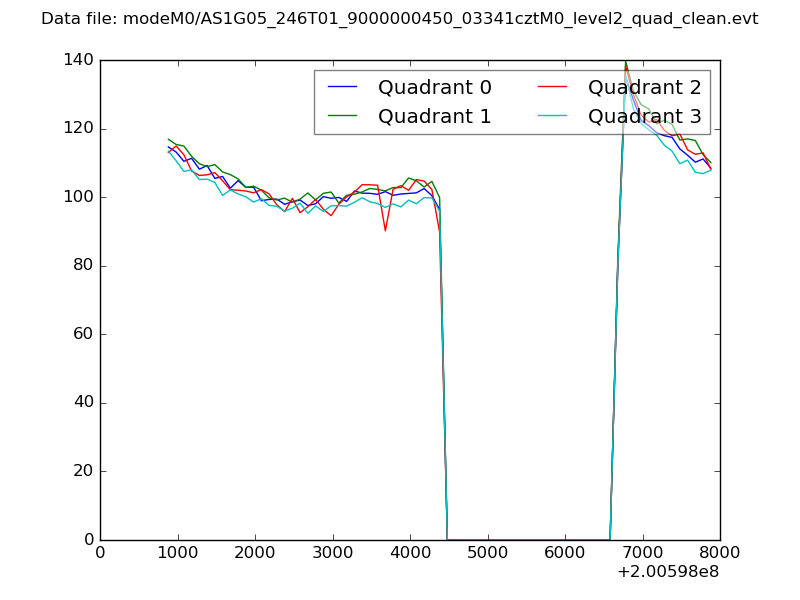 |
|
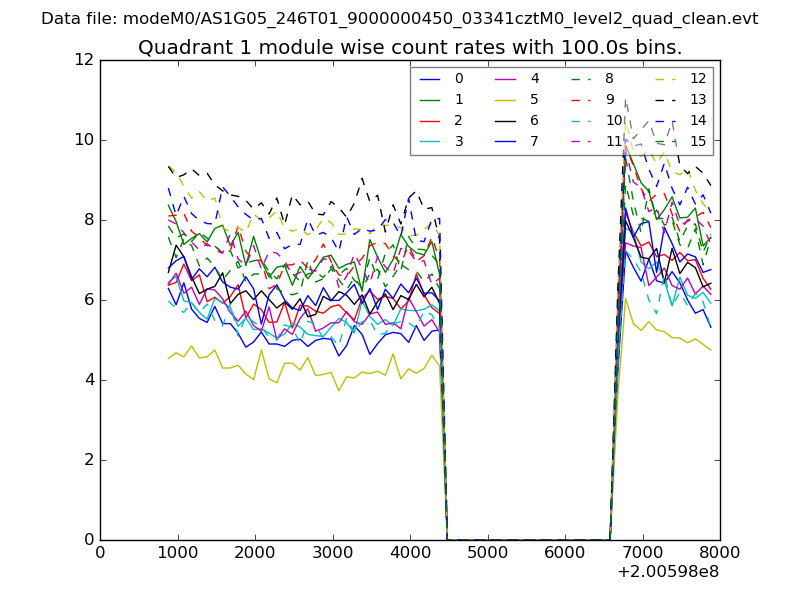
| Module-wise count rates for Quadrant A Data is divided into 100 sec bins |
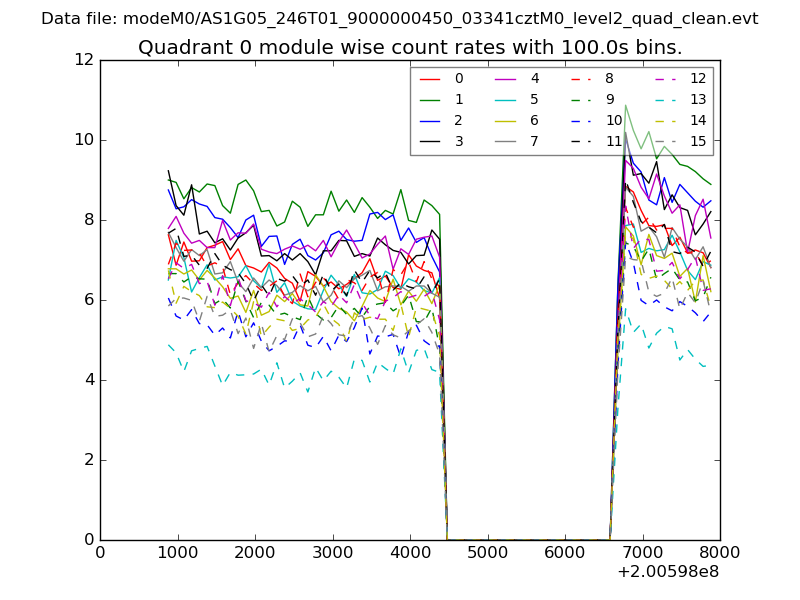 |
 |
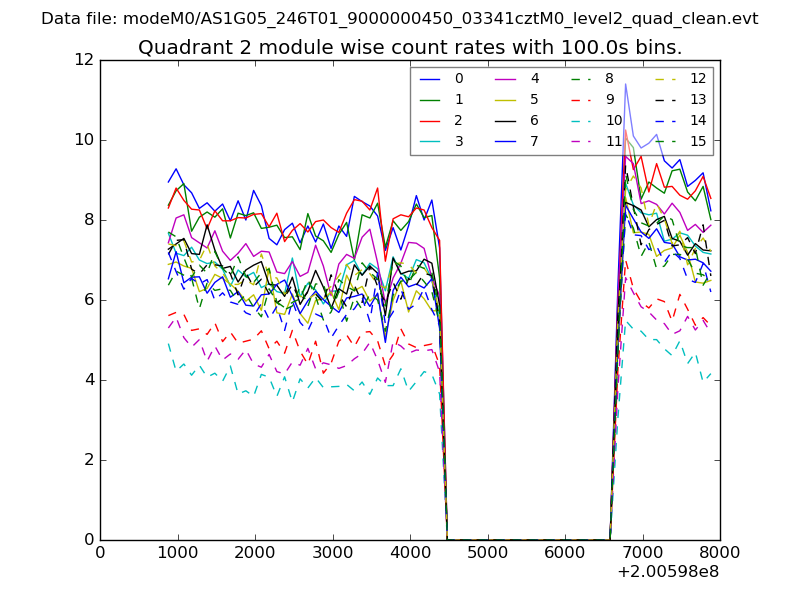
| Module-wise count rates for Quadrant B Data is divided into 100 sec bins |
 |
 |
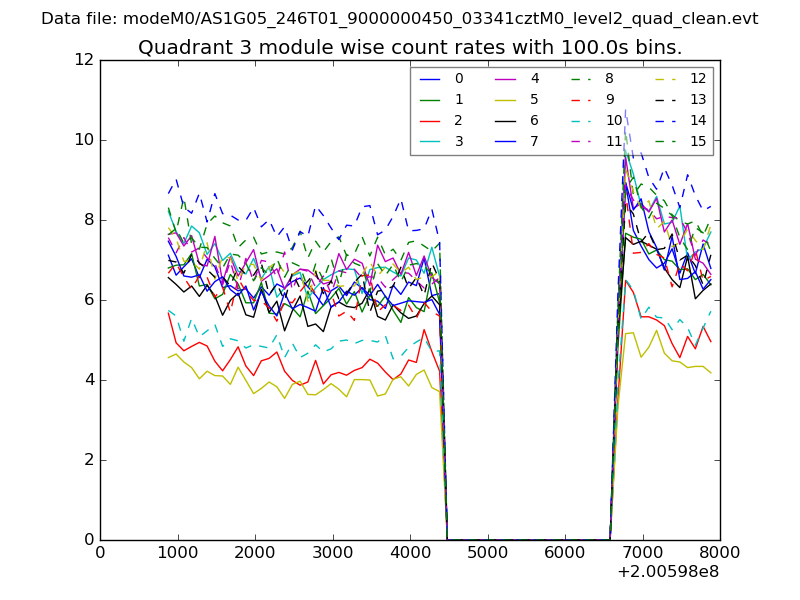
| Module-wise count rates for Quadrant C Data is divided into 100 sec bins |
 |
 |
| Module-wise count rates for Quadrant D Data is divided into 100 sec bins |
 |
 |
| Parameter | Plot |
|---|---|
| CZT HV Monitor | 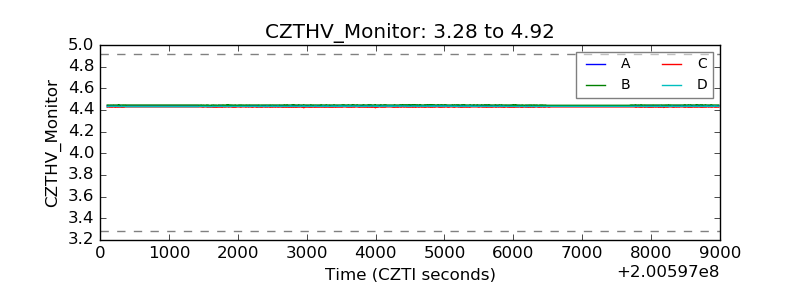 |
| D_VDD | 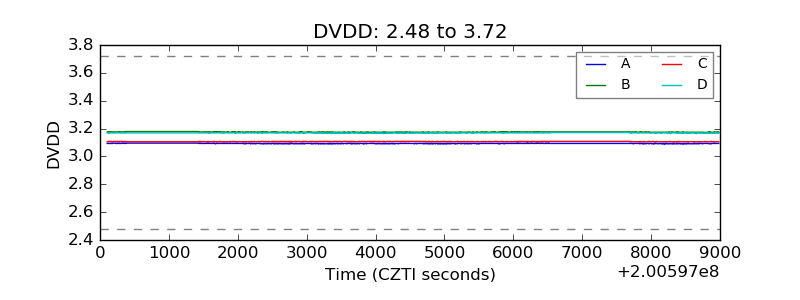 |
| Temperature 1 | 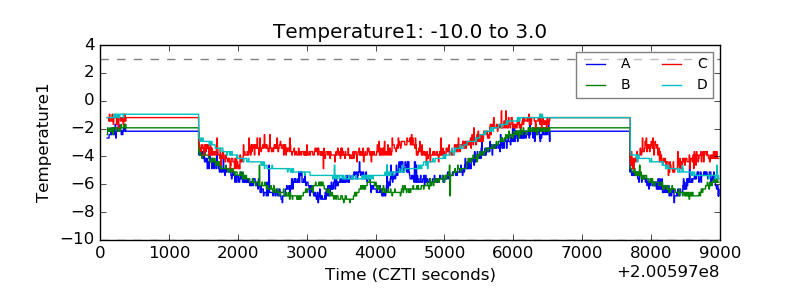 |
| Veto HV Monitor |  |
| Veto LLD | 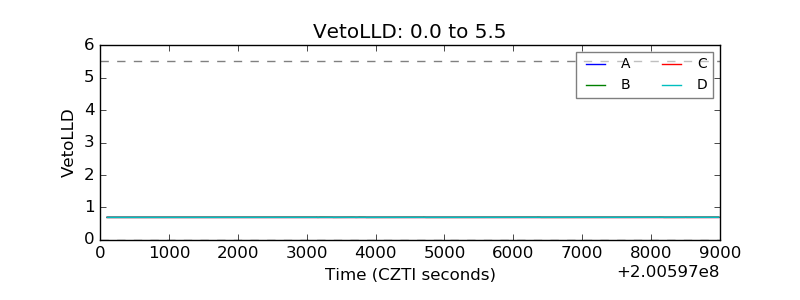 |
| Alpha Counter | 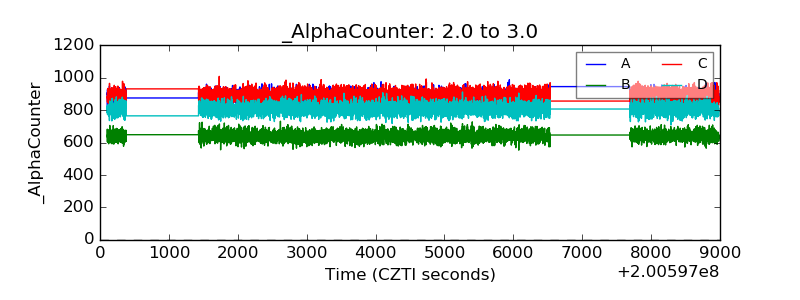 |
| _CPM_Rate | 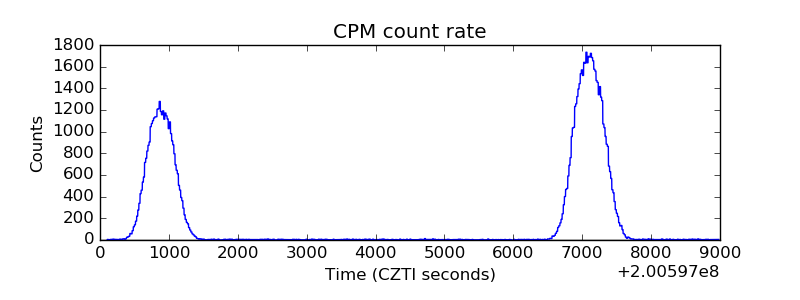 |
| CZT Counter | 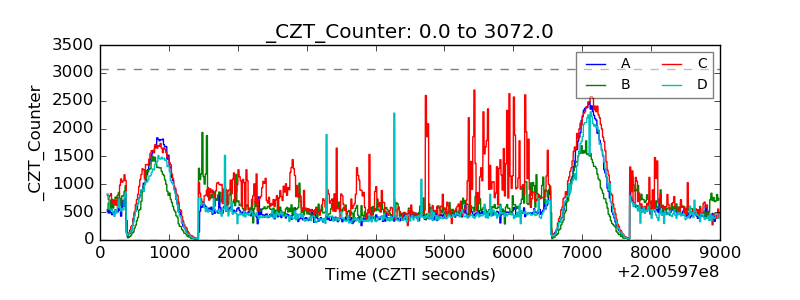 |
| +2.5 Volts monitor |  |
| +5 Volts monitor |  |
| _ROLL_ROT | 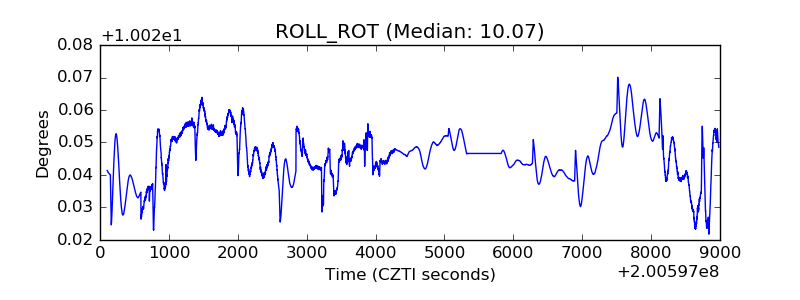 |
| _Roll_DEC | 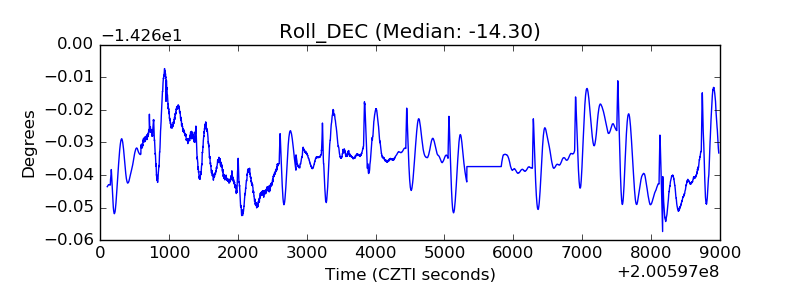 |
| _Roll_RA | 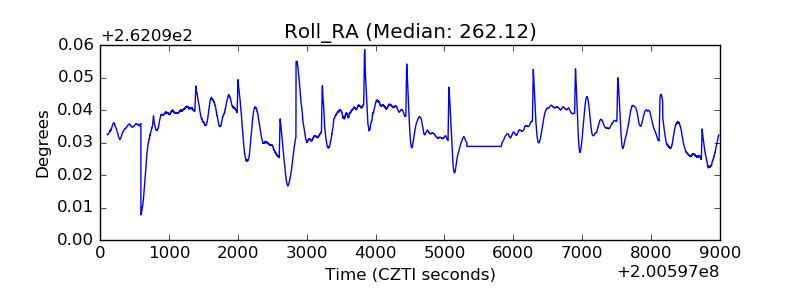 |
| Veto Counter | 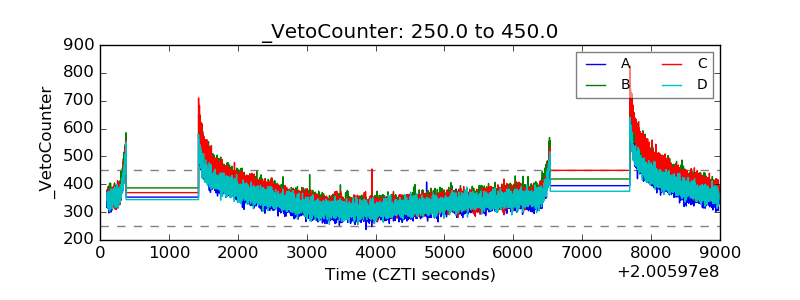 |